Version 2.0: Publish Date 20/11/2012
Type: bullish continuation
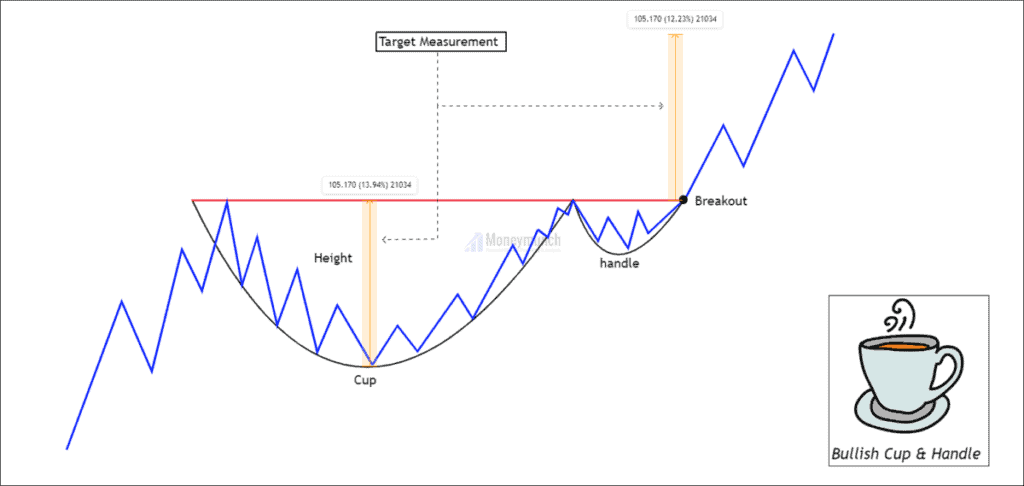
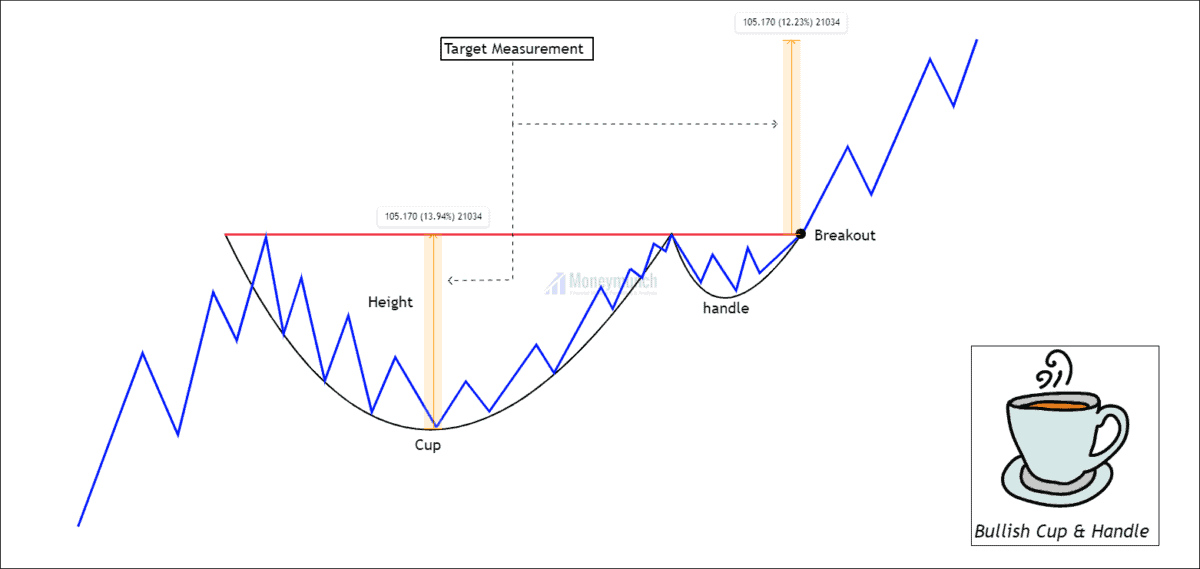
A cup and handle is a popular chart pattern among technicians. It had developed by William O’Neil and introduced in 1998. As the name suggests, the pattern is shaped like a cup with a handle. The shape of the cup is “U”, and the handle is pointing downward. The cup has a “U” shape and a downward-pointing handle. The ending point of the handle indicates buying opportunity. As soon as this part of the price formation is complete, the stock may reverse course and reach higher levels.
1. Prior trend: We are trading bullish continuation Cup & handle. So, the prior trend should be upward. It shows that the price will continue to trend after a retracement of the previous impulse. Buyers are generating demand to push the trend.
2. Construction: “U” shaped bottoms are an ideal pattern and more reliable than “V” bottoms because there is almost no consolidation in this case. The perfect pattern would have equal highs on both sides of the cup, but this does not often occur.
3. Duration: It is possible to spread the cup out over 1 to 6 months, and occasionally longer. The handle should form and finish over a period of 1-4 weeks.
4. Breakout: The pattern confirms a bullish trend when it breaks above the neckline formed by the previous highs with good volume. A buy point is reached when the stock breaks out or moves upward through the old resistance level (right side of the cup).
5. Volume: During the base of the bowl, the volume should decrease as prices decline, remaining lower than average; then, it should increase when the stock begins to move higher, back up to the previous high.
6. Timeframe:
- Cup and handle patterns can unfold over weeks or months.
- Adapt your trading strategy to your preferred time frame.
7. Profit targets: It is calculated based on the depth of the cup as a profit target. The breakout level can be determined by extending the distance from the bottom of the cup to the neckline and measuring upward from there.
8. Stop-loss: It is ideal to place the stop-loss at the bottom of the handle. Also, You can place the stop-loss below the swing low if the price oscillated within the handle several times.
 Unlock This Article
TABLE OF CONTENTS
Candlestick and Chart Patterns (15 Days)
7 Most Important Candlestick Chart Patterns
- Gap Down Chart Pattern
- Gap Up Chart Pattern
- Gravestone Short-term Chart Pattern
- Hammer Candle Stick Chart Pattern
- Hanging Man Short-term Stock Chart Pattern
- Inverted Hammer Stock Chart Pattern
- Shooting Star Candle Stick Pattern
Top 2 Bearish Chart Patterns
Top 6 Bullish Chart Patterns
- Engulfing Line (Bullish) Chart Pattern
- Exhaustion Bar Chart Pattern (Bullish)
- Inside Bar Chart Pattern
- Island Bottom Chart Pattern
- Key Reversal Bar (Bullish) Chart Pattern
- Two Bar Reversal (Bullish) Chart Pattern
Indicators & Oscillators (12 Days)
Bullish or Bearish Indicators
Bullish or Bearish Oscillators
- Bollinger Bands Oscillator
- Commodity Channel Index (CCI)
- Fast Stochastic Oscillator
- Know Sure Thing (KST) Oscillator
- Momentum Oscillator
- Moving Average Convergence/Divergence (MACD) Oscillator
- Relative Strength Index (RSI)
- Slow Stochastic Oscillator
- Williams %R Oscillator
Classic Chart Patterns (29 Days)
Bearish Classic Chart Patterns
- Continuation Diamond (Bearish) Chart Pattern
- Continuation Wedge (Bearish)
- Descending Continuation Triangle Chart Pattern
- Diamond Top Chart Pattern
- Double Top Chart Pattern
- Downside Break Chart Pattern – Rectangle
- Flag Bearish Chart Pattern
- Head and Shoulders Top Chart Pattern
- Megaphone Top Chart Pattern
- Pennant Bearish Chart Pattern
- Rounded Top Chart Pattern
- Symmetrical Continuation Triangle (Bearish)
- Top Triangle/Wedge Chart Pattern
- Triple Top Chart Pattern
Bullish Classic Chart Patterns
- Ascending Continuation Triangle Chart Pattern
- Bottom Triangle Or Wedge Chart Pattern
- Continuation Diamond (Bullish) Chart Pattern
- Continuation Wedge Chart Pattern (Bullish)
- Cup with Handle Bullish Chart Pattern
- Diamond Bottom Chart Pattern
- Double Bottom Chart Pattern
- Flag Bullish Chart Pattern
- Head and Shoulders Bottom Chart Pattern
- Megaphone Bottom Chart Pattern
- Pennant Bullish Chart Pattern
- Round Bottom Chart Pattern
- Symmetrical Continuation Triangle Bullish
- Triple Bottom Chart Pattern
- Upside Breakout Chart Pattern – Rectangle
Best Trading Theories (4 Days)
- Basics of Dow theory trading strategy forecasts
- Motive (Impulse) Waves
- Corrective Waves
- Wyckoff Chart Reading
Kind attention: this course is helpful for beginner and intermediate traders. It’s free for everyone. Advanced modules, trading strategies, and data (in-depth) are available for Moneymunch’s premium subscribers.
Get free important share market ideas on stocks & nifty tips chart setups, analysis for the upcoming session, and more by joining the below link: Stock Tips
Have you any questions/feedback about this article? Please leave your queries in the comment box for answers.
Looking trading training