Timeframe: Daily
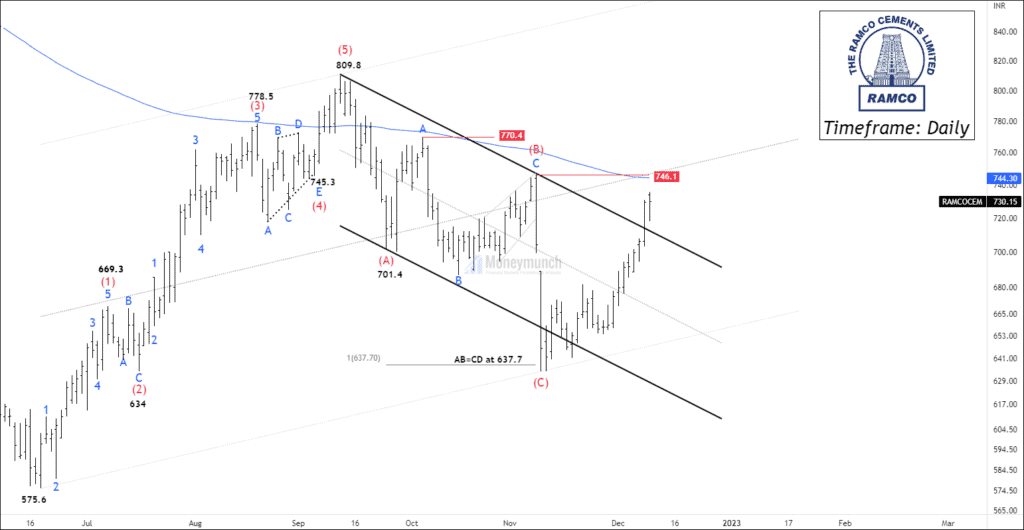
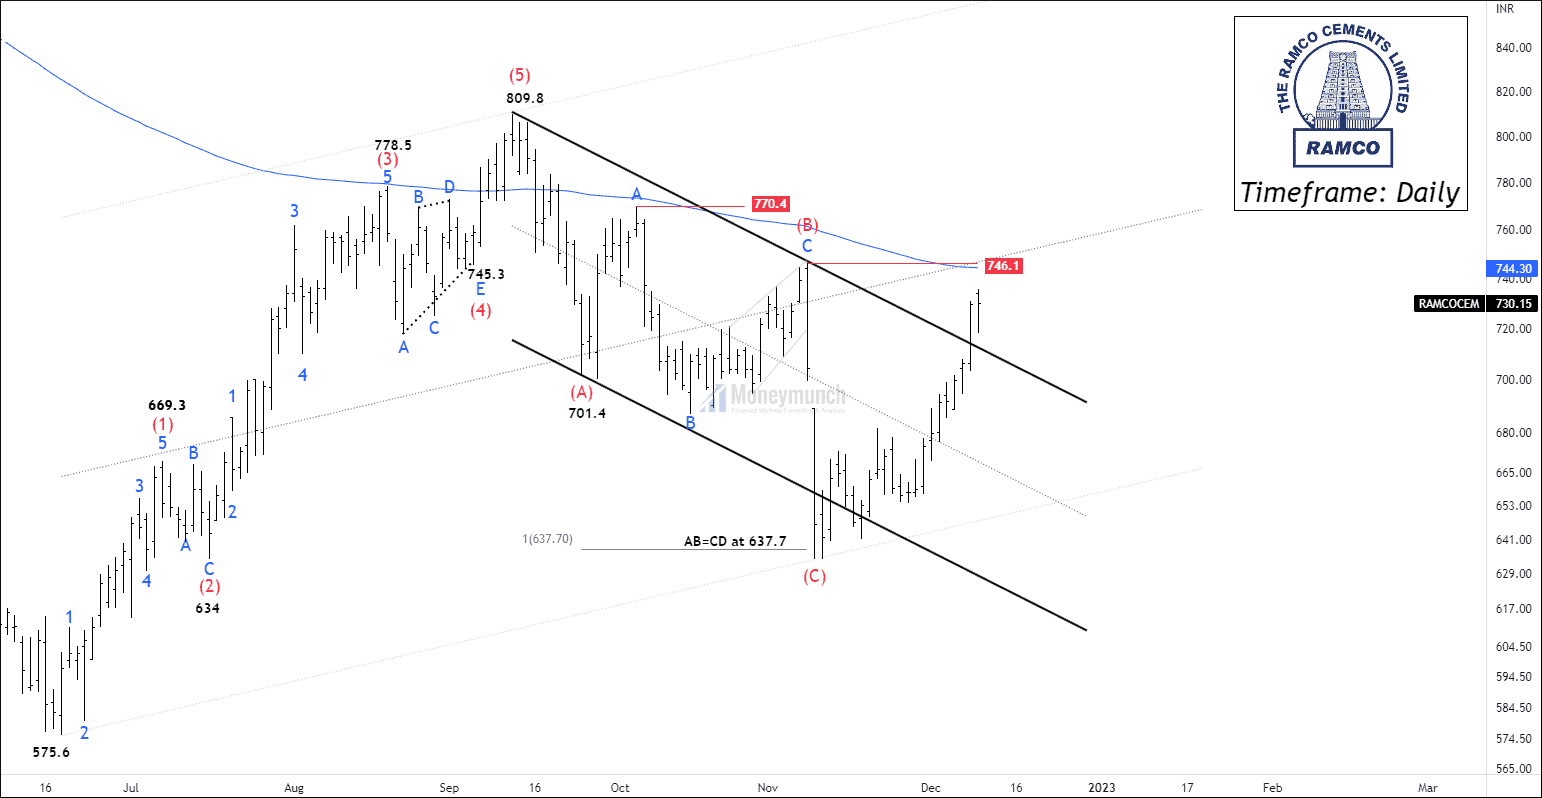
NSE RAMCOCEM has formed an impulsive cycle from the low of 575.6, which competed at 809.8. The ending point of the impulsive wave marks the beginning of the corrective wave. Price started constructing a corrective phase after a high of 809.8.
The corrective structure ended at 634.05, and we saw a sharp upward move. Price has a broken-out corrective channel & moving towards wave B and the 200 Exponential moving average.
If the price sustains above 200 MA and breaks wave B, traders can trade for the following targets: 770 – 791 – 806+. Safe traders can enter In a trade after a pullback.
The opposite scenario can be the worst. If the price fails to sustain above wave B, it will be a disastrous double-top pattern. In this case, traders can short for the following targets: 707 – 685 – 670.
To become a subscriber, subscribe to our free newsletter services. Our service is free for all.
Get free important share market ideas on stocks & nifty tips chart setups, analysis for the upcoming session, and more by joining the below link: Stock Tips
Have you any questions/feedback about this article? Please leave your queries in the comment box for answers.


Good insight
We have similar views on ramcocem. Keep charts coming.
Agree with you, thanks for sharing.
Scary but possible scenario