MCX Natural Gas – Trading Insight & Updates

Did you trade the MCX natural gas wave projection?
Click here: MCX Natural Gas – Is Wave (E) Bottoming Out?

Free naturalgas calls

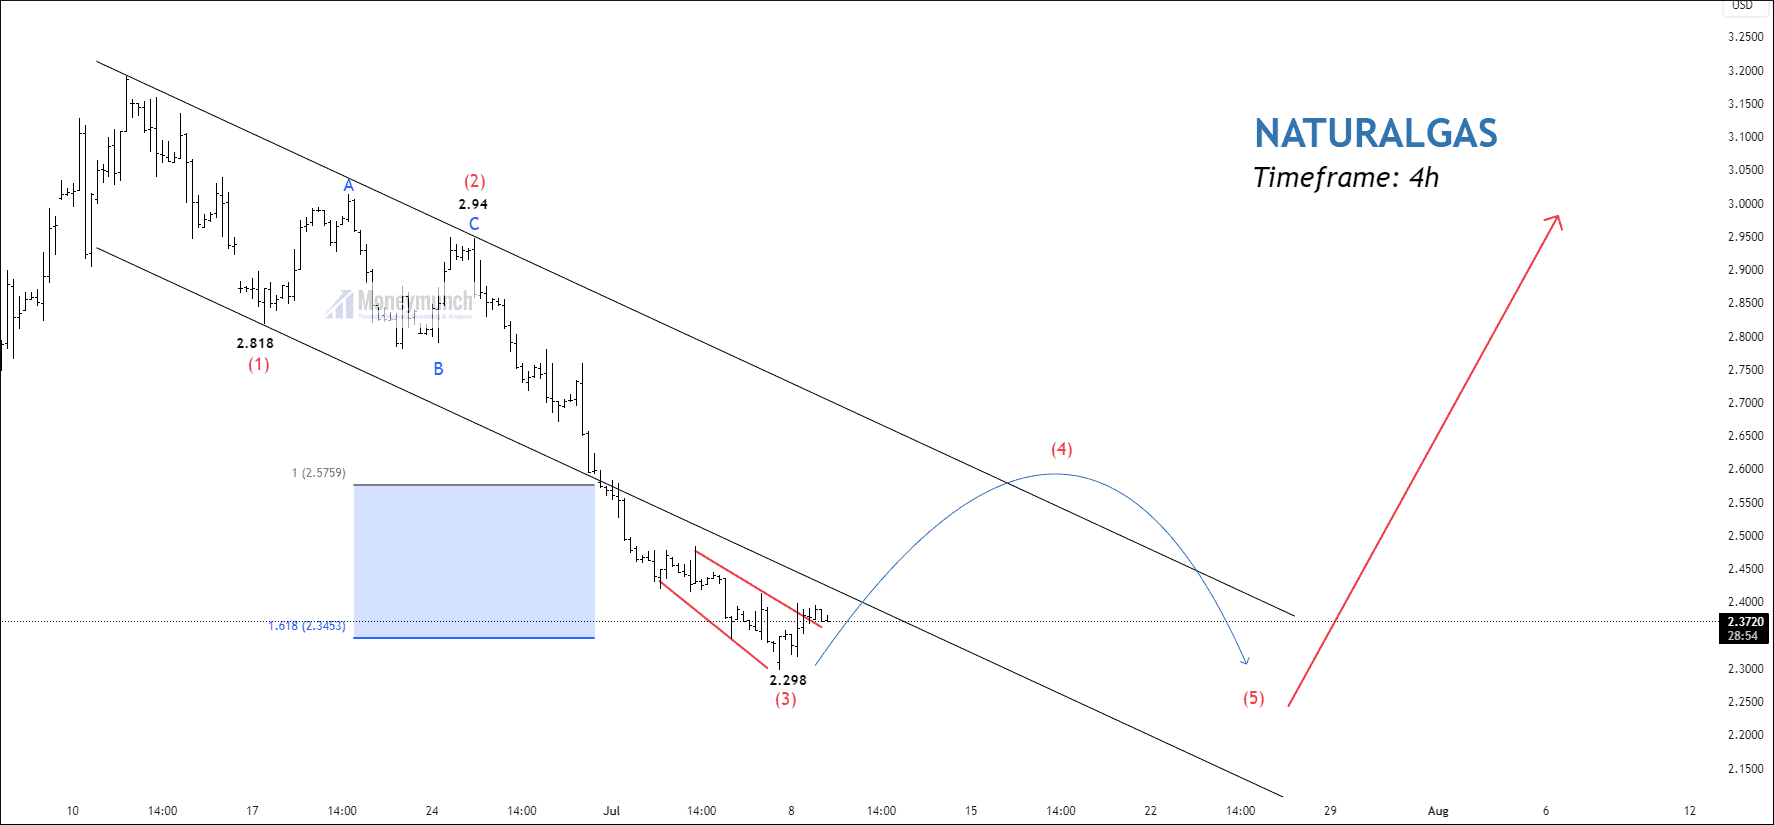
Figure 1. MCX Natural Gas BEFORE chart

We had written clearly, “The chart suggests a potential bounce, targeting the following levels 275 – 300 – 320 – 350 in the medium term.”

Free nse naturalgas chart calls

Figure 2. MCX Natural Gas AFTER chart

Timeline:
  • First update: 8 September 2025
    MCX reached the first target of 275.
  • Second update: 1 October 2025
    The price touched the second target of 300.
  • Third update: 29 October 2025
    The price hit the third target of 320.
  • Final update: 29 October 2025
    MCX Natural gas achieved the final target of 350
👉 If you had traded this setup even for the second target, you could have made more than 160 points in this swing setup.
Continue reading

RESEARCH REPORT – MCX SILVER, GOLD & NATURAL GAS

MCX SILVER – Bull Victory

Did you take a trade based on the MCX Silver price action breakdown?
Click here: MCX Silver: The Path to 1,11,000 or a Dip to 80,000?

Free MCX silver chart calls

We had written clearly, “Short-term targets could be 95960-98160-99600. After the breakout, we can see a massive move up to 1,11,000.

Timeline:

[16 April 2025]

  • 12:45 PM: Price hit the first target of  95960.

[29 April 2025]

  • 02:00 PM: Price reached the second target of 98160.

[2 June 2025]

  • 06:45 PM: Silver touched the second target of 99600.

[18 June 2025]

  • 02:25 PM: Price made a new high of 109,692.

[11 July 2025]

  • 11:00 AM: MCX SILVER hit the final target of 1,11,000.

If you have traded this setup, you could have accumulated more than 18,000 points.

MCX Natural Gas – Is Wave (E) Bottoming Out?

Free naturalgas calls

Continue reading