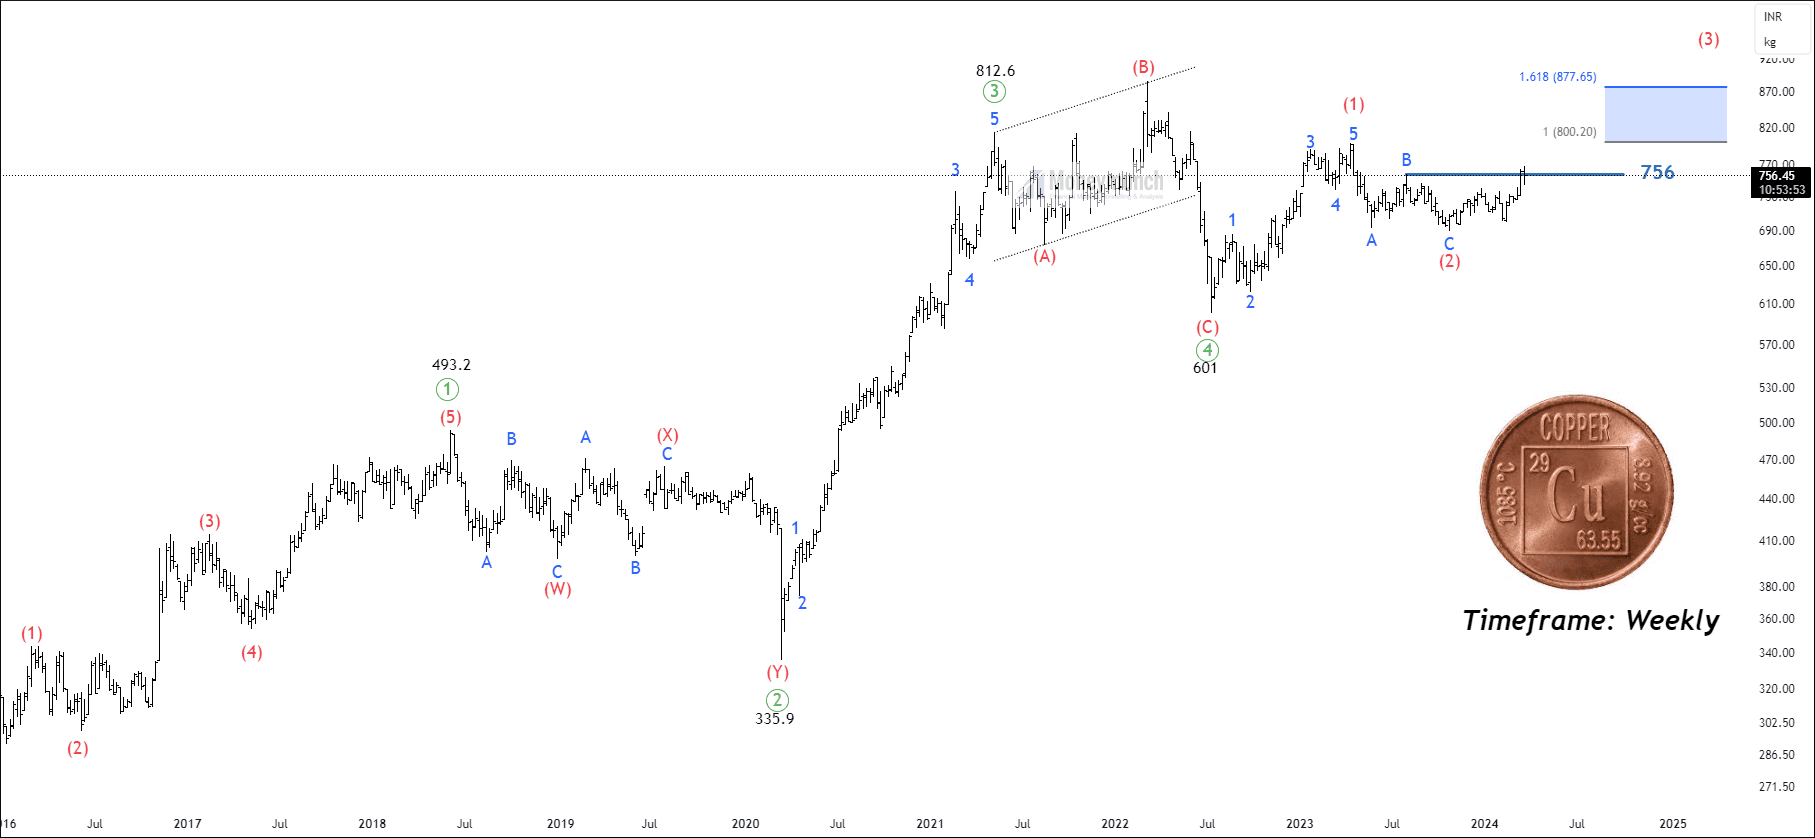
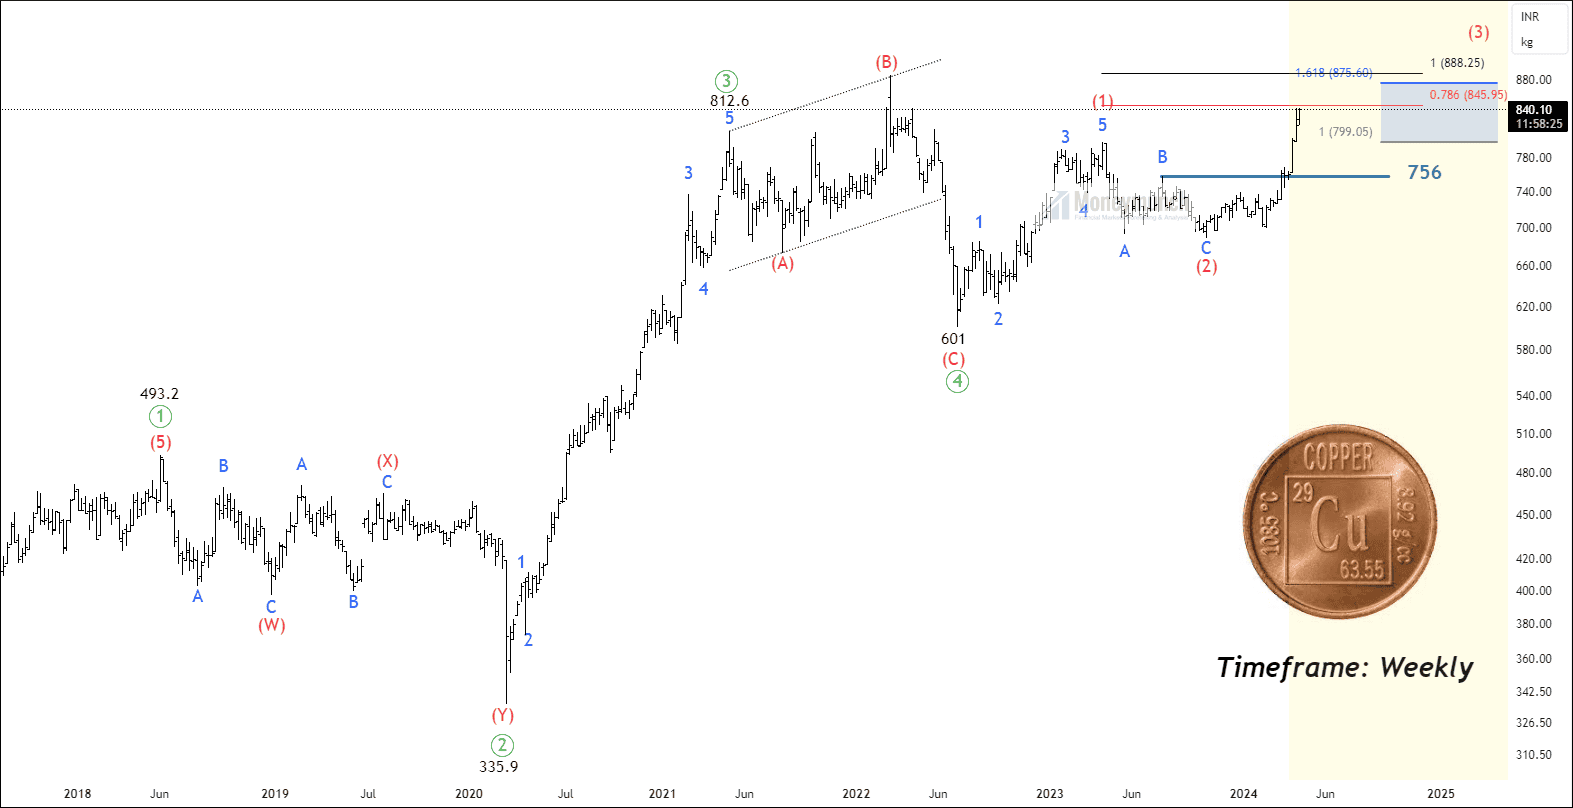
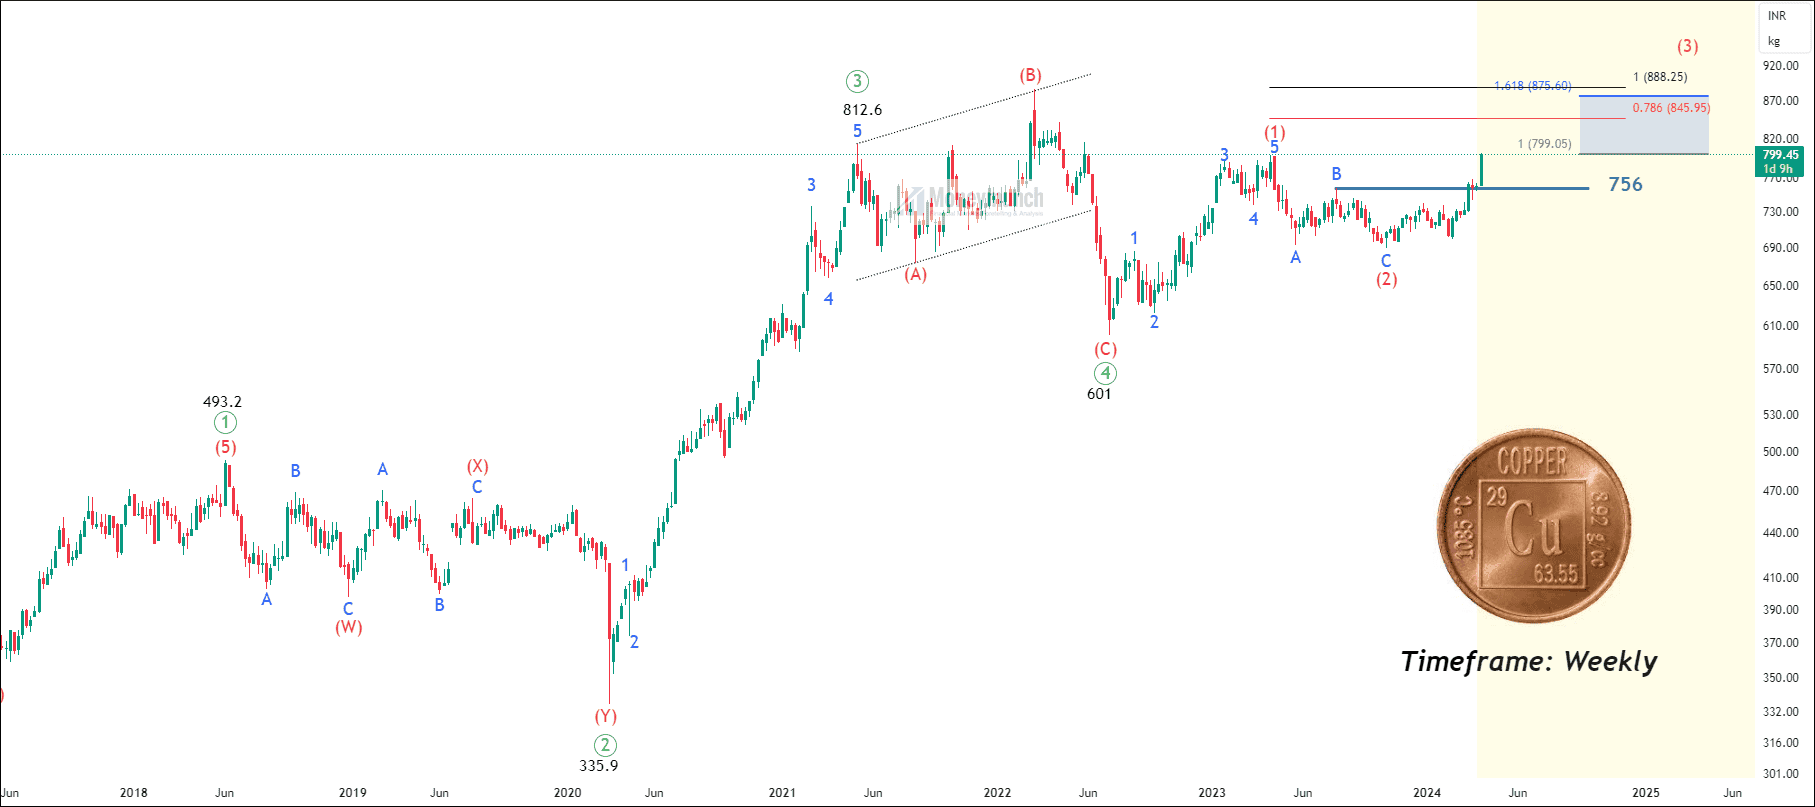
The long-term outlook of MCX Copper

Free commodity copper tips chart

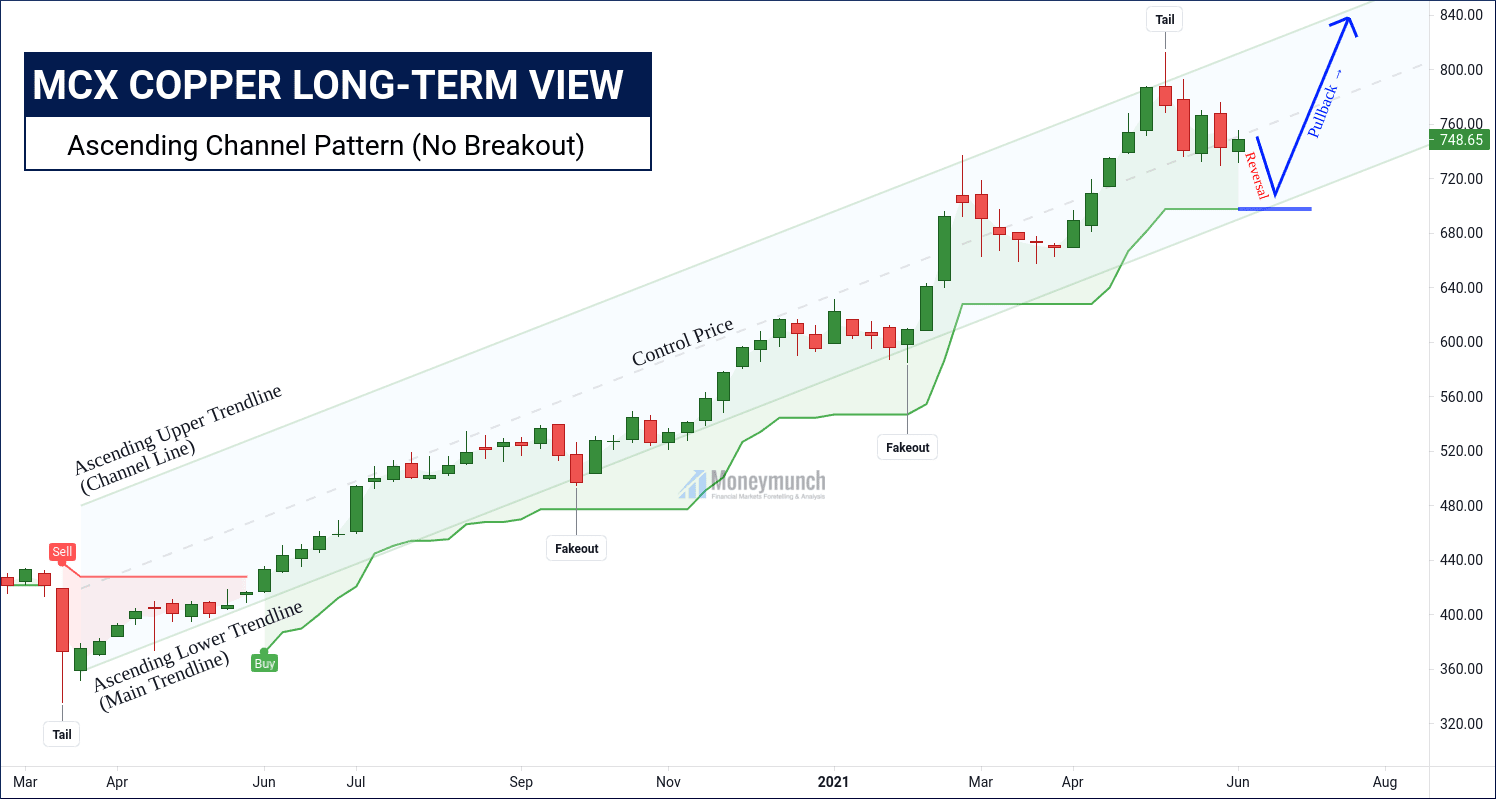
Look at the above weekly chart of MCX Copper. It has created an ascending channel pattern without breakout. This channel started in the previous year’s April month. At present, it’s falling after making a tail. But how much it can go down? Copper may fall more from here, and that can be up to 728 – 710.6 levels.

But overall, it’s on an uptrend. So, soon it will start marching for the following levels:
760 – 780 – 800 – 820 – 840+

To become a subscriber, subscribe to our free newsletter services. Our service is free for all.

Continue reading

Here’s Why MCX Copper Yesterday Moved Down

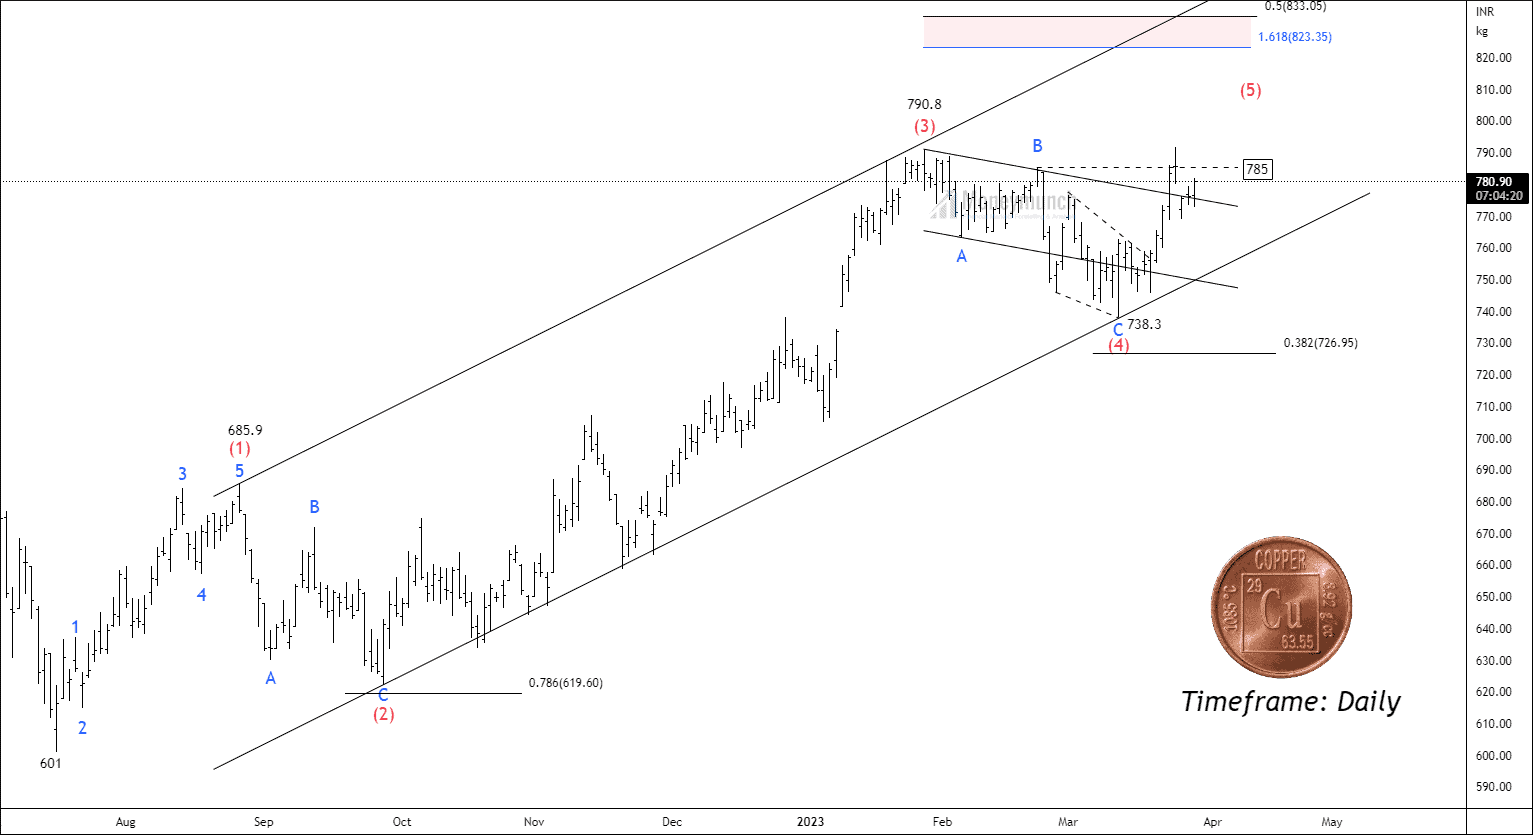
free commodity copper daily chart tips

LONG-TERM INVESTORS:
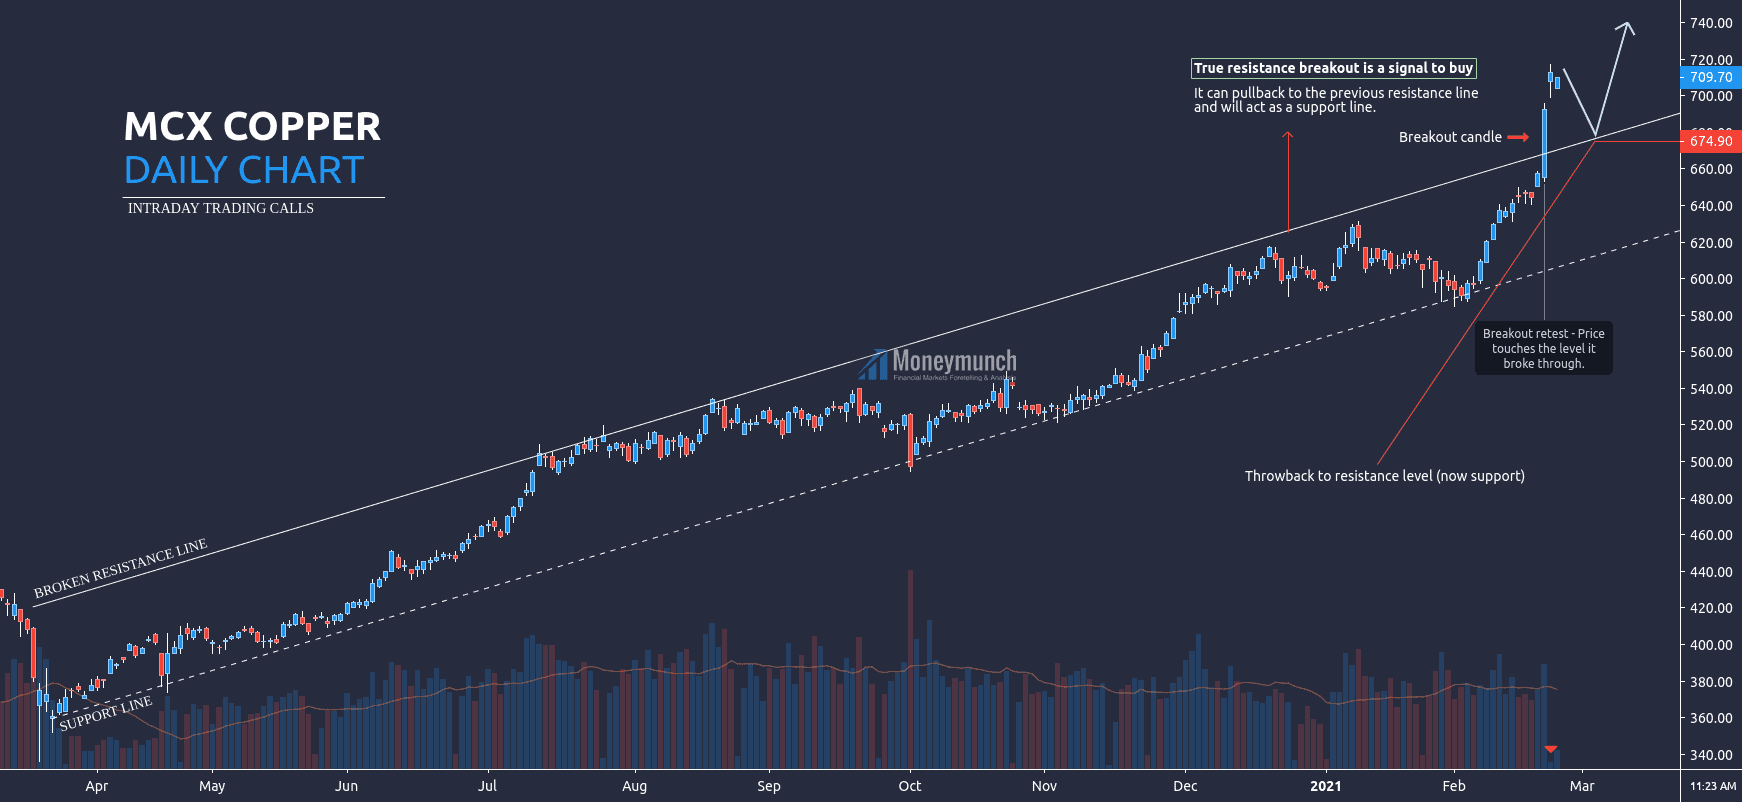
Copper has broken March 2020 resistance trend line, and true resistance breakout is a clear signal to buy. Target prices for long-term traders: 760 – 800+

INTRADAY TRADERS:
But at present, MCX copper can pull back to the previous resistance line to continue an uptrend. So, intraday traders can sell for the following targets: 690 – 680 – 676

To become a subscriber, subscribe to our free newsletter services. Our service is free for all.

Continue reading