Did you trade BTCUSD Price action setup?
Click here: BTCUSD – Price Action Breakdown
 AFTER
AFTER
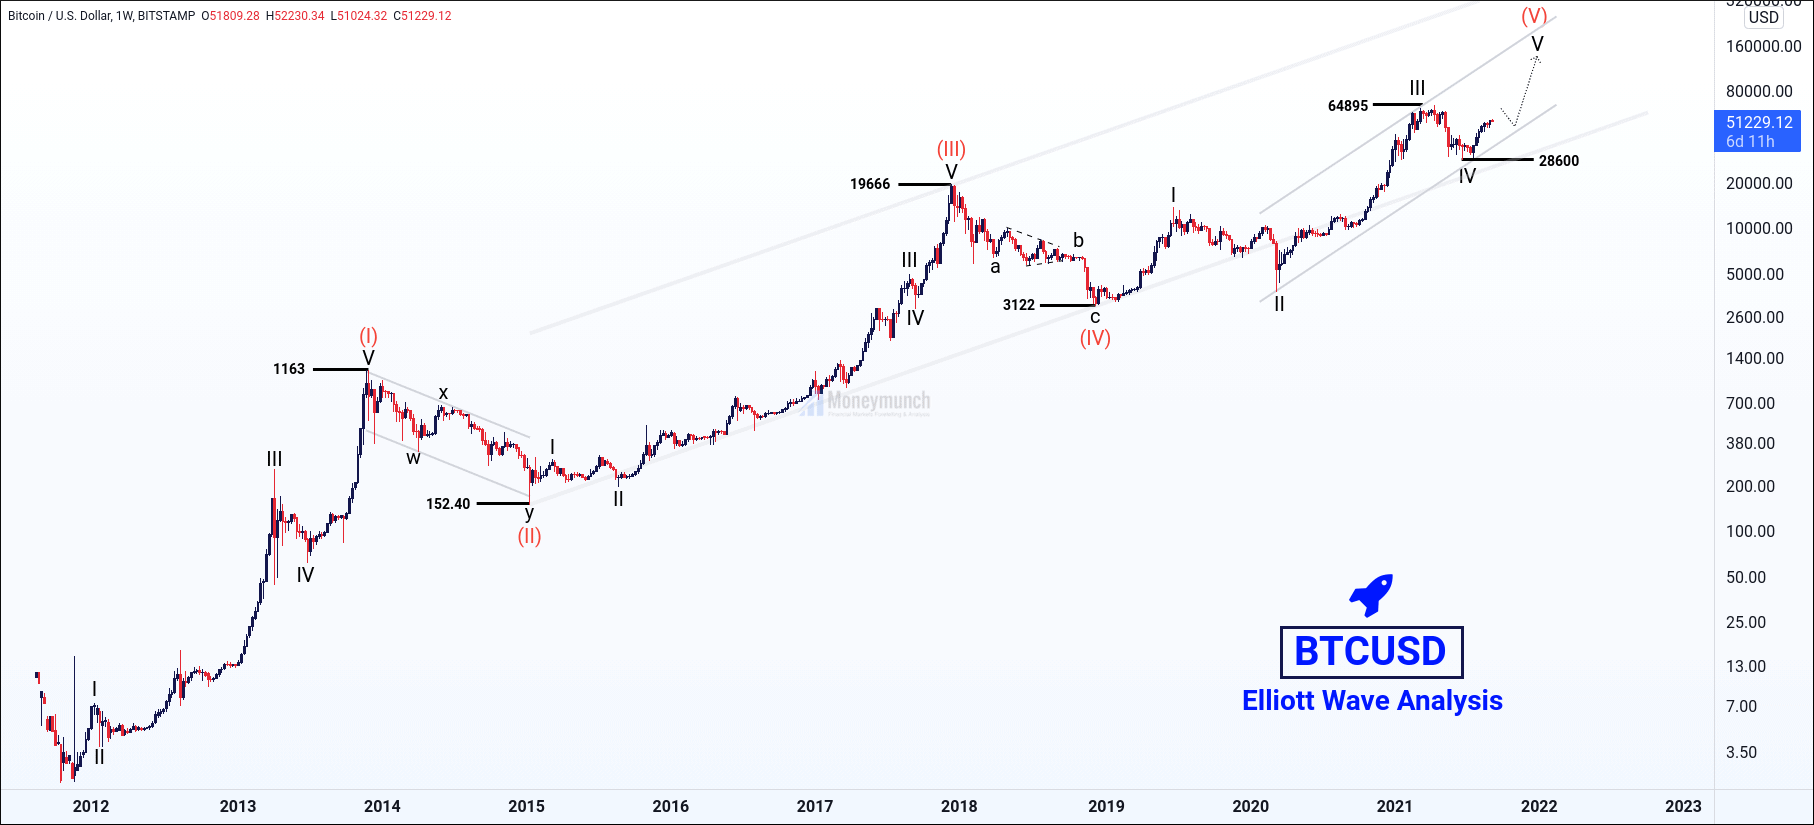
Looking for reliable cryptocurrency trading signals and analysis for the BTCUSD pair? Look no further than Moneymunch! Our team of experts provides free technical and fundamental analysis, research reports, and daily or weekly charts to help you stay ahead of the game. Subscribe now and get the latest BTCUSD forecast and signals straight to your inbox!
Did you trade BTCUSD Price action setup?
Click here: BTCUSD – Price Action Breakdown
AFTER
Did you trade the BTCUSD Wave Setup?
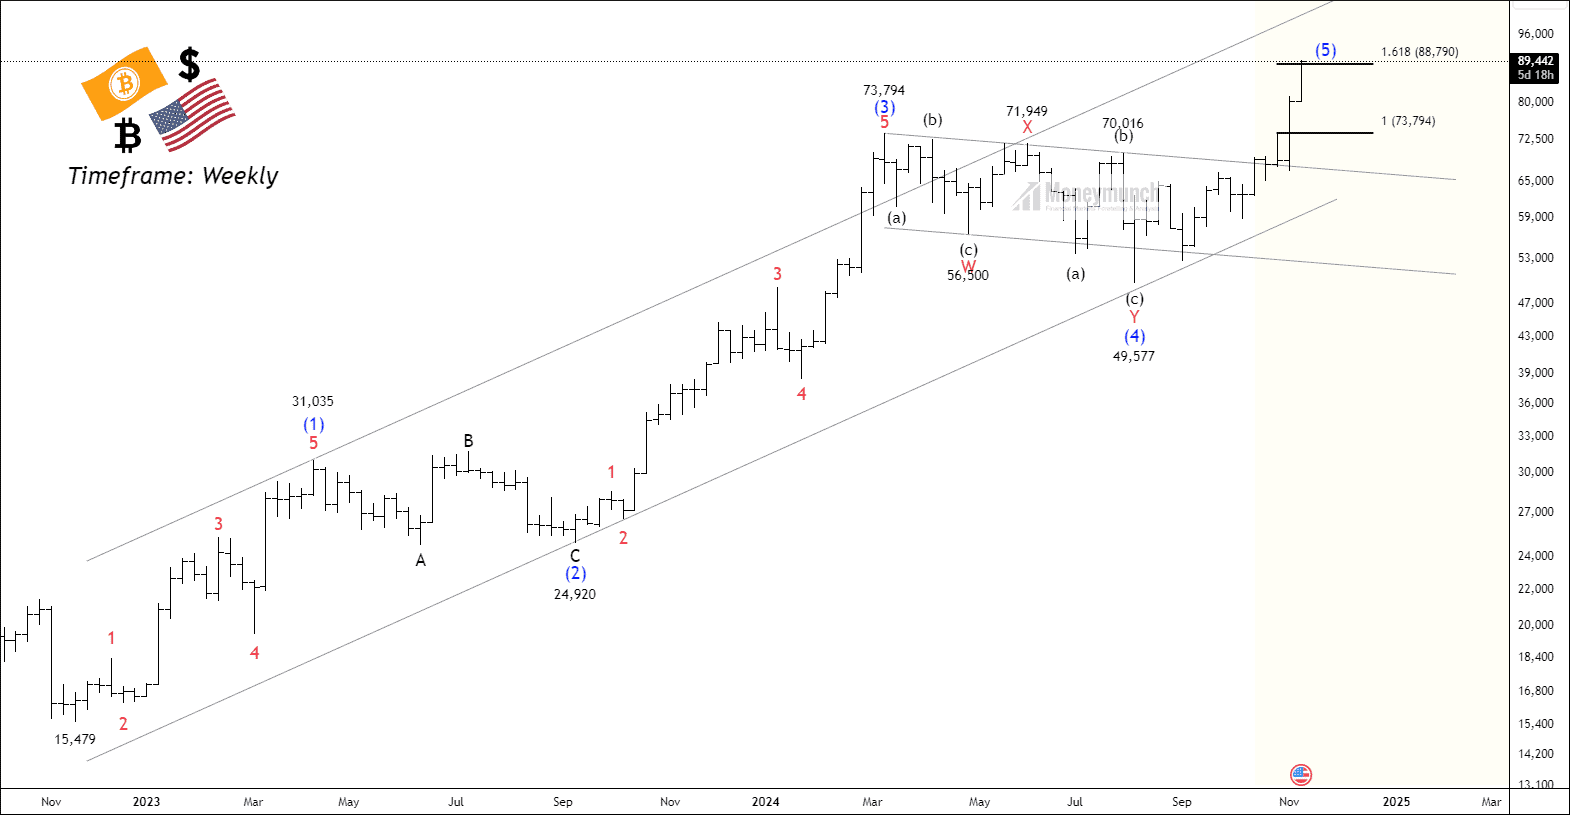
Visit here: The Grand Finale: BTCUSD’s Final Wave (5) Taking Shape
 BEFORE
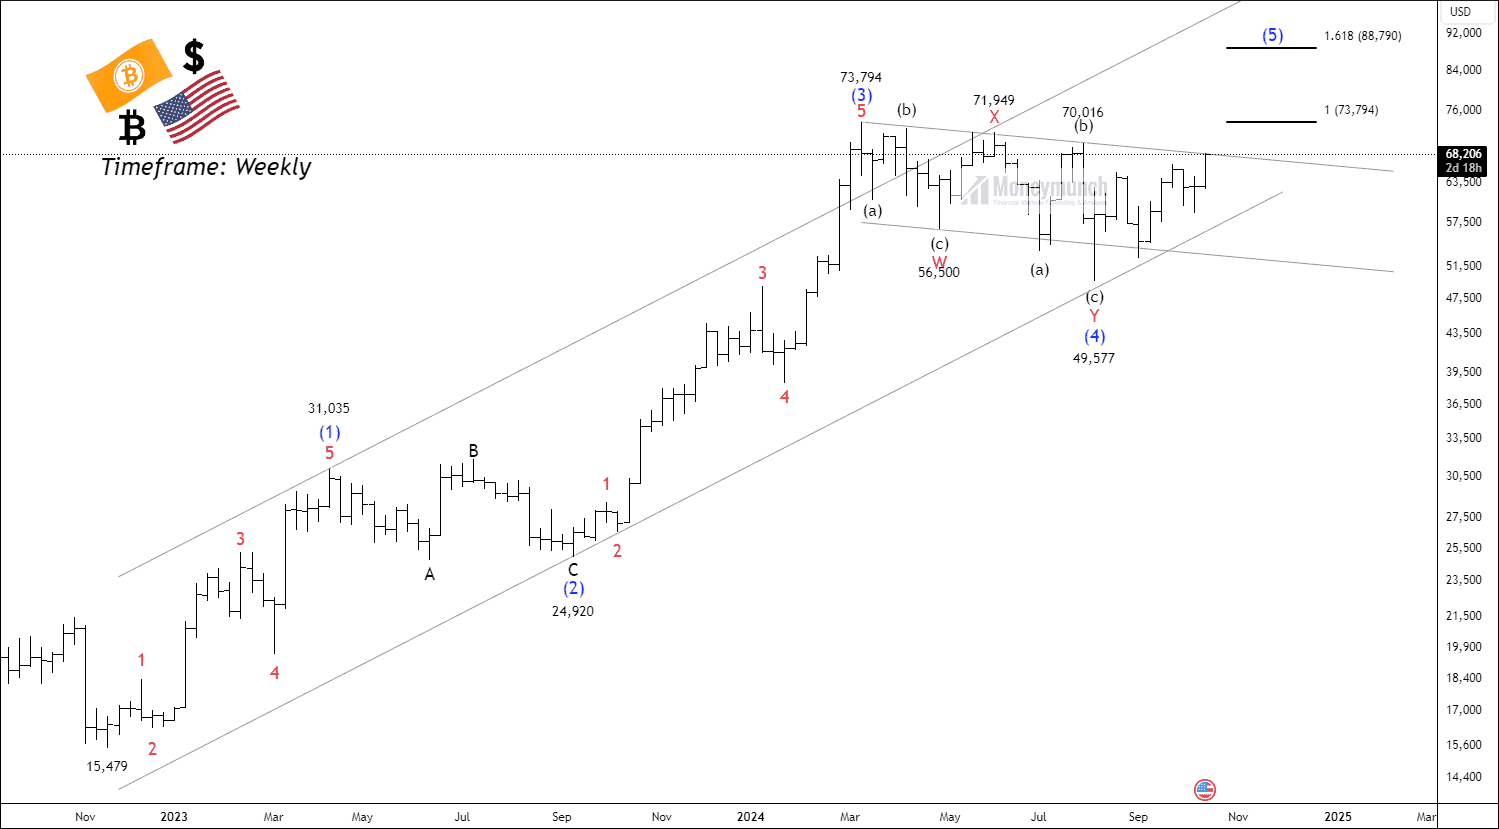
We had written in clear words, “The potential targets extend up to 88,790, which corresponds to the 161.8% Fibonacci extension of wave (4).”
 AFTER
AFTER