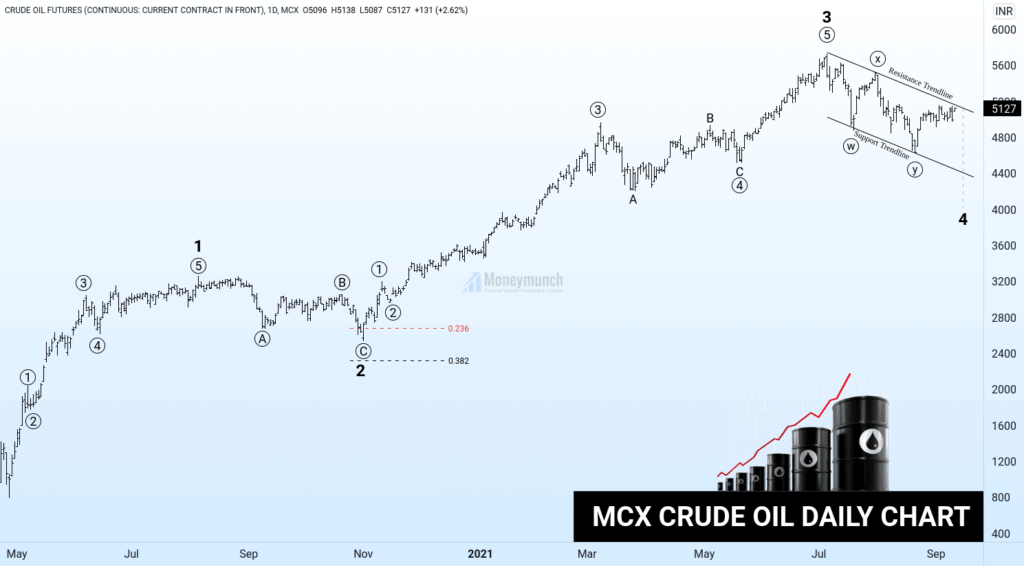
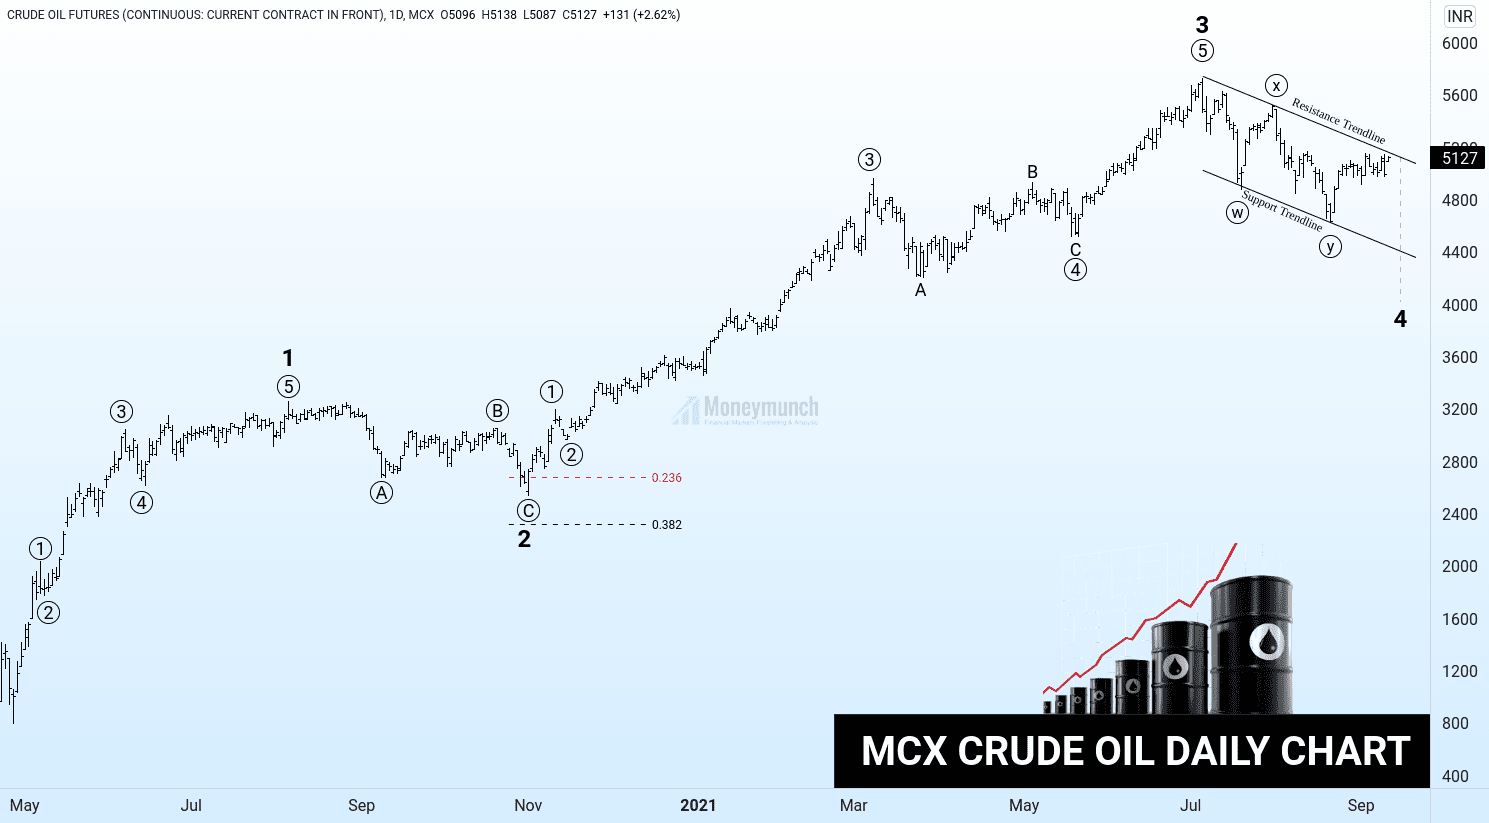
Crude oil has started moving forward since May. And it will not stop here. It’s just a WXY correction.
According to Elliott’s wave theory, it has completed the sub-wave under the 4th wave. It’s consolidation time. Crude oil prices may fluctuate between the range of 4000 – 5400. Hence, long-term investors can keep buying crude oil.
So, what about short-term investors and intraday traders? If you look into 4 hours chart, it seems bullish from here. Crude oil is trying to break the resistance trendline. Whenever that the resistance trendline break, then we may see the prices at 5300 – 5400+.
Kindly note, if crude oil remains below to resistance trendline, then do not buy.
What happens if it does not break the resistance trendline? To become a subscriber, subscribe to our free newsletter services. Our service is free for all.
Get free MCX ideas, chart setups, and analysis for the upcoming session: Commodity Tips →
Have you any questions/feedback about this article? Please leave your queries in the comment box for answers.


Looking forward to the gold’s idea.
Your charting skills are amazing. I want to take Premium service.
I am waiting for the NSE update.
5300 target aya
booked profit thanks
Clean and precise Technical Analysis! Thanks for sharing.
First, you Learn then you remove the “L”
Good call!
Great Idea. Thank you for your great effort. Wish you a lovely weekend
you are brilliant, Master!!!
Wonderful piece of the chart!
Nov 4 opec+ meeting will decide where the market would go.
I believe the energy crisis is just the ‘narrative’. Just political tap closing to ‘create’ a crisis. Always comes in near the highs. Great idea.
Fantastic, it’s Great…
I wish to learn the CFDS and trade like a pro.
Great catch! Good job. All the best guys,
MCX master *DEV*
Sir, This chart is an example of the perfect wave count.
Sirji apka disha dikhaneka tarika sarahniya he.
Dhanyawad.
Brilliant as usual!