MCX Zinc & Aluminum: Technical Insights

free commodity market mcx zinc daily chart and tips

MCX Zinc Analysis

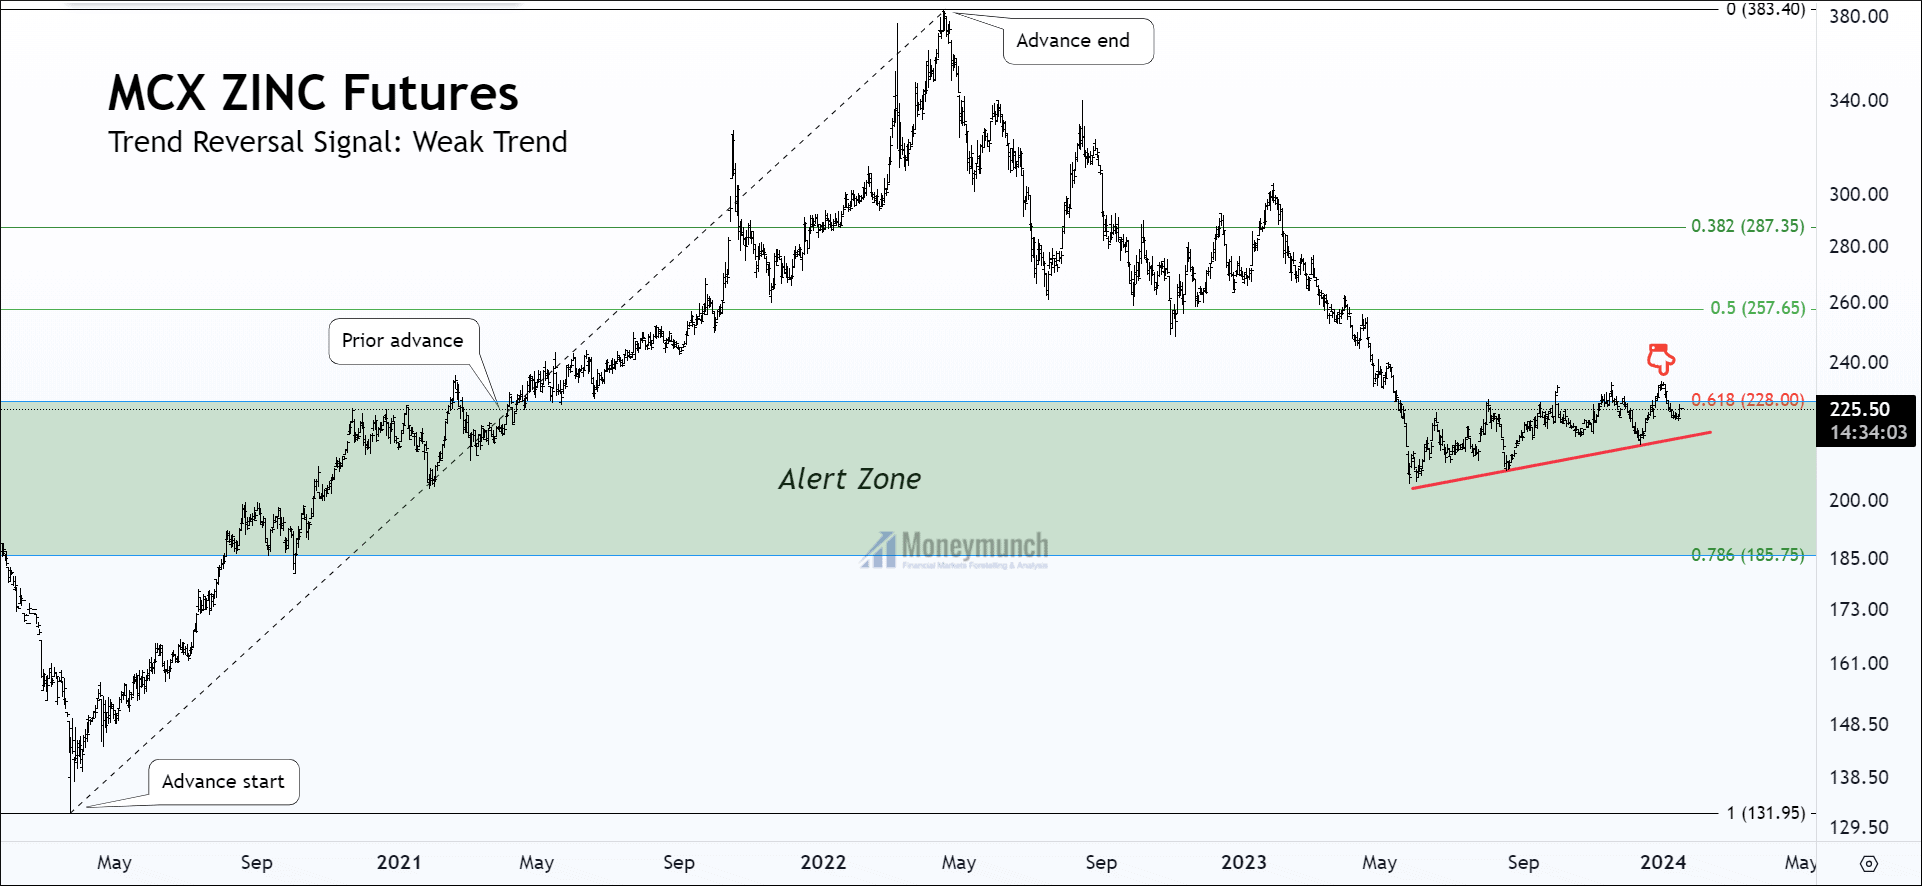
Examining the daily chart of MCX Zinc utilizing Fibonacci retracement, notable developments are observed. In May 2023, Zinc breached the 61.8% retracement level but did not test the subsequent level at 78.6%. Instead, it retraced back to the 61.8% level. The pivotal level of 228 suggests that the downtrend in Zinc may have concluded. This level holds significance as it could propel Zinc upwards, targeting levels of 236, 242, and potentially 257.6.

According to the principles of Fibonacci retracement, a weak trend reversal signal is indicative of a weak trend. Therefore, if Zinc breaches the red trendline, a potential downside with target prices of 212, 206, and 200 could be anticipated. Caution is advised between the 61.8% retracement level and the trendline.

MCX Aluminum Outlook

Get free MCX ideas, chart setups, and analysis for the upcoming session: Commodity Tips

Have you any questions/feedback about this article? Please leave your queries in the comment box for answers.
Disclaimer: The information provided on this website, including but not limited to stock, commodity, and forex trading tips, technical analysis, and research reports, is solely for educational and informational purposes. It should not be considered as financial advice or a recommendation to engage in any trading activity. Trading in stocks, commodities, and forex involves substantial risks, and you should carefully consider your financial situation and consult with a professional advisor before making any trading decisions. Moneymunch.com and its authors do not guarantee the accuracy, completeness, or reliability of the information provided, and shall not be held responsible for any losses or damages incurred as a result of using or relying on such information. Trading in the financial markets is subject to market risks, and past performance is not indicative of future results. By accessing and using this website, you acknowledge and agree to the terms of this disclaimer.

MCX Zinc: Bullish Momentum Ahead

free commodity mcx zinc trading chart & tips

MCX Zinc Signals Potential Bullish Momentum with Clear Target Levels

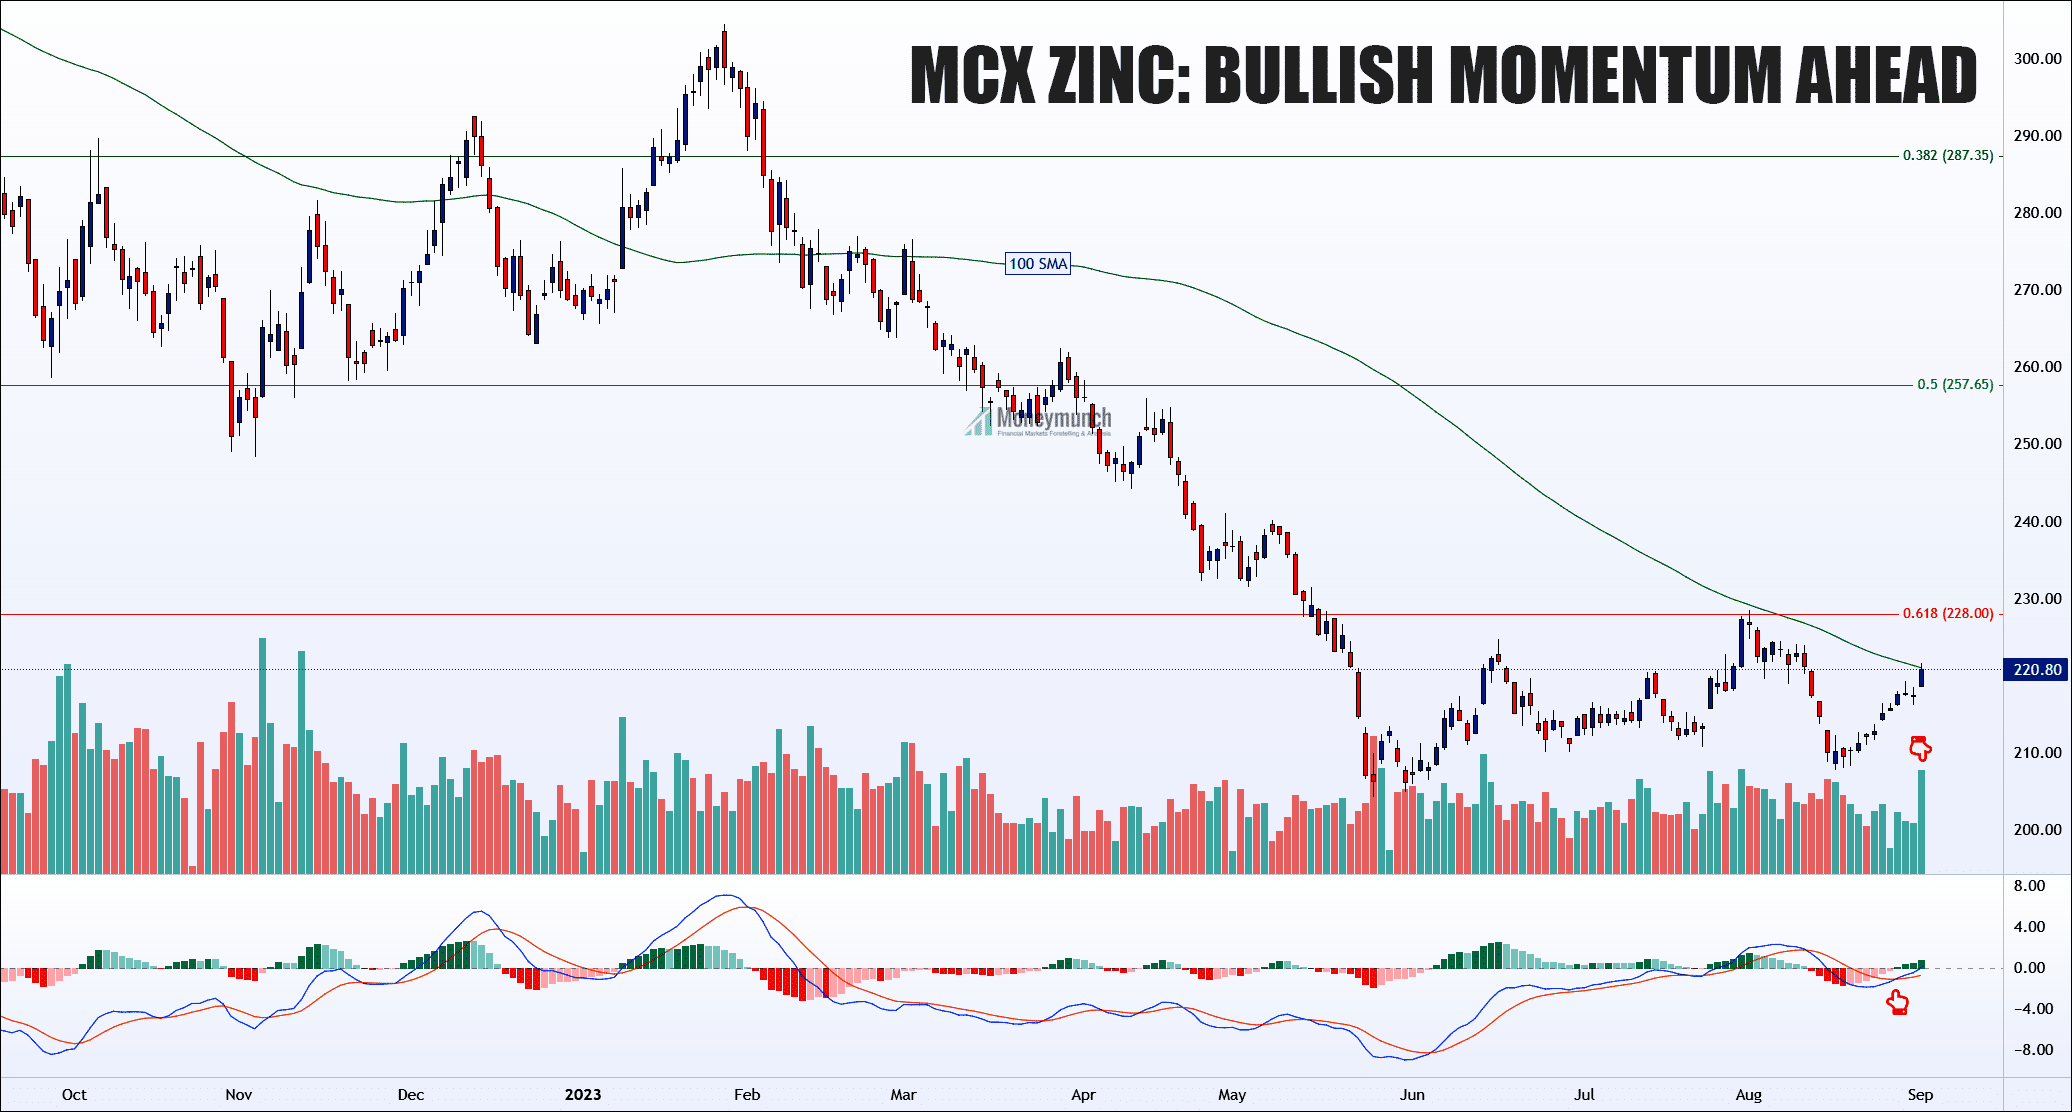
MCX Zinc is currently right at its 100-day Simple Moving Average (SMA). Additionally, we’ve seen a positive crossover on the Moving Average Convergence Divergence (MACD) indicator.

Closing above the SMA 100 is significant, indicating a potential upward move with two target levels at 224 and 228 in the coming days. This is an appealing opportunity for short-term traders.

It’s important to note that initiating a position when the price is below the SMA 100 is not recommended due to higher risk.

Continue reading

EWT – MCX Zinc Is Ready For Its Final Impulse

Free nse zinc chart calls

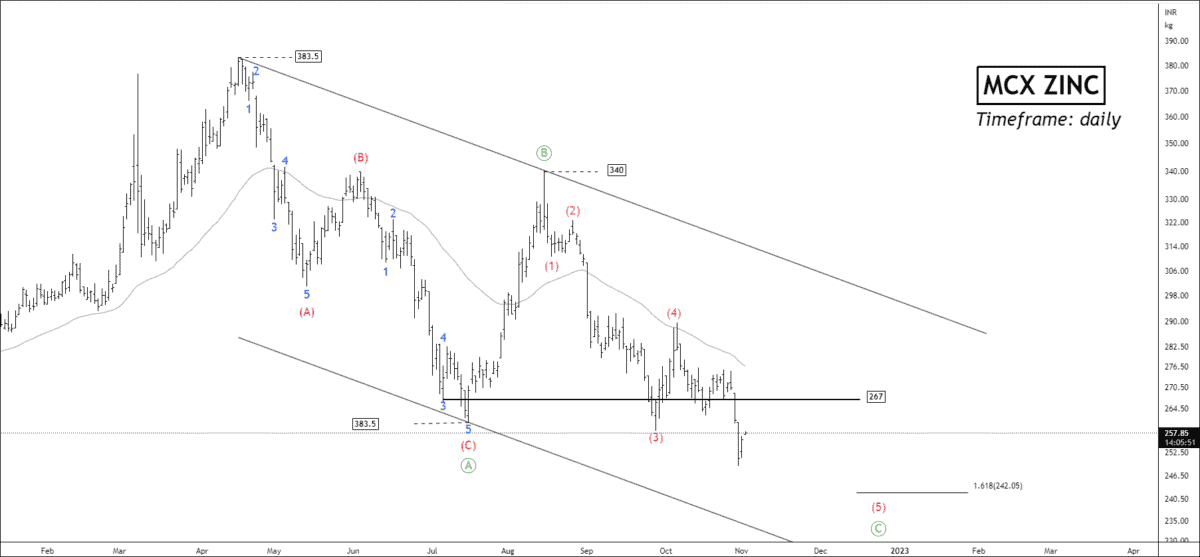
MCX zinc has been forming the corrective structure in the descending channel for more than 28 weeks. The ending point of impulse was 383.55.

At present, MCX zinc has accomplished the corrective wave ((B)) and started forming sub-waves of the impulsive wave (C). Price has completed 78.6% retracement, where wave A = C at 217. Zinc has accomplished wave (4) of wave ((C)). Wave ((C)) retraced 61.8% of wave ((A)). Zinc is trading below 50-day EMA, and RSI is above 30.

Zinc will try to test the price hurdle of 267, so traders can sell zinc nearby 267 for the following targets: 252.6 – 246 – 244.

Target measurement using the Fibonacci relationship:

  • Wave (5) of wave ((C)) can end near 161.8% reverse Fibonacci retracement.
  • Wave ((C)) can occur near 100% extension at 217, where wave A = C.
  • Wave ((C)) can cease to exit at the lower band of the parallel channel.

To become a subscriber, subscribe to our free newsletter services. Our service is free for all.

Continue reading

MCX Zinc & Lead Tips & Elliott Wave View

free commodity lead chart tips

MCX Lead Short-term Cycle Shows Big Trend

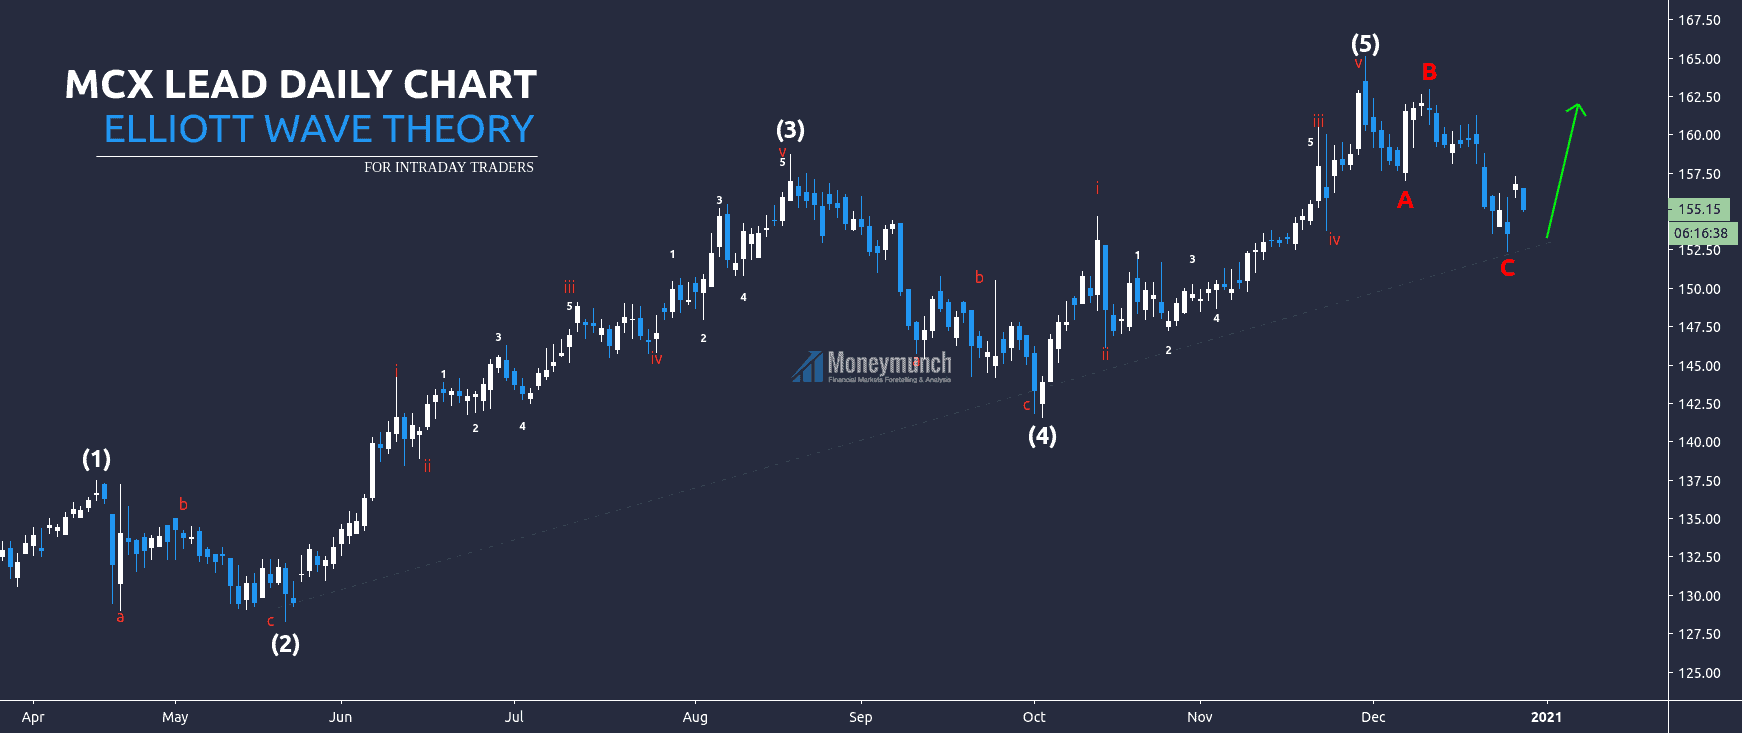
It’s the daily chart of the lead. Here, it has made the bullish Elliott pattern, and the ABC correction was completed on the 24th of December 2020. And right now, it started to move upside as per the rules of the bullish Elliott wave pattern. And it will move upwards till 158.6 – 162.

free mcx zinc tips chart

MCX Zinc Will Touch 240 by EWT

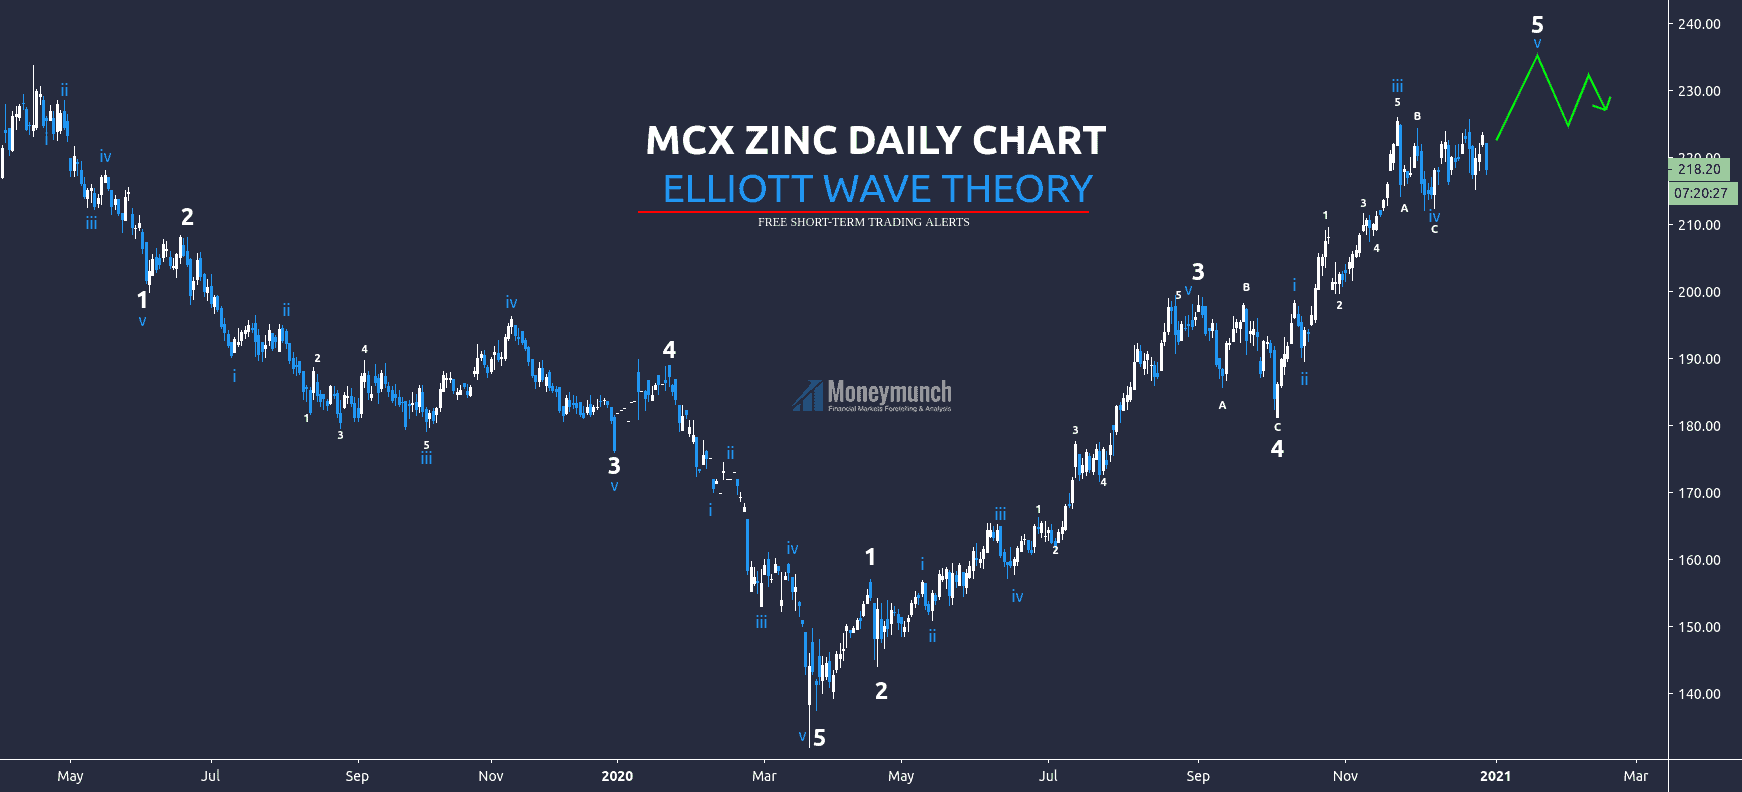
Here’s the daily chart of the MCX zinc. It has made two Elliott waves. The first one is bearish, and the second one is bullish. The bearish was started from the 11th of April 2019 and ended on the 19th of March 2020. The bullish one started on the 19th of March 2020, and the fifth wave of this Elliott wave is remaining. In the Elliott wave theory, each wave has five sub-waves.

Short-term investors can see the following levels soon: 228 – 234 – 240.

To become a subscriber, subscribe to our free newsletter services. Our service is free for all.

Continue reading

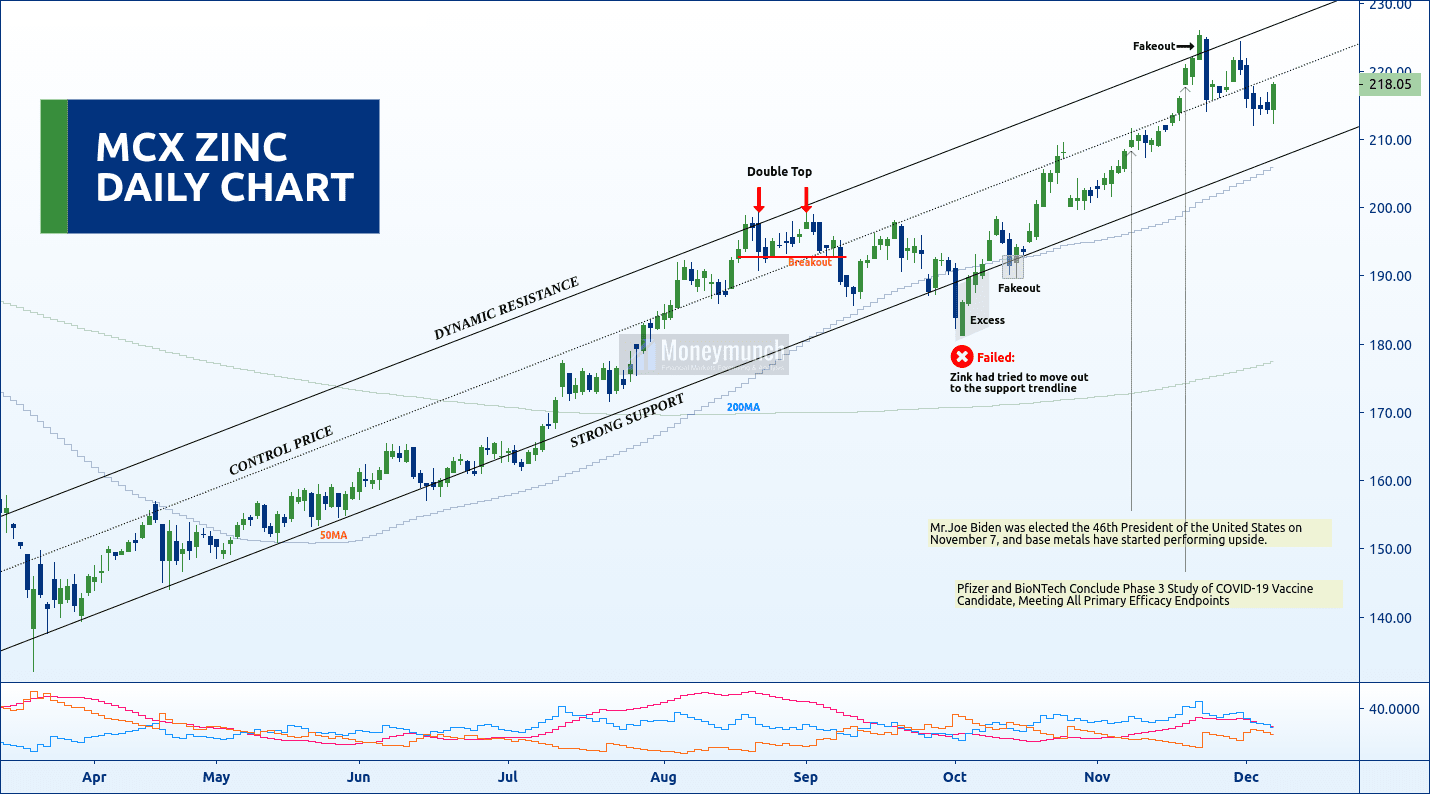
Will Zinc Return at a Strong Support Trendline?

free commodity zinc tips chart

Zinc took a bounce back from the lower levels yesterday, and it has failed to break last week’s low level of 212.1. Intraday traders can initiate long positions for levels of 219.6 – 220.

If it breaks last week’s low, we may see 210 – 208.6 levels. Overall, it’s positive. Long positions can be initiate with targets at 221.6 – 224 – 230 in extension.

The DMI & MA is bullish and calls for further advance.

To become a subscriber, subscribe to our free newsletter services. Our service is free for all.

Continue reading

MCX Gold & Zinc – Tips & Updates

free commodity mcx & cfd gold spot daily chart & signalsHave you bought Gold? If not, I have updated a free call on gold three days back.
Read Now: Gold Spot vs. MCX Gold – Weekly Reports & Tips

I had written in bold words, “according to this chart, gold is trying to climb upward after hitting the PC (Parallel Channel). And if it remains into the PC, we may see 51000 – 51500+ levels before the weekend”.

Gold has reached the first target (51000) and made a high of 51454 yesterday. Will it touch the next target or not?

Min. Profit Per Lot: Rs.30,000

free mcx zinc tips & chart

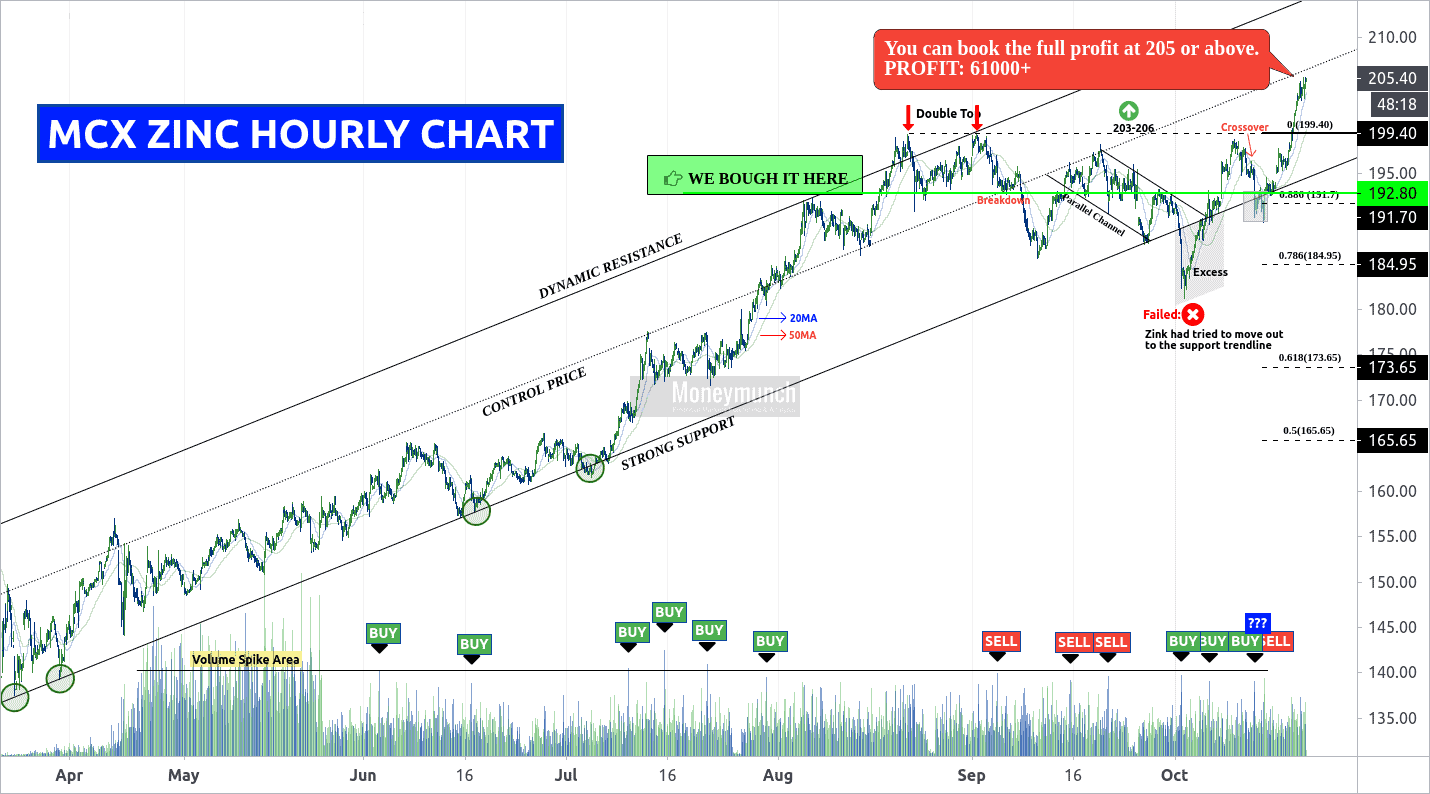
free commodity zinc chart callsI have updated a free Zinc trading call on 15 Oct 2020. First, visit here to read that article: MCX Zinc Ready For Another Rally Attempt

I had written clearly, “The day traders can keep buying above 0.886 value of retracement for the target of 194.6 – 196 and above. Breakout of 199.4 means boom! It can fly from there for 203 – 206 levels”.

Zinc has touched all day trading targets, and it has also touched the positional target of 203. Will it touch the last target 206 level before the weekend?

Min. Profit Per Lot: Rs.61,000
What else you want in a free subscription? To become a subscriber, subscribe to our free newsletter services. Our service is free for all.

Continue reading