Elliott Wave background:
In the 1930s, R.N Elliott identified the price of the stock trends and reversed a specific pattern. This pattern is repetitive in form and, the patterns have predictive value. He decided to use this pattern (Elliott wave theory) to predict the market. The Elliott wave is not primarily a trading system. It is a detailed description of how the market acts. The Elliott wave is part of technical analysis. Also, the Wave principle is the reassembled form of dow theory.
[“Elliott wave theory is governed by men’s social nature and since he has such a nature,
its expression generates forms. As the forms are repetitive, they have predictive value”]
-Elliott Wave Principle The key To Market Behavior]
Waves in the market?
We all know that price never moves in a straight line. It will neither fall in a straight line nor rise in a straight line.
Price will create highs and lows. And this high and low creates waves. Elliott wave theory is all about counting waves and, we are going to use the Elliott wave to trade the market.
Now, the concept of waves is acceptable to you.
Elliott wave theory is made of 5+3= 8 waves.
Let me show you the structure of both trends.
In the bull market ( UP Trend ) :
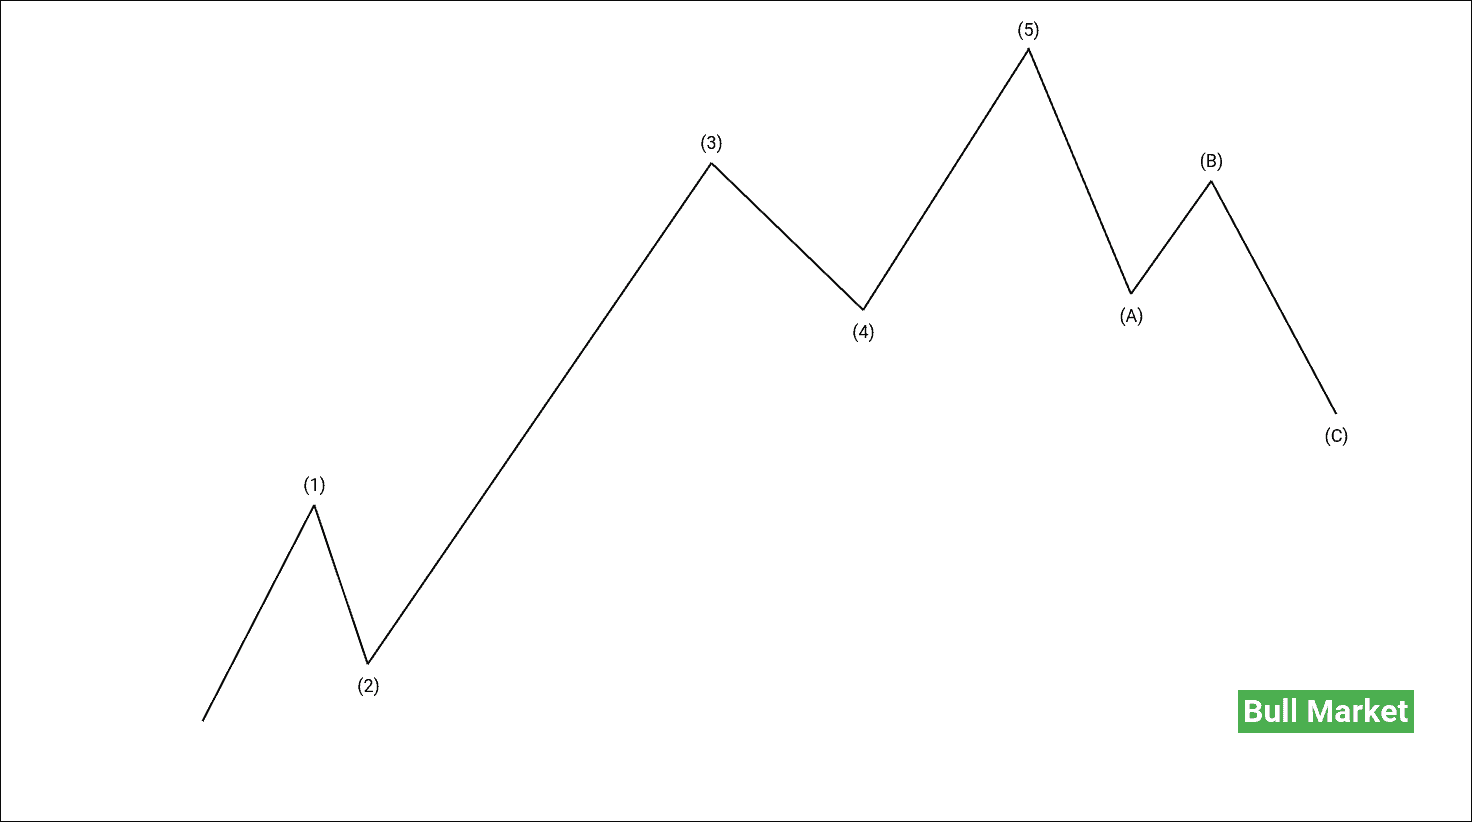
Figure 1.1: This is the Elliott wave structure in an uptrend. As we discussed, Elliott’s wave theory is made up of 5+3=8 waves. Five waves move with the trend and three waves move against the trend.
In the bear market (downtrend) :

Figure 1.2: This is an example of Elliott wave theory in a bear market. We can see that five waves move with the trend, and three waves move against the trend.
Please take a deep breath; I know you have lots of doubts in your mind. Let me solve some:
1. Elliott wave theory works in any time frame.
2. These 5+3=8 waves will give us a market edge by providing strong trends and trend reversals.
3. The accuracy of Elliott wave theory is 84% if you are using the wave principle correctly.
Practical Example of Elliott wave theory :
In the Bull market:
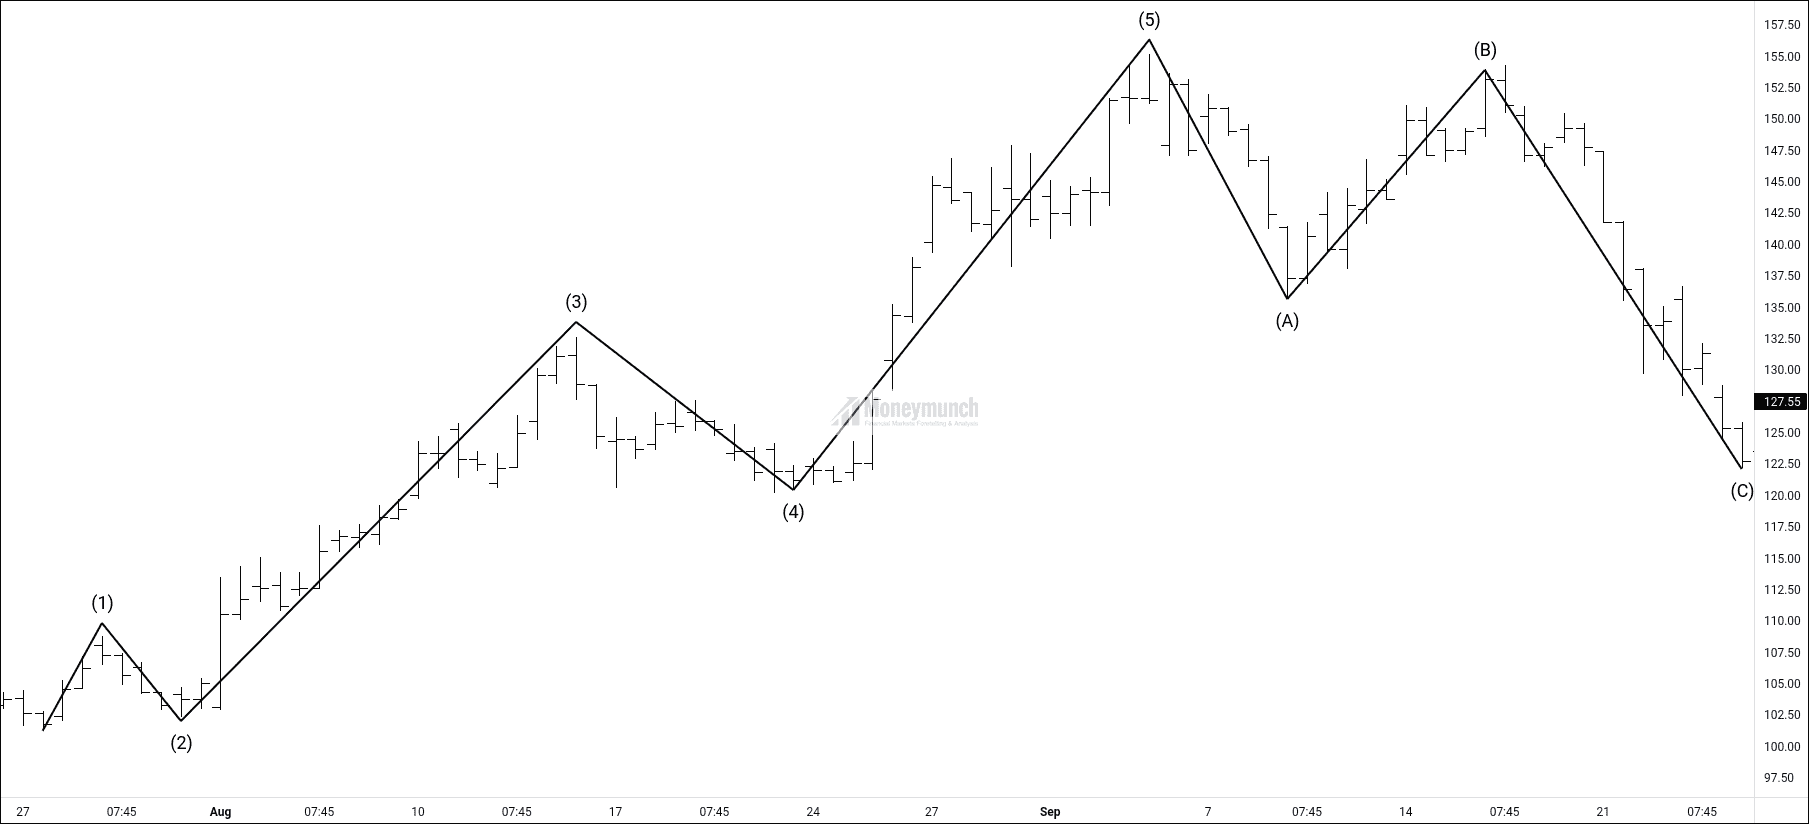
Figure 1.3: This is the TATA MOTORS 4-hour timeframe chart. I used bar charts because it is easier to recognize Elliott waves in bar patterns. It works for me to recognize them, but if you feel you can recognize patterns better in another chart type, go ahead with that!
In Bear Market:
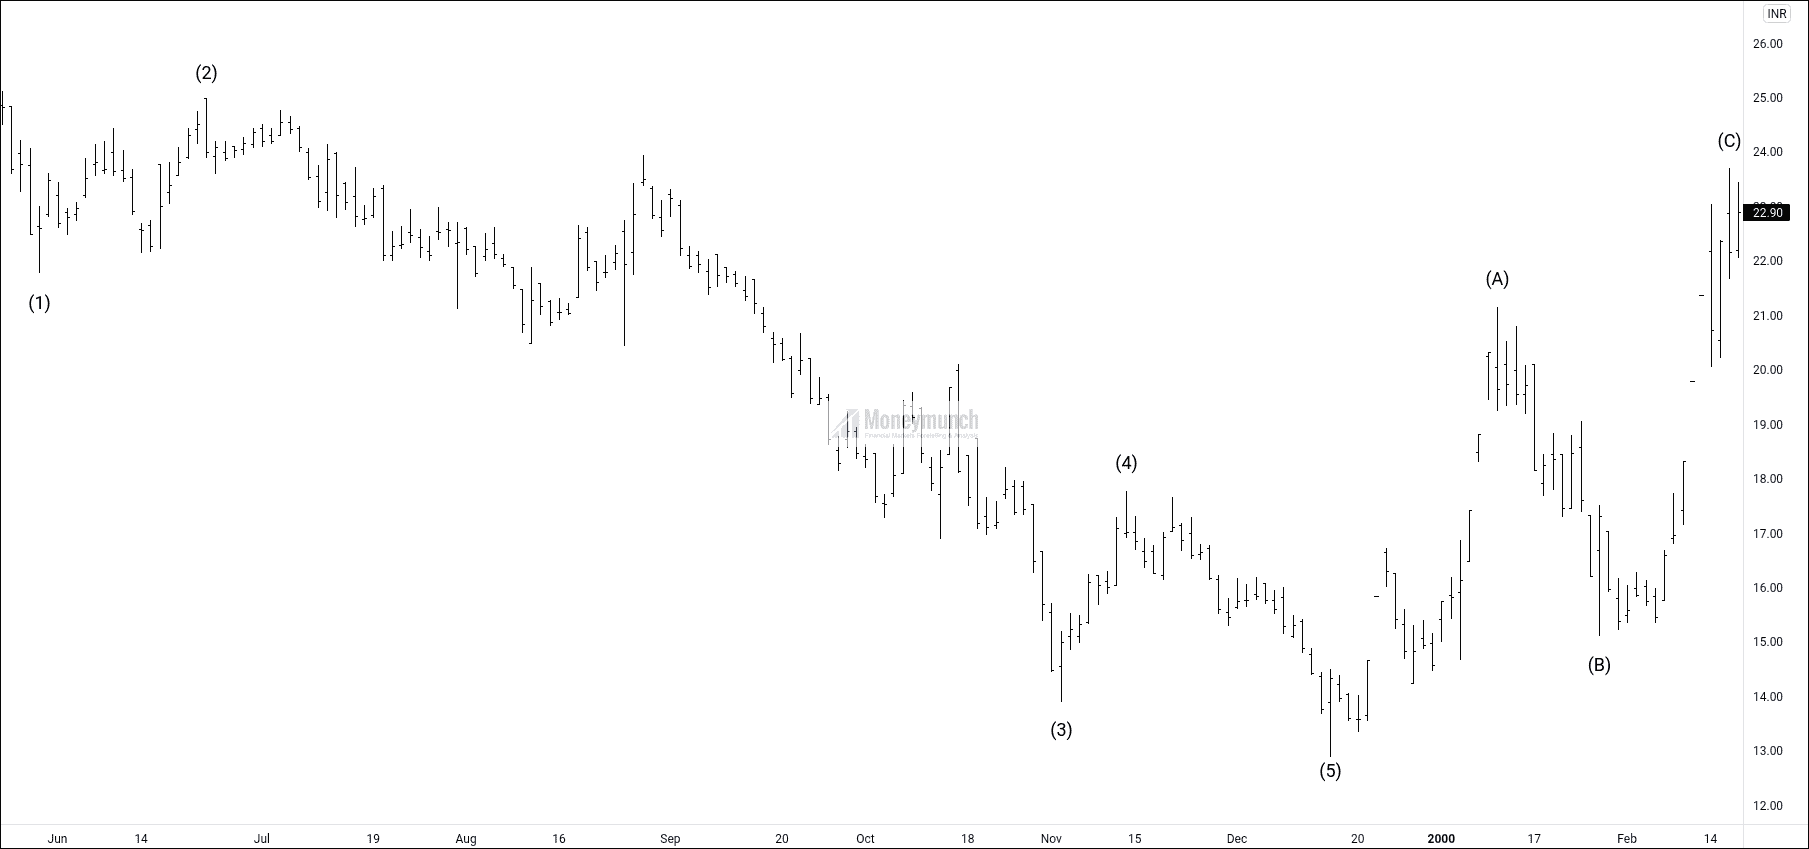
Figure 1.4: This is the ITC daily timeframe chart. It shows the beautiful Elliott wave structure in the bear market.
Elliott wave structure:
Now, we all know that Elliott is made up of a 5+3=8 wave structure. So, let’s start getting into it!
To understand the wave principle, we have divided the wave structure (5+3=8) into two phases, which are an impulse phase/structure and a corrective phase/structure.
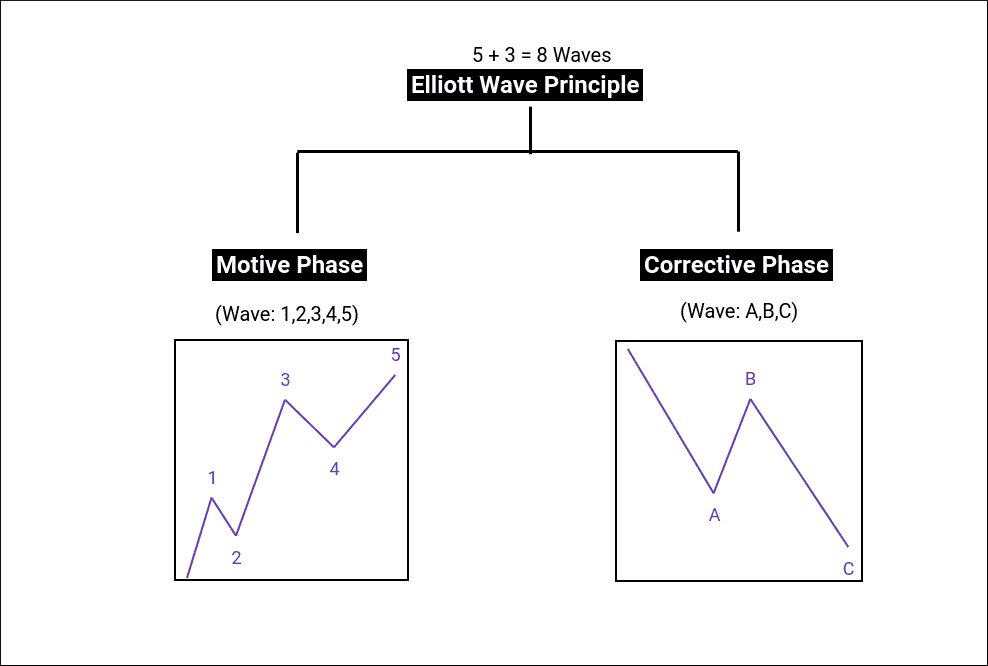
Figure 1.5: This picture illustrates the two phases of the Elliott wave principle. The impulse phase is made up of 5 waves, and the corrective phase is made up of 3 waves.
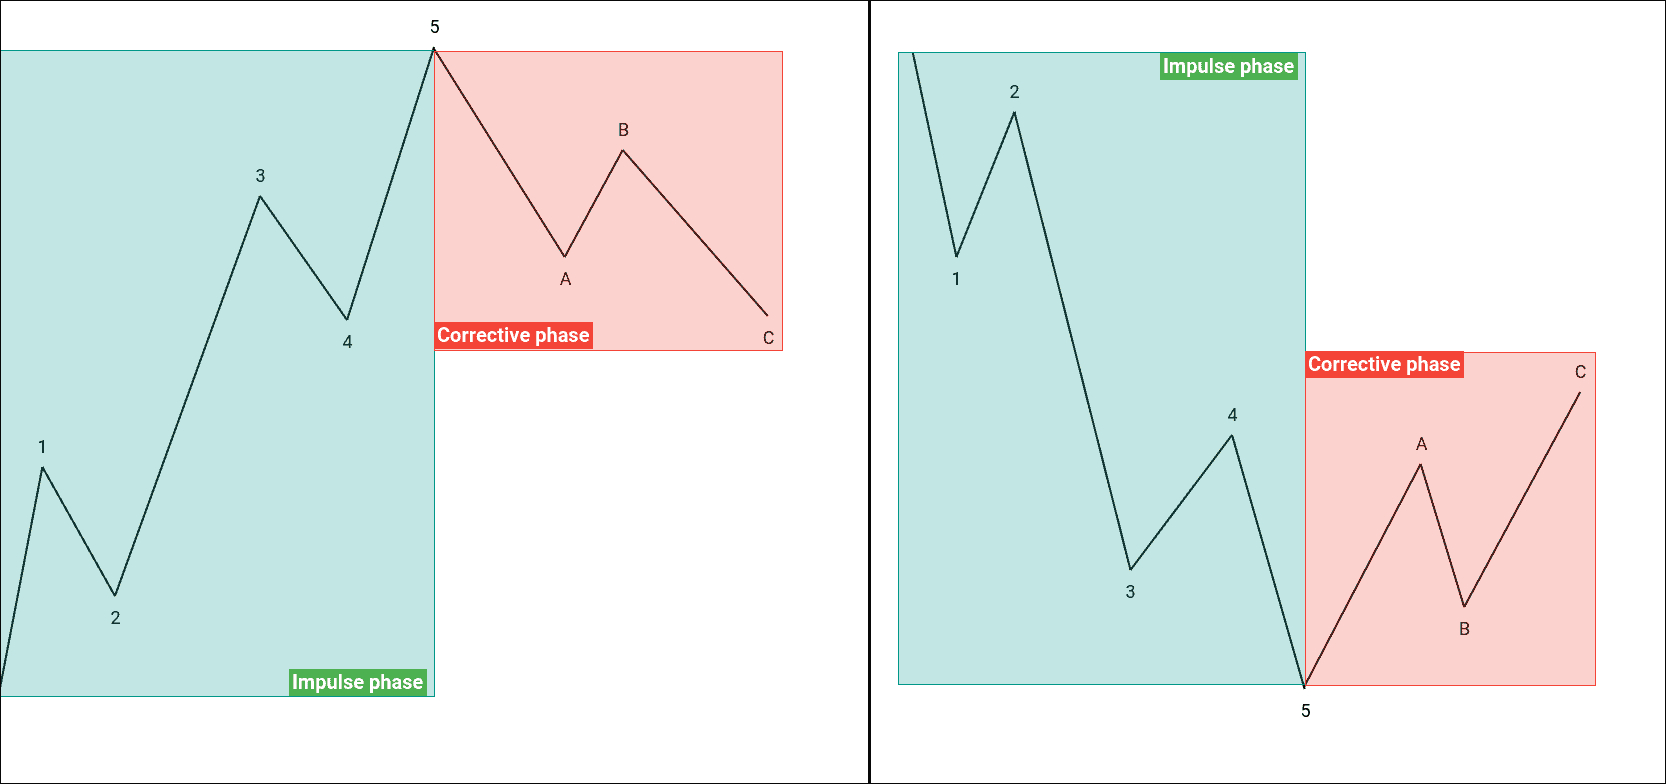
Figure 1.6: This picture divides the wave principle into two phases:
Impulse phase/structure (which includes five waves and moves with the trend. You can see that in a bull market, the impulse phase is going upward, while in a bear market, the impulse phase is going downward, indicating a directional move.)
Corrective phase/structure (which includes three waves and moves against the trend. In a bull market, the corrective phase moves downward, while in a bear market, the corrective phase moves upward, indicating a counter-trend move.)
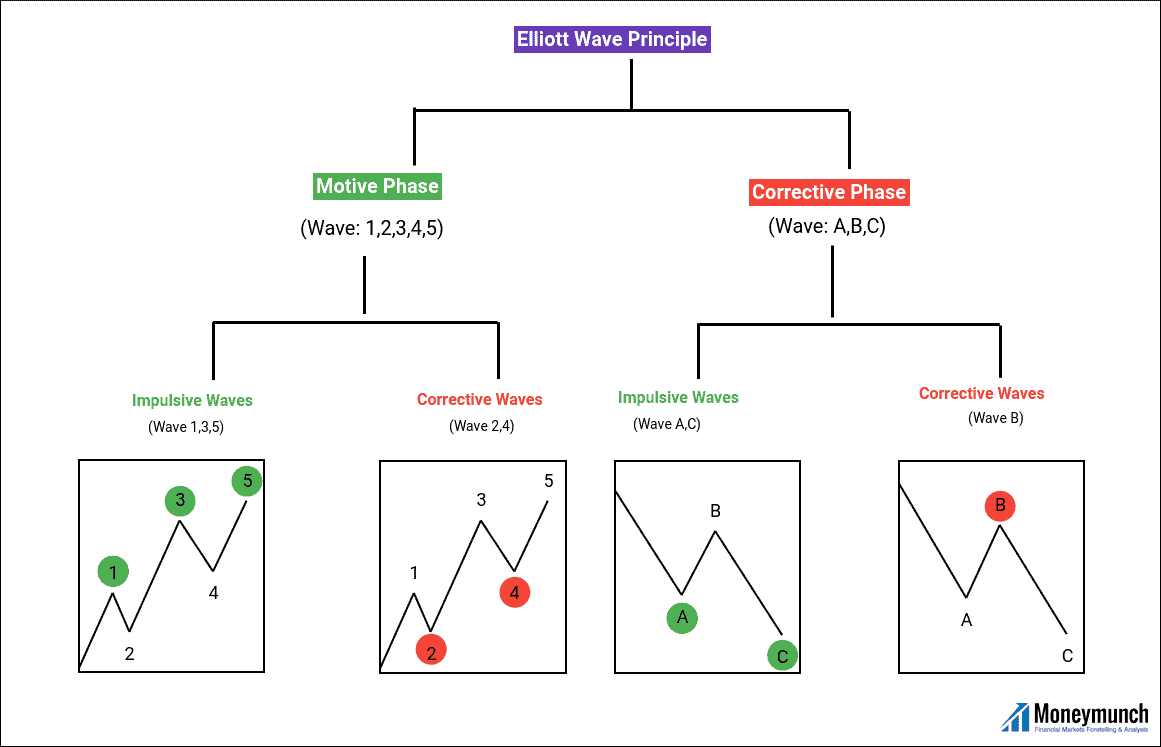
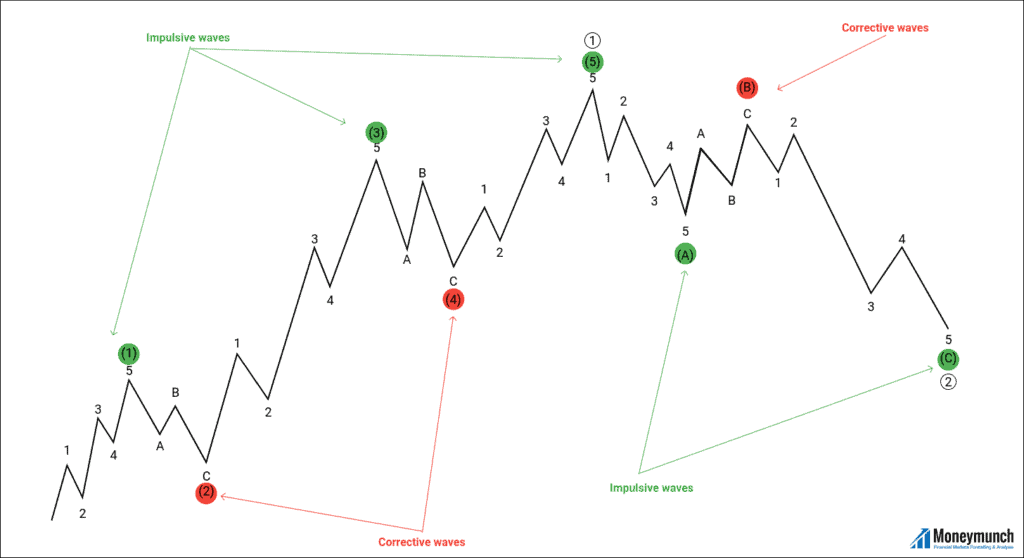
Figure 1.7: Elliott wave has two phases: the motive/impulse phase (directional move) and the corrective phase (counter-trend move). These two phases can be divided into two types of waves: impulsive waves and corrective waves.
Let’s zoom in on the impulse phase to understand its underlying structure and wave behavior.
Motive/Impulse Phase:
Important points about the impulse phase:
- The motive/impulse phase is a five-wave structure that includes waves 1, 2, 3, 4, and 5.
- The motive/impulse phase is a directional move (it moves with the trend).
- The ending point of the impulse phase is the starting point of the corrective phase.
- The motive/impulse structure is more powerful than the corrective structure.
- The impulse phase can be divided into two types of waves:
i) Impulse waves:Waves 1, 3, and 5 (move with the trend of the impulse phase)
ii) Corrective waves: Waves 2 and 4 (move against the trend of the impulse phase)
For a quick understanding, because we will cover these waves in depth:
- Impulsive waves are trend-following moves. We can find this type of wave structure in both phases. Impulsive waves create trends. Impulsive waves are 1, 3, 5, A, and C.
- Corrective waves are counter-trend moves. We can find this type of wave structure in both phases. Corrective waves provide a pause to continue the trend. Corrective waves are 2, 4, and B.
Motive/Impulse Phase in Bull Market:
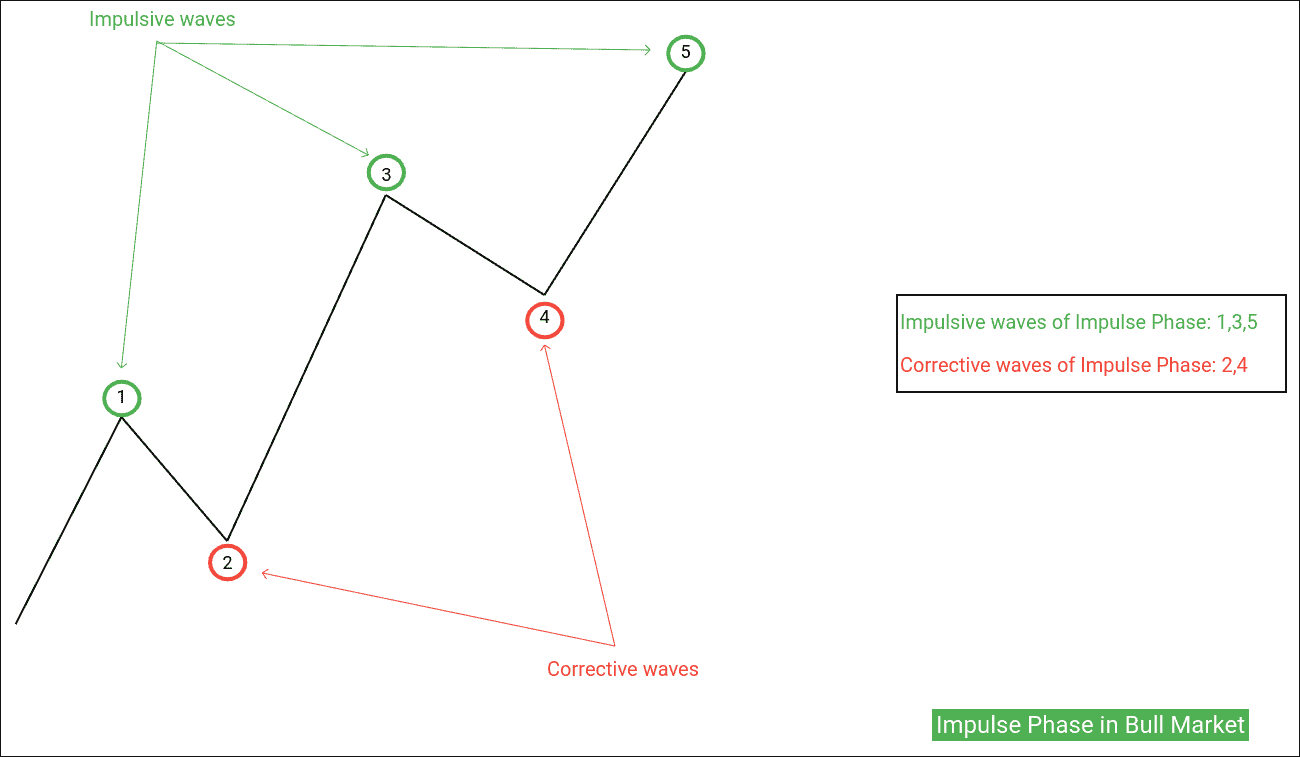
Figure 1.8(A): Waves 1, 3, and 5 are impulsive waves of the impulse phase because the trend of the impulse phase is upward, and these impulsive waves follow the trend with an upward move.
Waves 2 and 4 are corrective waves of the impulse phase because the trend of the impulse phase is upward, but these corrective waves move downward, which is against the trend.
Motive/Impulse Phase in Bear Market:
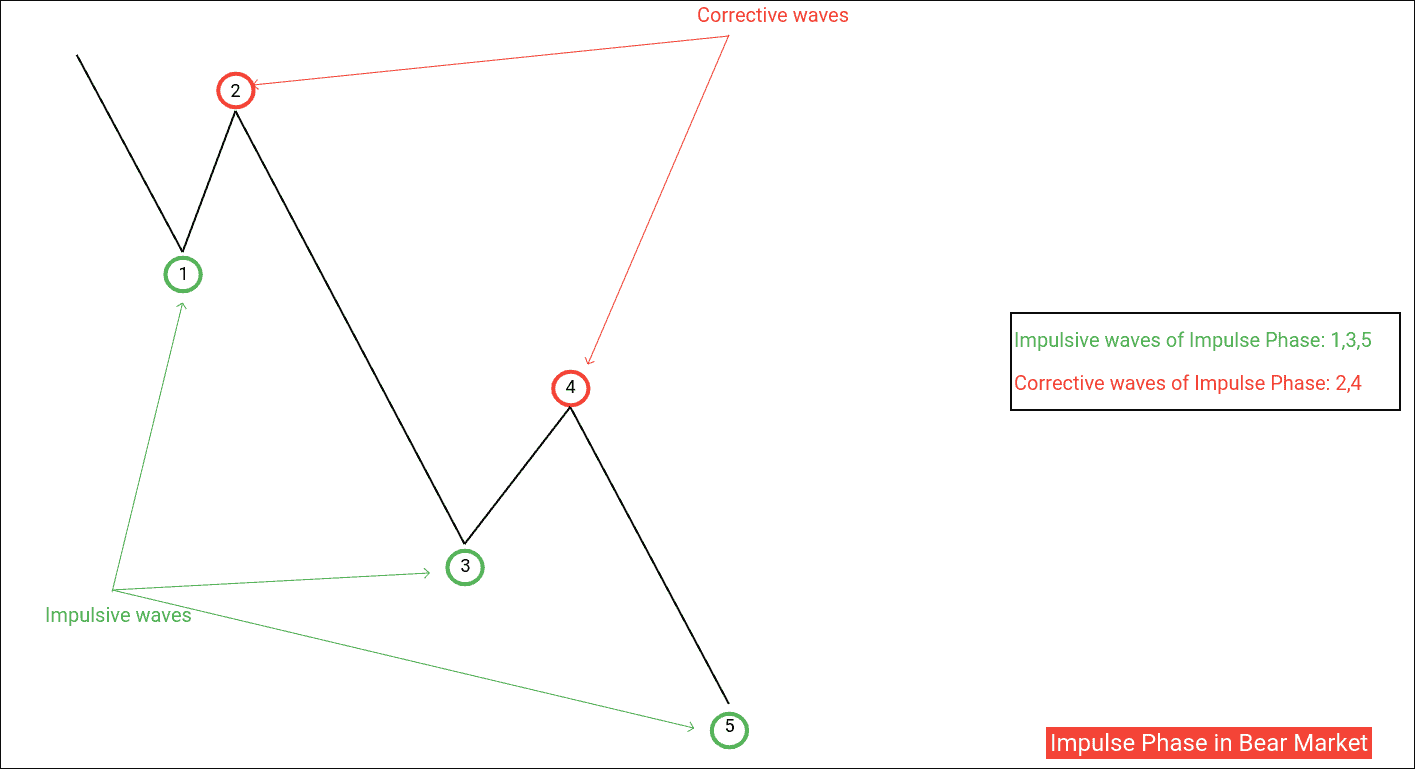
Figure 1.8(B): Waves 1, 3, and 5 are impulsive waves of the impulse phase because the trend of the motive/impulse phase is downward, and these impulsive waves follow the trend with a downward move.
Waves 2 and 4 are corrective waves of the impulse phase because the trend of the impulse phase is downward, but these corrective waves move upward, which is against the trend.
Corrective Phase/Structure:
Important points about the corrective phase:
- The corrective phase is a three-wave structure that includes waves A, B, and C.
- The corrective phase is a counter-trend move (it moves against the trend).
- The ending point of the corrective phase is the starting point of the impulse phase.
- The corrective phase can be divided into two types of waves:
- Impulse waves: Waves A and C (move with the trend of the corrective phase)
- Corrective waves: Wave B (moves against the trend of the corrective phase)
Corrective Phase in a bull market:
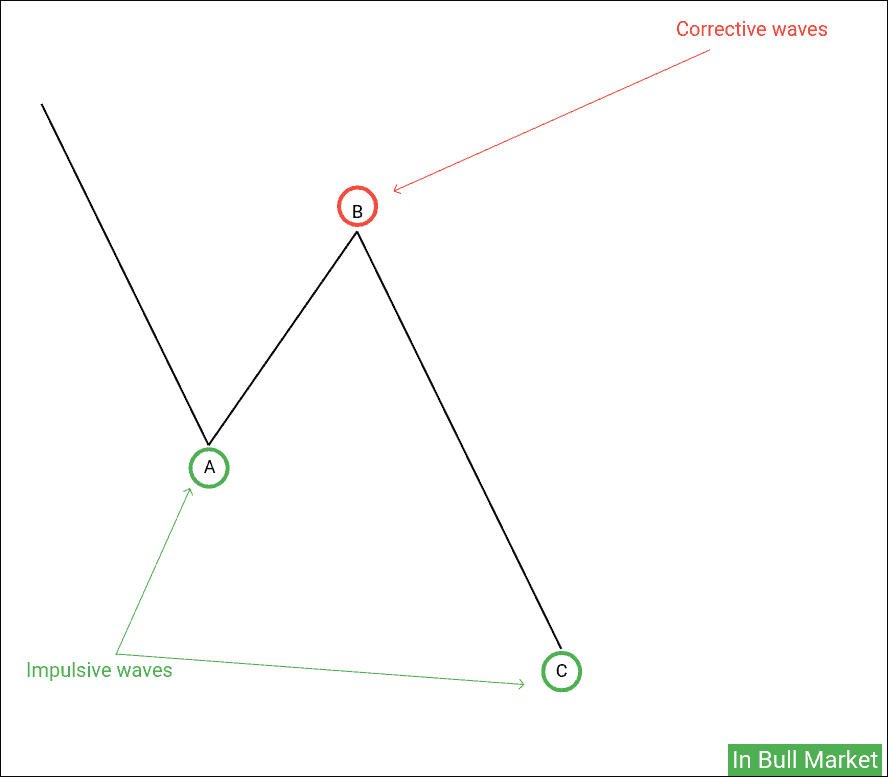
Figure 1.9(A): Waves A and C are impulsive waves of the correction phase because the trend of the correction phase is downward, and these impulsive waves follow the trend with a downward move.
Wave B is the corrective wave of the correction phase because the trend of the corrective phase is downward, but this corrective wave moves upward, which is against the trend.
Note: Here, the correction phase moves against the overall market trend. Therefore, while the market is in an uptrend, the correction phase is in a downtrend.
Correction phase in Bear Market :
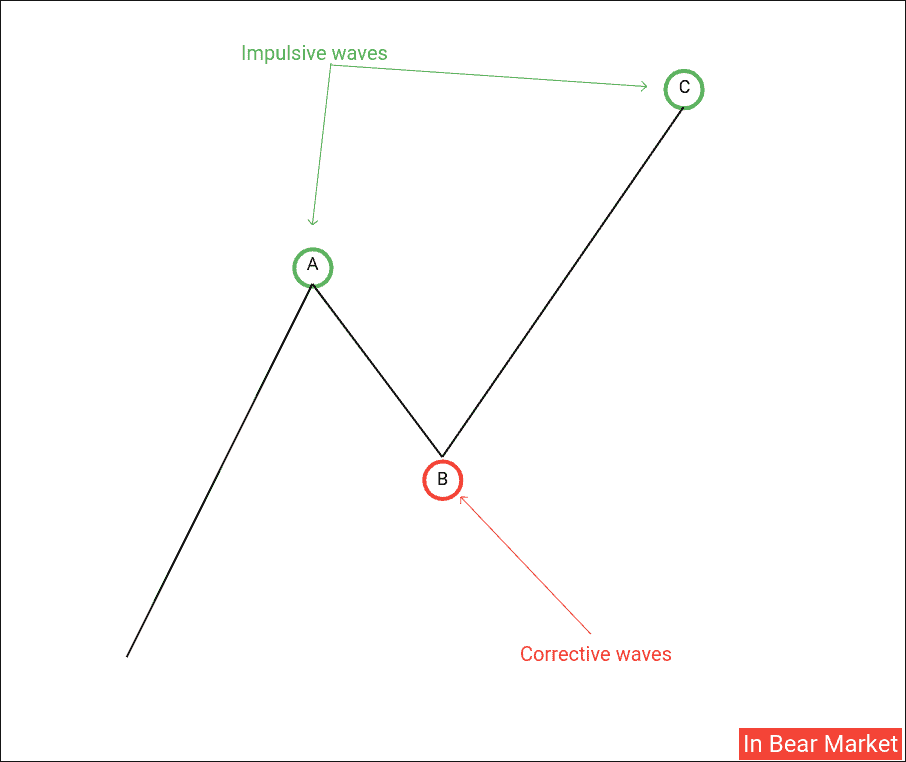
Figure 1.9(B): Waves A and C are impulsive waves of the correction phase because the trend of the correction phase is upward, and these impulsive waves follow the trend with an upward move.
Wave B is the corrective wave of the correction phase because the trend of the corrective phase is upward, but this corrective wave moves downward, which is against the trend.
Note: Here, the correction phase moves against the overall market trend. Therefore, while the market is in a downtrend, the correction phase is in an uptrend.
Impulsive Wave Structure:
- Impulsive waves are directional moves that are larger than corrective waves.
Impulsive waves create trends. - Impulsive waves are subdivided into five waves. (This means waves 1, 3, 5, A, and C, which move with the trend, will have five sub-waves.)
- Impulsive waves are easy to recognize. (Impulsive waves can also be called motive waves.)
- Riding an impulsive wave can provide a high-probability trade setup with high rewards.
- We will cover impulsive wave formations in the next part, including diagonals, extensions, impulses, and truncations.
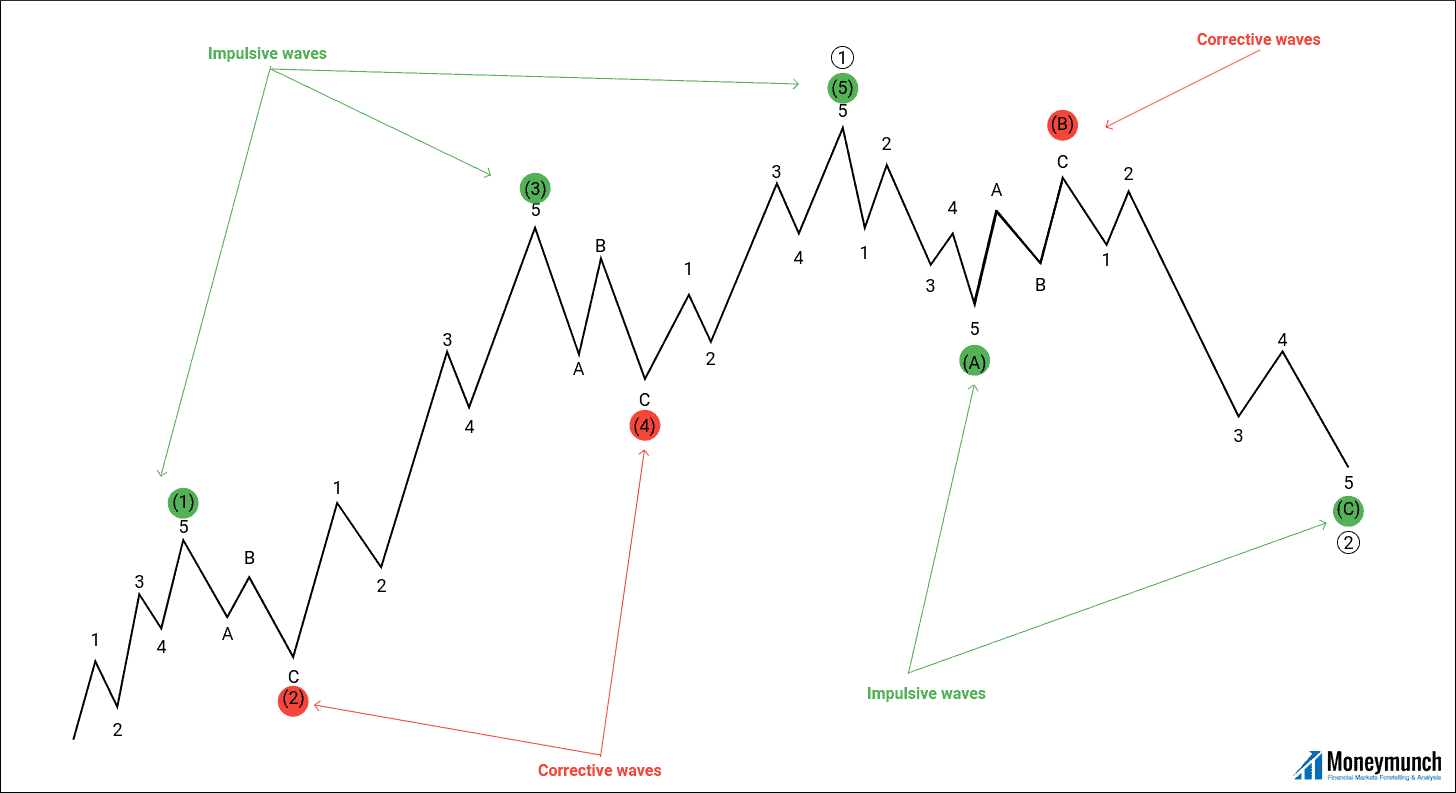
Figure 1.10: As discussed, impulsive waves are subdivided into five waves. In the chart, you can see that waves 1, 3, 5, A, and C each have five sub-waves.
Stay tuned for the next part, where we’ll dive deeper into impulsive wave formations, including diagonals, extensions, impulses, and truncations. To be continued…
Get free important share market ideas on stocks & nifty tips chart setups, analysis for the upcoming session, and more by joining the below link: Stock Tips
Have you any questions/feedback about this article? Please leave your queries in the comment box for answers.