This is the 22th Day course in a series of 60-Days called “Technical Analysis Training”
You will get daily one series of this Training after 8 o’clock night (Dinner Finished)
Follow MoneyMunch.com Technical Analysis Directory and Learn Basic Education of Technical Analysis on the Indian Stock Market (NSE/BSE)

Momentum Oscillator
Effect of Momentum Oscillator
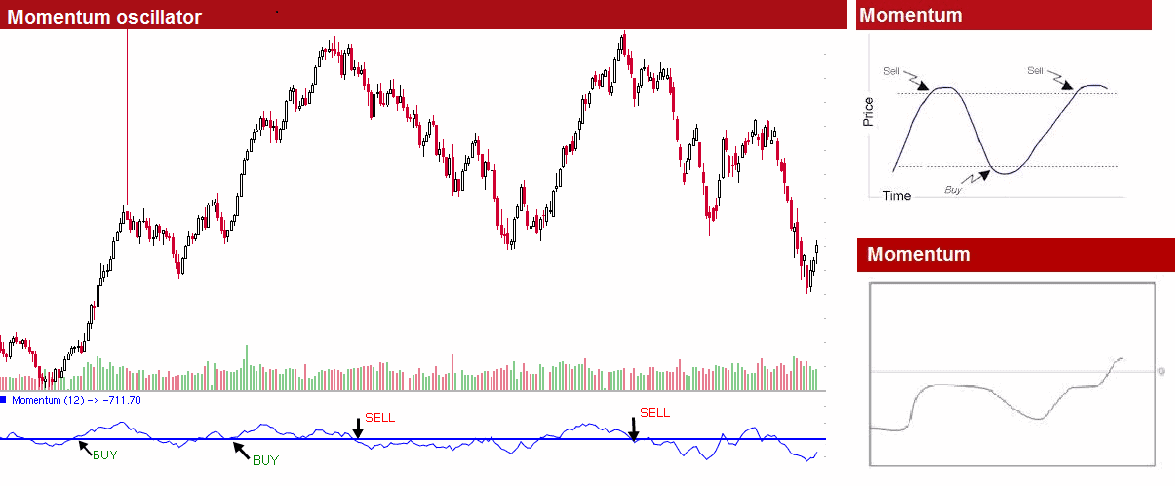
Momentum measures the amount that a financial instrument’s price has changed over a given timeframe. Momentum is significant because it signals the strength of price trends.The Momentum rises above 0 , a bullish noticeable is cause. When the Momentum falls below 0, the Technical Analysis is a bearish signal.
Narration
Momentum measures the amount that a financial equipment price has changed over a given time frame Momentum is important because it indicate the strength of price trends. A healthy price trend tends to show strong momentum, while decline trends generally have decreasing momentum indicating a trend reversal or correction. Momentum can also indicate short-term market excess referred to as overbought and oversold levels. A bullish signal is generated when the Momentum rises above 0 and a bearish signal is generated when the Momentum falls below 0.
Momentum is calculated as a ratio of today’s price compared to the price n periods ago. The formula is [Close/(Close n time-periods ago) times 100].
Trading Factor:
Momentum can be used as a trend-following oscillator similar to the MACD. A bullish indicate is achieved when the indicator bottoms and turns up.
A bearish signal is achieved when the indicator peaks and turns down.
If the Momentum indicator influence extremely higher low values (relative to its historical values),
a continuity of the current trend may be called for. For example, if the Momentum indicator reaches extremely high values and then turns down, one could predict prices will probably go still higher.In either case, only trade after prices confirm the signal generated by the indicator (e.g., if prices peak and turn down, wait for prices to begin to fall before selling).
The Momentum indicator can also be used as a leading indicator.This method assumes that market tops are typically identified by a rapid price increase (when everyone expects prices to go higher)and that market bottoms typically end with rapid price declines (when everyone wants to get out). As a market peaks, the Momentum indicator will climb sharply and then fall off–diverging from the continued upward or sideways movement of the price.
Similarly, at a market bottom, the Momentum indicator will drop sharply and then begin to climb well ahead of prices.Both of these situations result in divergences between the indicator and prices.
Message for you(Trader/Investor): Google has the answers to most all of your questions, after exploring Google if you still have thoughts or questions my Email is open 24/7. Each week you will receive your Course Materials. You can print it and highlight for your Technical Analysis Training.
Wishing you a wonderful learning experience and the continued desire to grow your knowledge. Education is an essential part of living wisely and the Experiences of life, I hope you make it fun.
Learning how to profit in the Stock Market requires time and unfortunately mistakes which are called losses. Why not be profitable while you are learning?
TABLE OF CONTENTS
Candlestick and Chart Patterns (15 Days)
7 Most Important Candlestick Chart Patterns
- Gap Down Chart Pattern
- Gap Up Chart Pattern
- Gravestone Short-term Chart Pattern
- Hammer Candle Stick Chart Pattern
- Hanging Man Short-term Stock Chart Pattern
- Inverted Hammer Stock Chart Pattern
- Shooting Star Candle Stick Pattern
Top 2 Bearish Chart Patterns
Top 6 Bullish Chart Patterns
- Engulfing Line (Bullish) Chart Pattern
- Exhaustion Bar Chart Pattern (Bullish)
- Inside Bar Chart Pattern
- Island Bottom Chart Pattern
- Key Reversal Bar (Bullish) Chart Pattern
- Two Bar Reversal (Bullish) Chart Pattern
Indicators & Oscillators (12 Days)
Bullish or Bearish Indicators
Bullish or Bearish Oscillators
- Bollinger Bands Oscillator
- Commodity Channel Index (CCI)
- Fast Stochastic Oscillator
- Know Sure Thing (KST) Oscillator
- Momentum Oscillator
- Moving Average Convergence/Divergence (MACD) Oscillator
- Relative Strength Index (RSI)
- Slow Stochastic Oscillator
- Williams %R Oscillator
Classic Chart Patterns (29 Days)
Bearish Classic Chart Patterns
- Continuation Diamond (Bearish) Chart Pattern
- Continuation Wedge (Bearish)
- Descending Continuation Triangle Chart Pattern
- Diamond Top Chart Pattern
- Double Top Chart Pattern
- Downside Break Chart Pattern – Rectangle
- Flag Bearish Chart Pattern
- Head and Shoulders Top Chart Pattern
- Megaphone Top Chart Pattern
- Pennant Bearish Chart Pattern
- Rounded Top Chart Pattern
- Symmetrical Continuation Triangle (Bearish)
- Top Triangle/Wedge Chart Pattern
- Triple Top Chart Pattern
Bullish Classic Chart Patterns
- Ascending Continuation Triangle Chart Pattern
- Bottom Triangle Or Wedge Chart Pattern
- Continuation Diamond (Bullish) Chart Pattern
- Continuation Wedge Chart Pattern (Bullish)
- Cup with Handle Bullish Chart Pattern
- Diamond Bottom Chart Pattern
- Double Bottom Chart Pattern
- Flag Bullish Chart Pattern
- Head and Shoulders Bottom Chart Pattern
- Megaphone Bottom Chart Pattern
- Pennant Bullish Chart Pattern
- Round Bottom Chart Pattern
- Symmetrical Continuation Triangle Bullish
- Triple Bottom Chart Pattern
- Upside Breakout Chart Pattern – Rectangle
Best Trading Theories (4 Days)
- Basics of Dow theory trading strategy forecasts
- Motive (Impulse) Waves
- Corrective Waves
- Wyckoff Chart Reading
Kind attention: this course is helpful for beginner and intermediate traders. It’s free for everyone. Advanced modules, trading strategies, and data (in-depth) are available for Moneymunch’s premium subscribers.
Get free important share market ideas on stocks & nifty tips chart setups, analysis for the upcoming session, and more by joining the below link: Stock Tips
Have you any questions/feedback about this article? Please leave your queries in the comment box for answers.