ATR Indicator – Market Volatility Made Simple

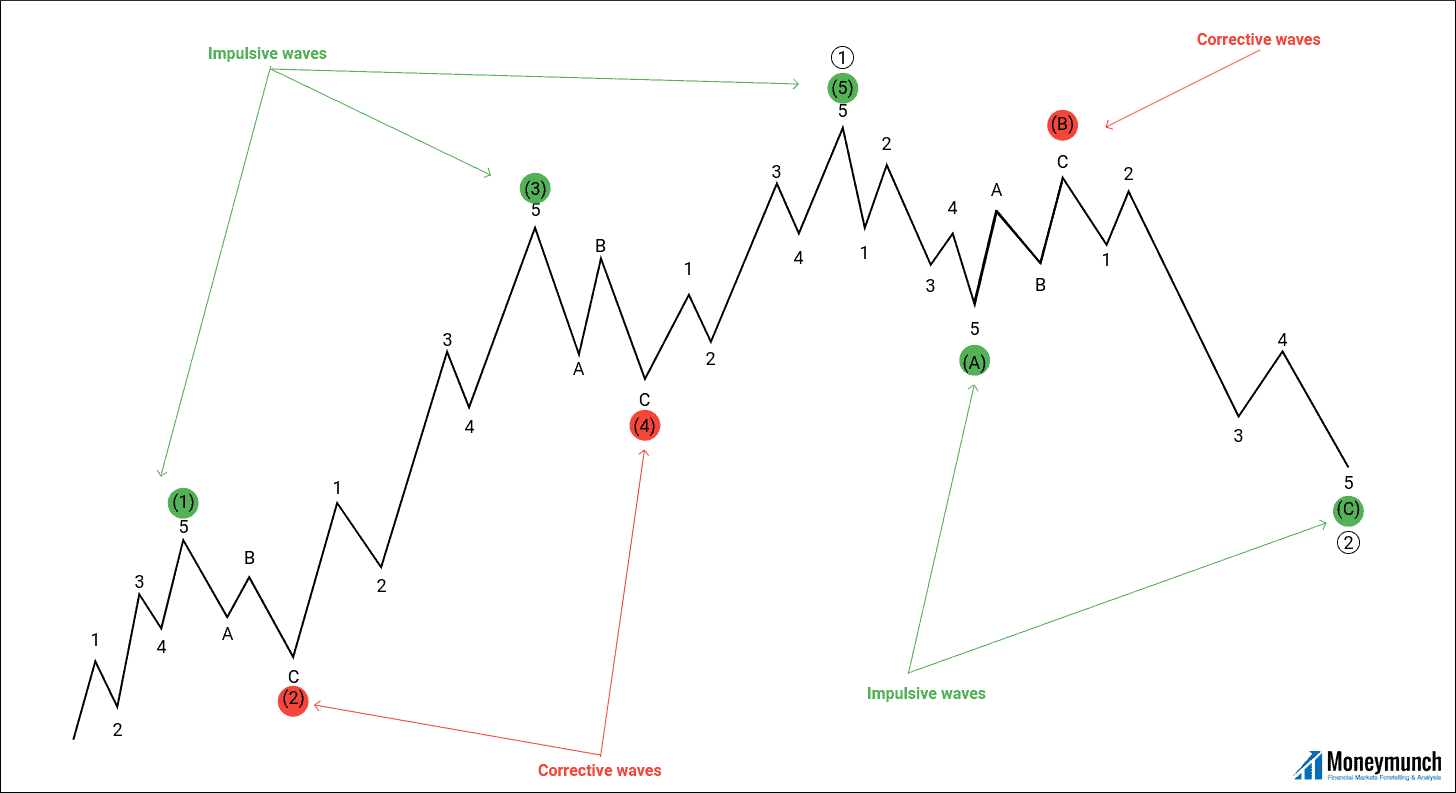
Part A – Introduction to the Wave Principle
Understanding the Impact of Futures and Options Expiry on Trader Behavior: Analyzing Volatility in NIFTY 50
Introduction: The expiry of futures and options (F&O) contracts is a crucial time in the financial markets, characterized by sharp price movements and increased trading volumes. This analysis dives into how different types of traders behave during this period, focusing on the Nifty 50 index, one of India’s leading stock market indices. The dataset consists of 16,323 hourly records with the following columns. Another words, the datasets was used of past 10 years.
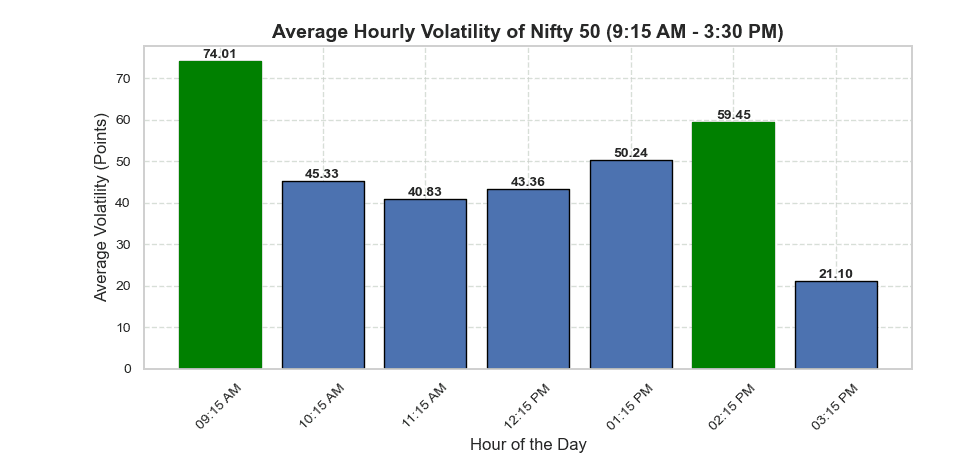
Hourly Volatility Insights:
- Morning Rush: The market opening at 9:15 AM experiences the highest volatility. This is the time when traders are reacting to overnight news, global market movements, and other factors that can significantly impact stock prices.
- Mid-Day Calm: Volatility tends to decrease mid-day as the initial rush settles down.
- Afternoon Fluctuations: Around 2:15 PM, volatility spikes again, likely due to traders adjusting their positions as the market nears its close.
- End-of-Day Stability: By 3:15 PM, volatility is at its lowest as the market prepares to close.
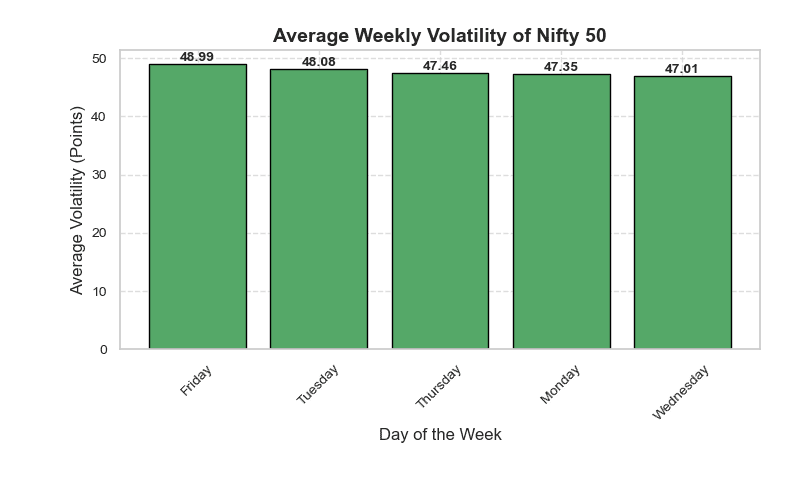
Weekly Volatility Trends:
- Friday Frenzy: Fridays exhibit the highest average volatility as traders close positions before the weekend, leading to increased trading activity.
- Consistent Volatility: Other weekdays show similar volatility levels, indicating a stable trading environment.
Trader Classification and Expiry Behavior
The following table summarizes the typical behavior of various trader types during F&O expiry:
.expiry-table th, .expiry-table td {
padding: 12px 15px;
text-align: left;
border-bottom: 1px solid #ddd;
}
.expiry-table th {
background-color: #f0f0f0;
font-weight: bold;
}
/* Star rating styling */
.star-rating {
color: #f39c12; /* Gold color for stars */
}
/* Responsive styling (optional) */
@media (max-width: 768px) {
.expiry-table {
overflow-x: auto;
display: block;
}
}
| Trader Sub-Classification | Volatility Importance | Liquidity Importance | Trades During Expiry |
|---|---|---|---|
| High-Frequency Trader | ★★★★★ | ★★★★★ | Yes |
| Scalper | ★★★★★ | ★★★★★ | Yes |
| Proprietary Trader | ★★★★☆ | ★★★★☆ | Yes |
| Algorithmic Trader | ★★★★☆ | ★★★★☆ | Yes |
| Day Trader | ★★★★☆ | ★★★★☆ | Yes |
| Speculator | ★★★★☆ | ★★★☆☆ | Yes |
| Institutional Trader | ★★★☆☆ | ★★★★☆ | Sometimes |
| Arbitrageur | ★★★☆☆ | ★★★★☆ | Yes |
| Swing Trader | ★★★☆☆ | ★★★☆☆ | Sometimes |
| Hedger | ★★☆☆☆ | ★★★☆☆ | Sometimes |
| Retail Trader | ★★☆☆☆ | ★★☆☆☆ | No |
| Position Trader | ★★☆☆☆ | ★★☆☆☆ | No |
Key Observations
- High-Frequency Traders, Scalpers, and Day Traders: These traders thrive on volatility and liquidity, making expiry an attractive period for them to capitalize on rapid price movements and increased trading volumes.
- Algorithmic and Proprietary Traders: These traders often employ sophisticated strategies that can benefit from the unique market conditions during expiry.
- Speculators: Driven by the potential for high profits, speculators are willing to take on the increased risks associated with expiry.
- Institutional Traders, Arbitrageurs, Swing Traders, and Hedgers: These traders may participate in expiry trading depending on their specific strategies and market conditions. They may use expiry to adjust their portfolios, exploit price discrepancies, or manage risk.
- Retail Traders and Position Traders: These traders typically avoid expiry due to the heightened risks and complexities involved. They prefer more stable market conditions and focus on longer-term trends.
Pitfalls: Common Trading Mistakes and How to Avoid Them
 Unlock This Article
Only subscribers can read the full article. Please login to read the entire article.