“Technical Analysis Training”
This is the 14th Day course in a series of 60-Days called “Technical Analysis Training”
You will get daily one series of this Training after 8 o’clock night (Dinner Finished)
Follow MoneyMunch.com Technical Analysis Directory and Learn Basic Education of Technical Analysis on the Indian Stock Market (NSE/BSE)
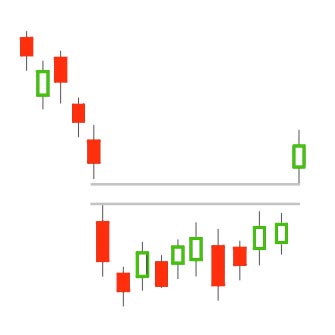
Island Bottom Chart Pattern
Effect of Inside Bar
A strong Island Bottom is a bullish alert indicating a possibility reversal of the current downtrend to a brand new uptrend. The pattern is definitely an sign of a fiscal instrument’s SHORT-TERM view.
Story
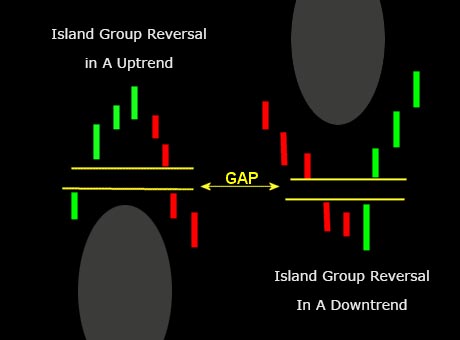
The Island Bottom occurs whenever the price “gaps” below a particular price number for an amount of days and additionally then is affirmed once the price “gaps” above the initial number.
Statistics–Bottoms
Percent of successful formations – 85% Average rise of successful formations – 34% Likely decline – 20% Failure rate – 17% Average time to throwback completion – 9 days.
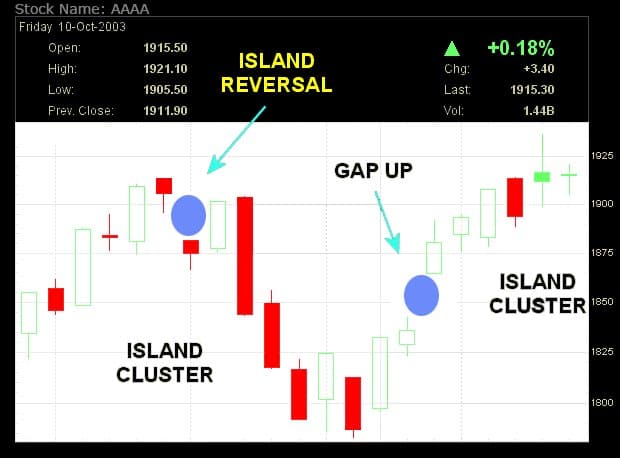
Island Reversal Chart Pattern Example
Message for you(Trader/Investor): Google has the answers to most all of your questions, after exploring Google if you still have thoughts or questions my Email is open 24/7. Each week you will receive your Course Materials. You can print it and highlight for your Technical Analysis Training.
Wishing you a wonderful learning experience and the continued desire to grow your knowledge. Education is an essential part of living wisely and the Experiences of life, I hope you make it fun.
Learning how to profit in the Stock Market requires time and unfortunately mistakes which are called losses. Why not be profitable while you are learning?
TABLE OF CONTENTS
Candlestick and Chart Patterns (15 Days)
7 Most Important Candlestick Chart Patterns
- Gap Down Chart Pattern
- Gap Up Chart Pattern
- Gravestone Short-term Chart Pattern
- Hammer Candle Stick Chart Pattern
- Hanging Man Short-term Stock Chart Pattern
- Inverted Hammer Stock Chart Pattern
- Shooting Star Candle Stick Pattern
Top 2 Bearish Chart Patterns
Top 6 Bullish Chart Patterns
- Engulfing Line (Bullish) Chart Pattern
- Exhaustion Bar Chart Pattern (Bullish)
- Inside Bar Chart Pattern
- Island Bottom Chart Pattern
- Key Reversal Bar (Bullish) Chart Pattern
- Two Bar Reversal (Bullish) Chart Pattern
Indicators & Oscillators (12 Days)
Bullish or Bearish Indicators
Bullish or Bearish Oscillators
- Bollinger Bands Oscillator
- Commodity Channel Index (CCI)
- Fast Stochastic Oscillator
- Know Sure Thing (KST) Oscillator
- Momentum Oscillator
- Moving Average Convergence/Divergence (MACD) Oscillator
- Relative Strength Index (RSI)
- Slow Stochastic Oscillator
- Williams %R Oscillator
Classic Chart Patterns (29 Days)
Bearish Classic Chart Patterns
- Continuation Diamond (Bearish) Chart Pattern
- Continuation Wedge (Bearish)
- Descending Continuation Triangle Chart Pattern
- Diamond Top Chart Pattern
- Double Top Chart Pattern
- Downside Break Chart Pattern – Rectangle
- Flag Bearish Chart Pattern
- Head and Shoulders Top Chart Pattern
- Megaphone Top Chart Pattern
- Pennant Bearish Chart Pattern
- Rounded Top Chart Pattern
- Symmetrical Continuation Triangle (Bearish)
- Top Triangle/Wedge Chart Pattern
- Triple Top Chart Pattern
Bullish Classic Chart Patterns
- Ascending Continuation Triangle Chart Pattern
- Bottom Triangle Or Wedge Chart Pattern
- Continuation Diamond (Bullish) Chart Pattern
- Continuation Wedge Chart Pattern (Bullish)
- Cup with Handle Bullish Chart Pattern
- Diamond Bottom Chart Pattern
- Double Bottom Chart Pattern
- Flag Bullish Chart Pattern
- Head and Shoulders Bottom Chart Pattern
- Megaphone Bottom Chart Pattern
- Pennant Bullish Chart Pattern
- Round Bottom Chart Pattern
- Symmetrical Continuation Triangle Bullish
- Triple Bottom Chart Pattern
- Upside Breakout Chart Pattern – Rectangle
Best Trading Theories (4 Days)
- Basics of Dow theory trading strategy forecasts
- Motive (Impulse) Waves
- Corrective Waves
- Wyckoff Chart Reading
Kind attention: this course is helpful for beginner and intermediate traders. It’s free for everyone. Advanced modules, trading strategies, and data (in-depth) are available for Moneymunch’s premium subscribers.
Get free important share market ideas on stocks & nifty tips chart setups, analysis for the upcoming session, and more by joining the below link: Stock Tips
Have you any questions/feedback about this article? Please leave your queries in the comment box for answers.
I request you to send me the course pdf material in my email. I am very much interested. Please send the same
SIR,
PLEASE SEND ME THE FULL COURSE MATERIAL IN PDF TEXT SO THAT I CAN STUDY WHENEVER I NEED.
I want to learn
dear sir
plase send me above tecnical analysis course material i am intrest plase send me
Sir- technical analysis course ki Hindi language me jankari chahta Hu. Aap ke margdarshan Ki awasyakta hai…..कृपया
Plz send me in PDF full course I am very interested but not find plz help me
I need this pdf Tecnical analysis of stock market. .send me full details. .
PL.send me the full course . I want to learn
I need technical analysis of intra day trading PDF in hindi
Fantastic content… Request for a PDF
I want to learn
I’m interested to be master the course. Please share the complete course to my below mail ID .
[email protected]
please send me full course technical charts ,i want to learn it to invest in market
Sir please send in all accurate reversals patterns
pl. share the details as I am interested this course
Please I need the technical analysis pdf