This is the 22th Day course in a series of 60-Days called “Technical Analysis Training”
You will get daily one series of this Training after 8 o’clock night (Dinner Finished)
Follow MoneyMunch.com Technical Analysis Directory and Learn Basic Education of Technical Analysis on the Indian Stock Market (NSE/BSE)

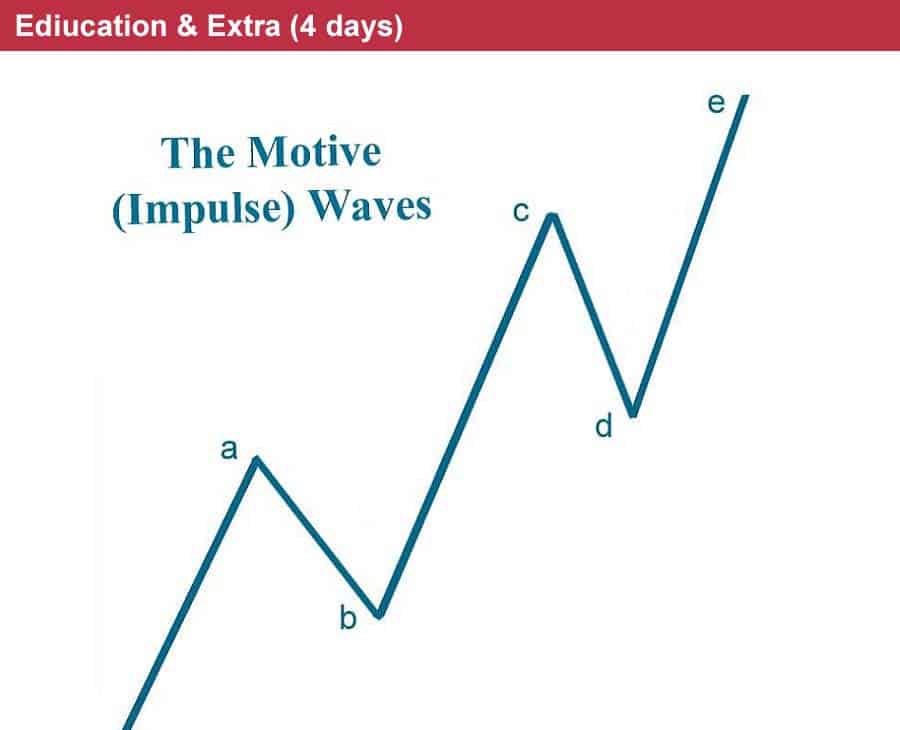
Motive (Impulse) Waves
Effect of Motive Waves
The most common motive wave is an impulse. Motive waves separated into five waves with certain peculiar and always move in the same direction as the trend of one larger degree. They are straightforward and comparably easy to recognize and clarify.
Within motive waves, wave 2 never retraces more than 100% of wave 1, and wave 4 never retraces more than 100% of wave 3. Wave 3, moreover, always travels beyond the end of wave 1. The goal of an impulse is to make progress, and these rules of formation assure that it will.
Elliott further discovered that in price terms, wave 3 is repeatedly the longest and never the shortest among waves 1, 3 and
5. As long as wave 3 endure a greater percentage movement than either wave 1 or 5, this rule is satisfied. It almost always holds on an arithmetic basis as well. There are two types of motive waves: impulses and diagonal triangles
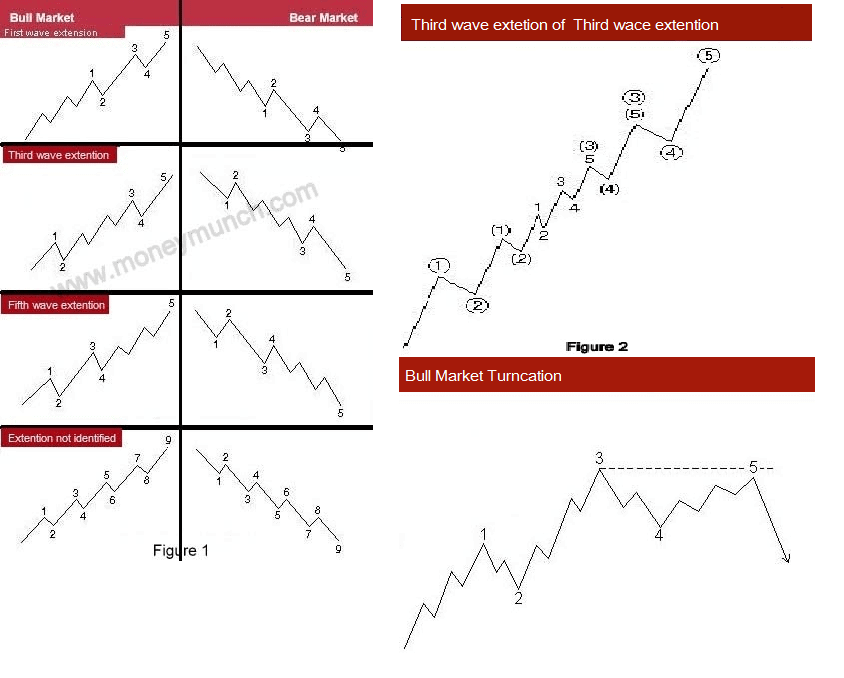
The most common motive wave is an impulse. In this, wave 4 does not enter the territory of “overlap” wave 1. This rule holds for all non-leveraged cash basis markets. Futures markets, with their extreme leverage, can induce short term price extremes that would not occur in cash markets. Even so, overlapping is frequently confined to daily and intraday price variation and even then is extremely rare. In addition, the actionary subwaves (1, 3 and 5) of an impulse are themselves motive, and subwave 3 is specifically an impulse. Figures 2, 3 and 4 all depict impulses in the 1, 3, 5, A and C wave positions.
It the above four pessage, there are only a few simple guidelines for depict impulses identically. A guideline is so called because it governs all waves to which it applies. Typical, yet not inevitable, peculiarity of waves are called guidelines, which are discussed in an upcoming section. A rule should never be disregarded. In many years of practice with countless patterns, the authors have found but one instance above Subminuette degree when all other rules and guidelines combined to suggest that a rule was broken. Analysts who routinely break any of the rules detailed in this section are practicing some form of analysis other than that guided by the Wave Principle. These rules have great practical utility in correct counting, which we will explore further in discussing extensions.
concentration
A truncated fifth wave does not move beyond the end of the third. It can frequently be verified by noting that the presumed fifth wave contains the necessary five subwaves, as illustrated in Figures3. Truncation gives warning of underlying weakness or strength in the market. In application, a truncated fifth wave will often cut short an expected target. This annoyance is counterbalanced by its clear implications for persistence in the new direction of trend.
Message for you(Trader/Investor): Google has the answers to most all of your questions, after exploring Google if you still have thoughts or questions my Email is open 24/7. Each week you will receive your Course Materials. You can print it and highlight for your Technical Analysis Training.
Wishing you a wonderful learning experience and the continued desire to grow your knowledge. Education is an essential part of living wisely and the Experiences of life, I hope you make it fun.
Learning how to profit in the Stock Market requires time and unfortunately mistakes which are called losses. Why not be profitable while you are learning?
TABLE OF CONTENTS
Candlestick and Chart Patterns (15 Days)
7 Most Important Candlestick Chart Patterns
- Gap Down Chart Pattern
- Gap Up Chart Pattern
- Gravestone Short-term Chart Pattern
- Hammer Candle Stick Chart Pattern
- Hanging Man Short-term Stock Chart Pattern
- Inverted Hammer Stock Chart Pattern
- Shooting Star Candle Stick Pattern
Top 2 Bearish Chart Patterns
Top 6 Bullish Chart Patterns
- Engulfing Line (Bullish) Chart Pattern
- Exhaustion Bar Chart Pattern (Bullish)
- Inside Bar Chart Pattern
- Island Bottom Chart Pattern
- Key Reversal Bar (Bullish) Chart Pattern
- Two Bar Reversal (Bullish) Chart Pattern
Indicators & Oscillators (12 Days)
Bullish or Bearish Indicators
Bullish or Bearish Oscillators
- Bollinger Bands Oscillator
- Commodity Channel Index (CCI)
- Fast Stochastic Oscillator
- Know Sure Thing (KST) Oscillator
- Momentum Oscillator
- Moving Average Convergence/Divergence (MACD) Oscillator
- Relative Strength Index (RSI)
- Slow Stochastic Oscillator
- Williams %R Oscillator
Classic Chart Patterns (29 Days)
Bearish Classic Chart Patterns
- Continuation Diamond (Bearish) Chart Pattern
- Continuation Wedge (Bearish)
- Descending Continuation Triangle Chart Pattern
- Diamond Top Chart Pattern
- Double Top Chart Pattern
- Downside Break Chart Pattern – Rectangle
- Flag Bearish Chart Pattern
- Head and Shoulders Top Chart Pattern
- Megaphone Top Chart Pattern
- Pennant Bearish Chart Pattern
- Rounded Top Chart Pattern
- Symmetrical Continuation Triangle (Bearish)
- Top Triangle/Wedge Chart Pattern
- Triple Top Chart Pattern
Bullish Classic Chart Patterns
- Ascending Continuation Triangle Chart Pattern
- Bottom Triangle Or Wedge Chart Pattern
- Continuation Diamond (Bullish) Chart Pattern
- Continuation Wedge Chart Pattern (Bullish)
- Cup with Handle Bullish Chart Pattern
- Diamond Bottom Chart Pattern
- Double Bottom Chart Pattern
- Flag Bullish Chart Pattern
- Head and Shoulders Bottom Chart Pattern
- Megaphone Bottom Chart Pattern
- Pennant Bullish Chart Pattern
- Round Bottom Chart Pattern
- Symmetrical Continuation Triangle Bullish
- Triple Bottom Chart Pattern
- Upside Breakout Chart Pattern – Rectangle
Best Trading Theories (4 Days)
- Basics of Dow theory trading strategy forecasts
- Motive (Impulse) Waves
- Corrective Waves
- Wyckoff Chart Reading
Kind attention: this course is helpful for beginner and intermediate traders. It’s free for everyone. Advanced modules, trading strategies, and data (in-depth) are available for Moneymunch’s premium subscribers.
Get free important share market ideas on stocks & nifty tips chart setups, analysis for the upcoming session, and more by joining the below link: Stock Tips
Have you any questions/feedback about this article? Please leave your queries in the comment box for answers.

