Unlock This Article
Only subscribers can read the full article. Please login to read the entire article.
Trade Setup: MCX LEAD, ZINC & NICKEL
Continue reading
Enhance your MCX lead trading skills with Moneymunch’s free lead trading tips and market analysis. Stay updated on the latest commodity market trends and make profitable trades.
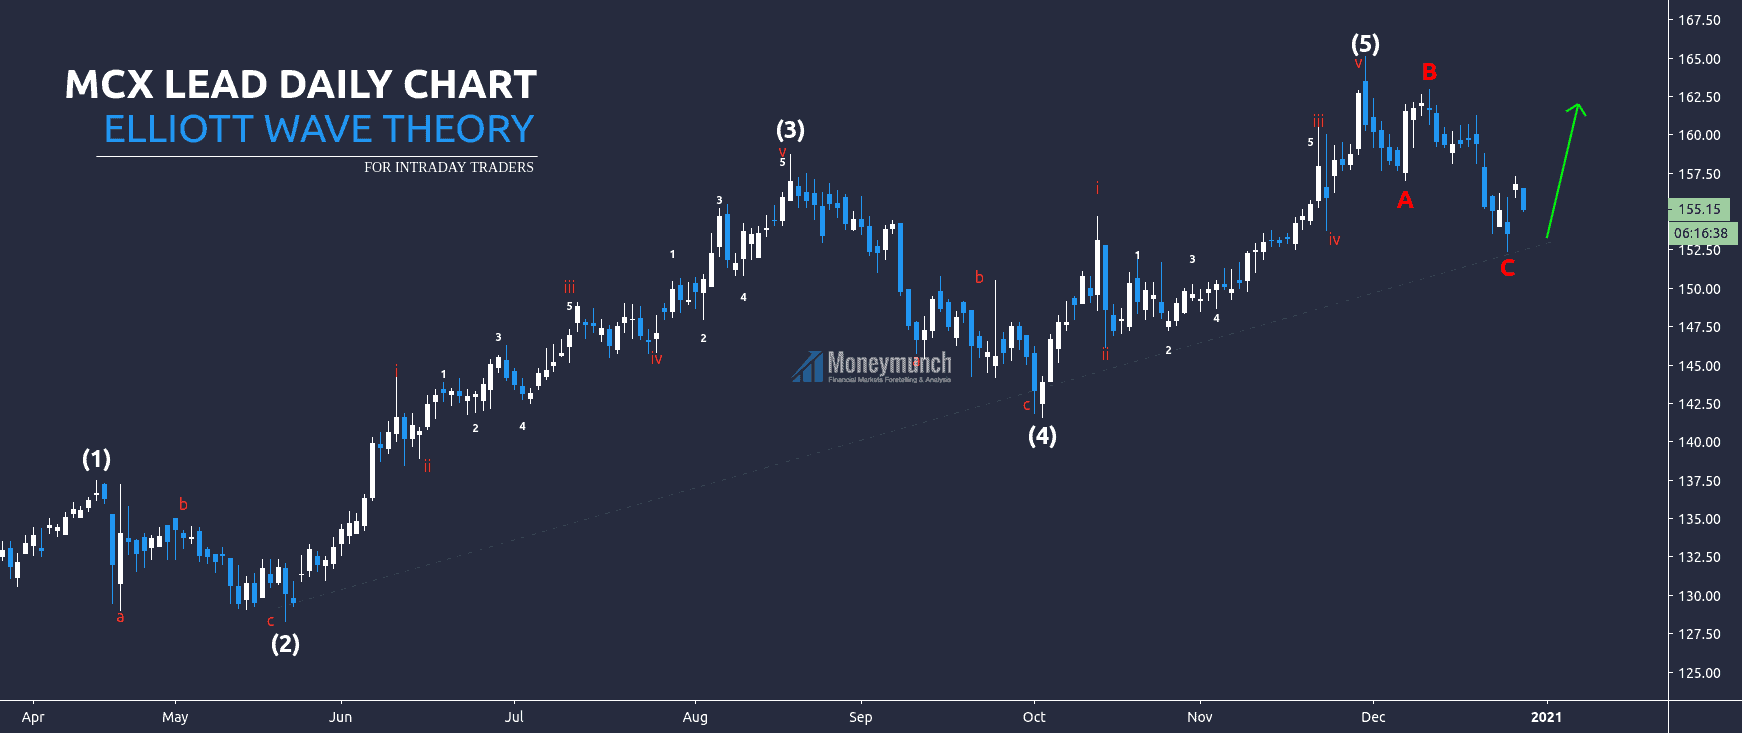
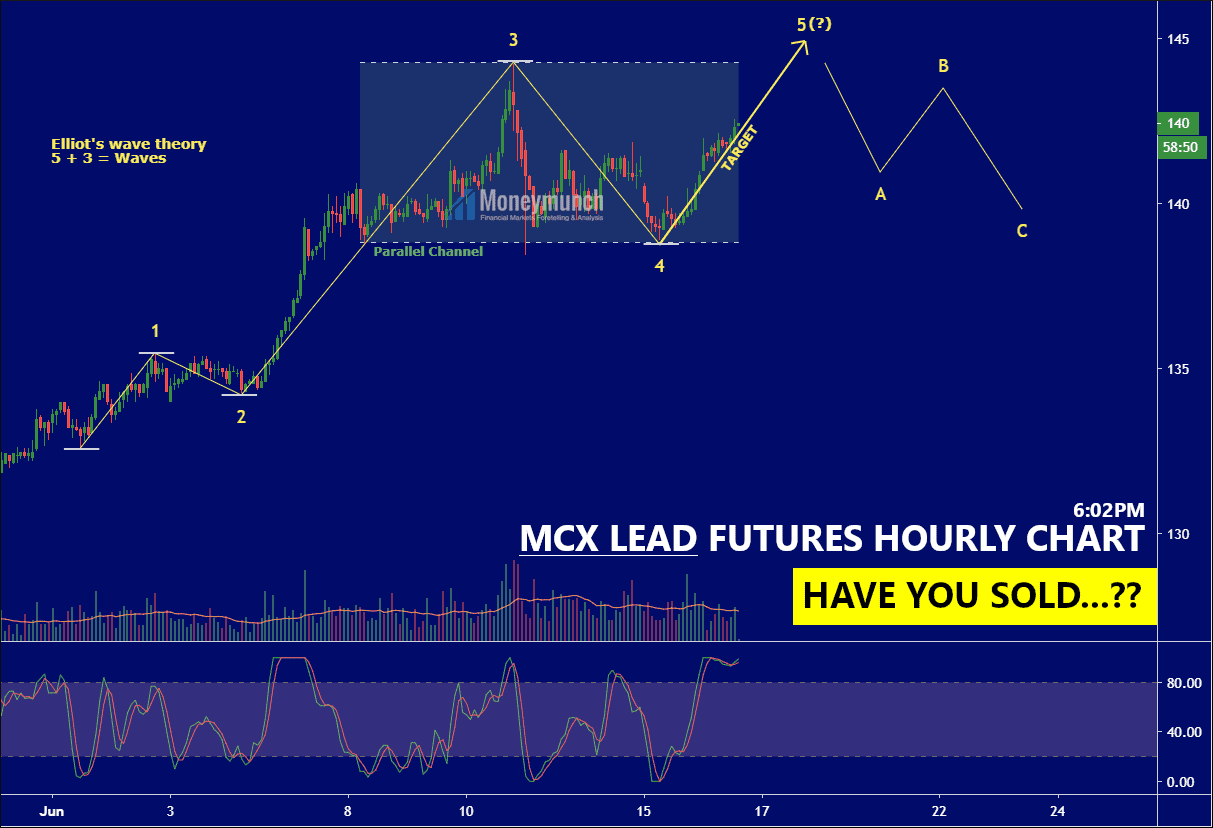
It’s the daily chart of the lead. Here, it has made the bullish Elliott pattern, and the ABC correction was completed on the 24th of December 2020. And right now, it started to move upside as per the rules of the bullish Elliott wave pattern. And it will move upwards till 158.6 – 162.
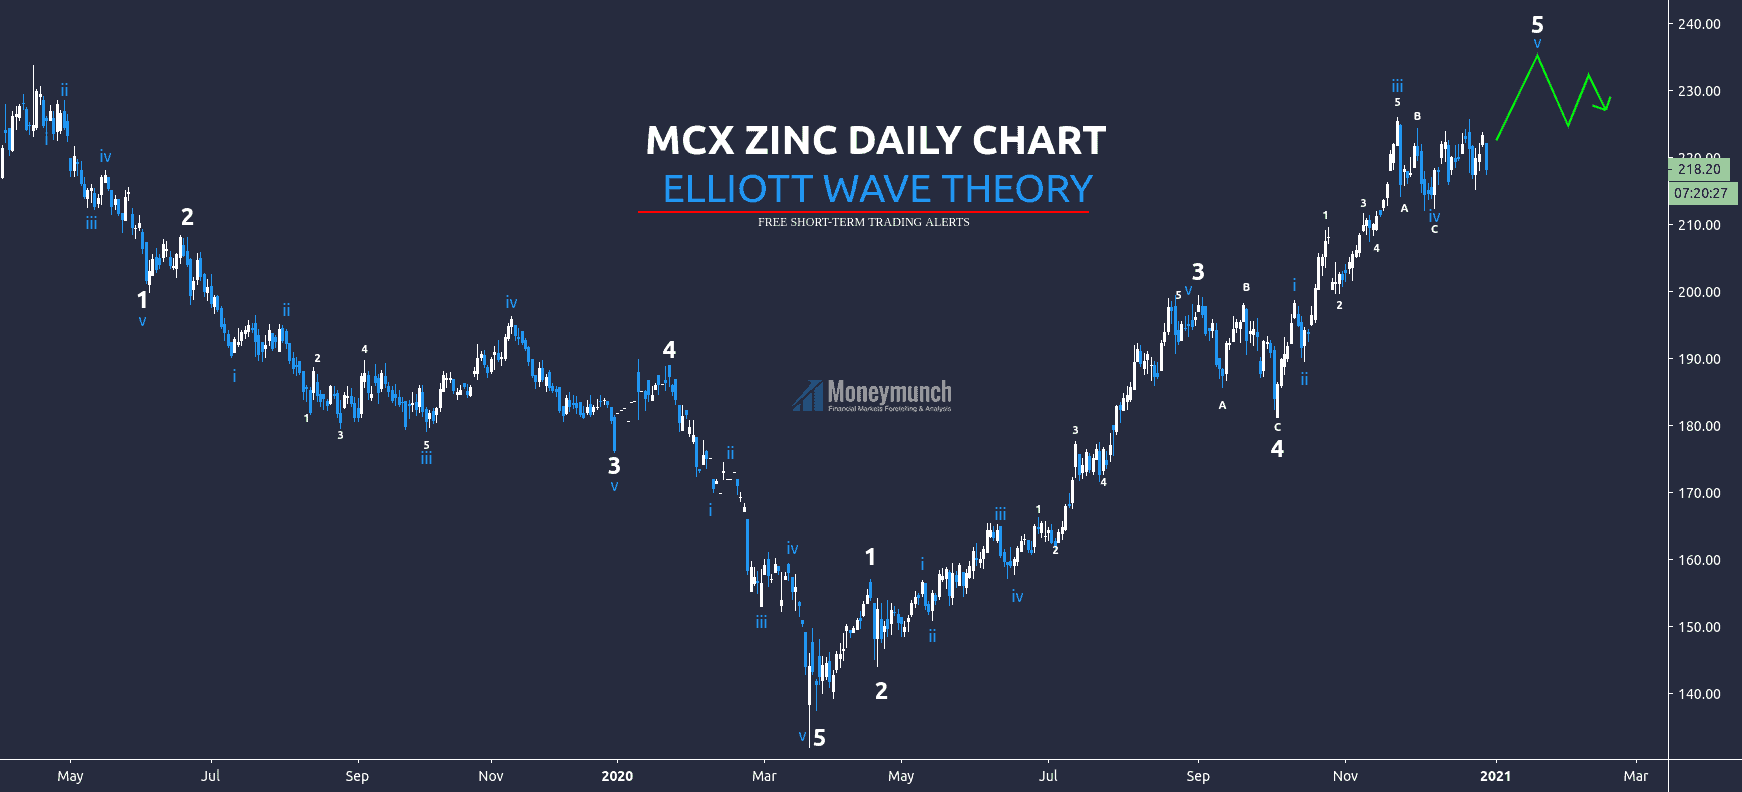
Here’s the daily chart of the MCX zinc. It has made two Elliott waves. The first one is bearish, and the second one is bullish. The bearish was started from the 11th of April 2019 and ended on the 19th of March 2020. The bullish one started on the 19th of March 2020, and the fifth wave of this Elliott wave is remaining. In the Elliott wave theory, each wave has five sub-waves.
Short-term investors can see the following levels soon: 228 – 234 – 240.
To become a subscriber, subscribe to our free newsletter services. Our service is free for all.
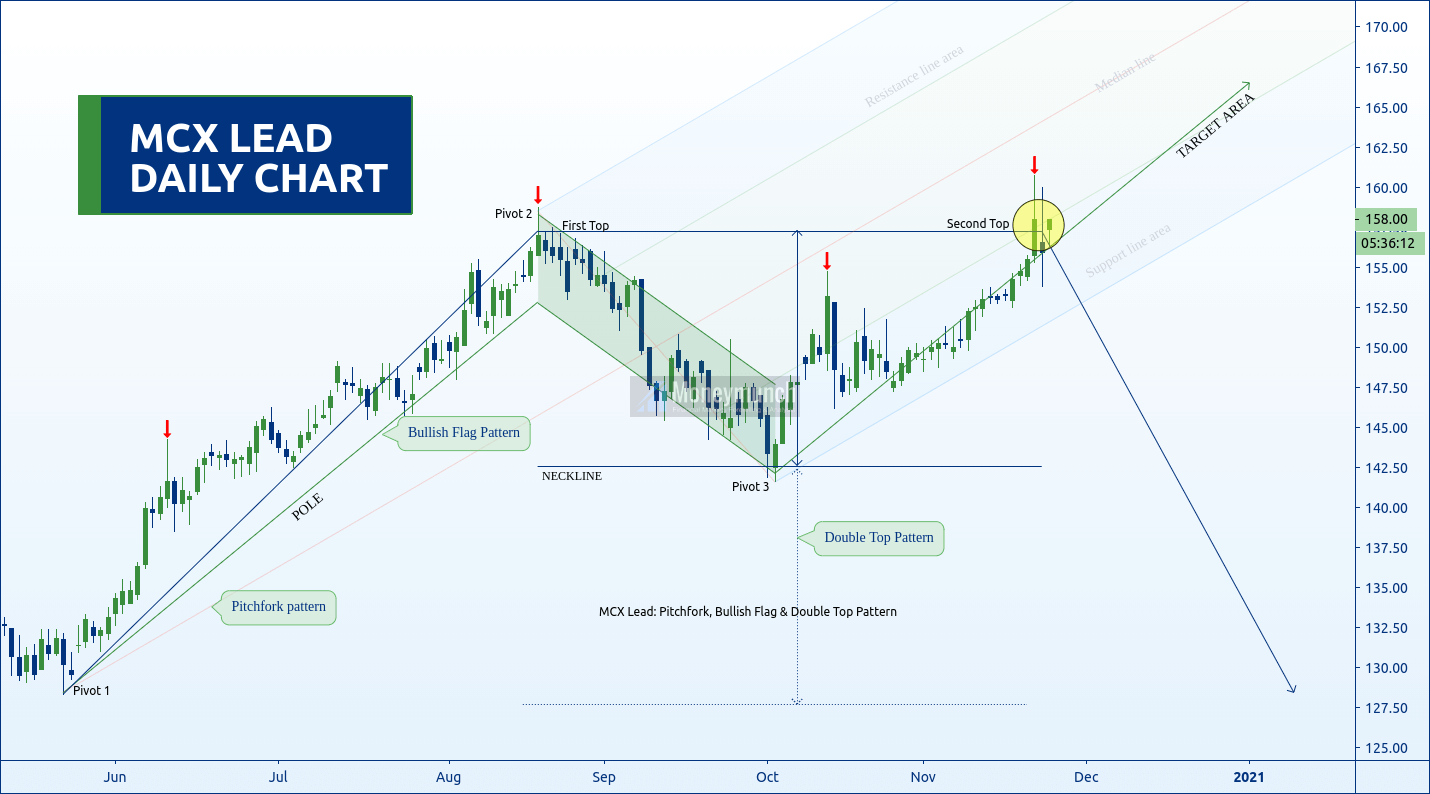
Here I have used the three most popular patterns, which are pitchfork pattern, bullish flag pattern, and double top pattern on MCX Nickel daily chart.
First, let’s start with a pitchfork pattern. Nickel is running on the support line area. This movement indicates a continuous uptrend ahead.
The second thing is the bullish flag pattern, which also indicates the same. After a short reversal, nickel will start marching for the following targets: 162 – 164 – 166+
If the trend breaks the support line, there will be an activation of the double top pattern, which indicates the fall to the following levels: 148 – 145 – 142.6
Additionally, a breakout of the neckline is a direct sign of an extreme downtrend. And that will become unstoppable and hit the following levels: 136 – 132 – 128
To become a subscriber, subscribe to our free newsletter services. Our service is free for all.
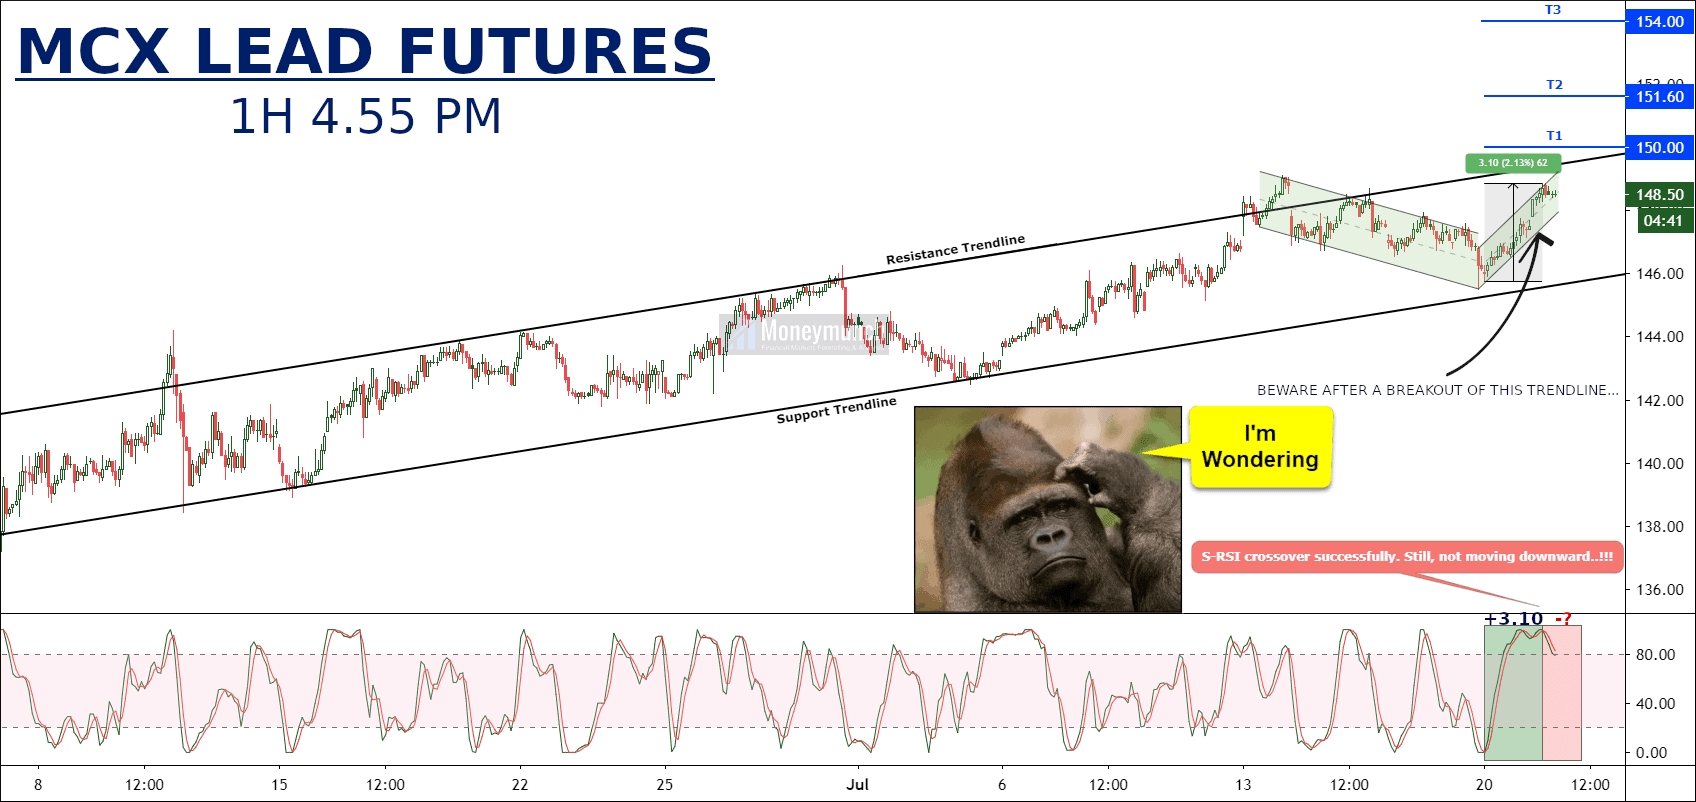
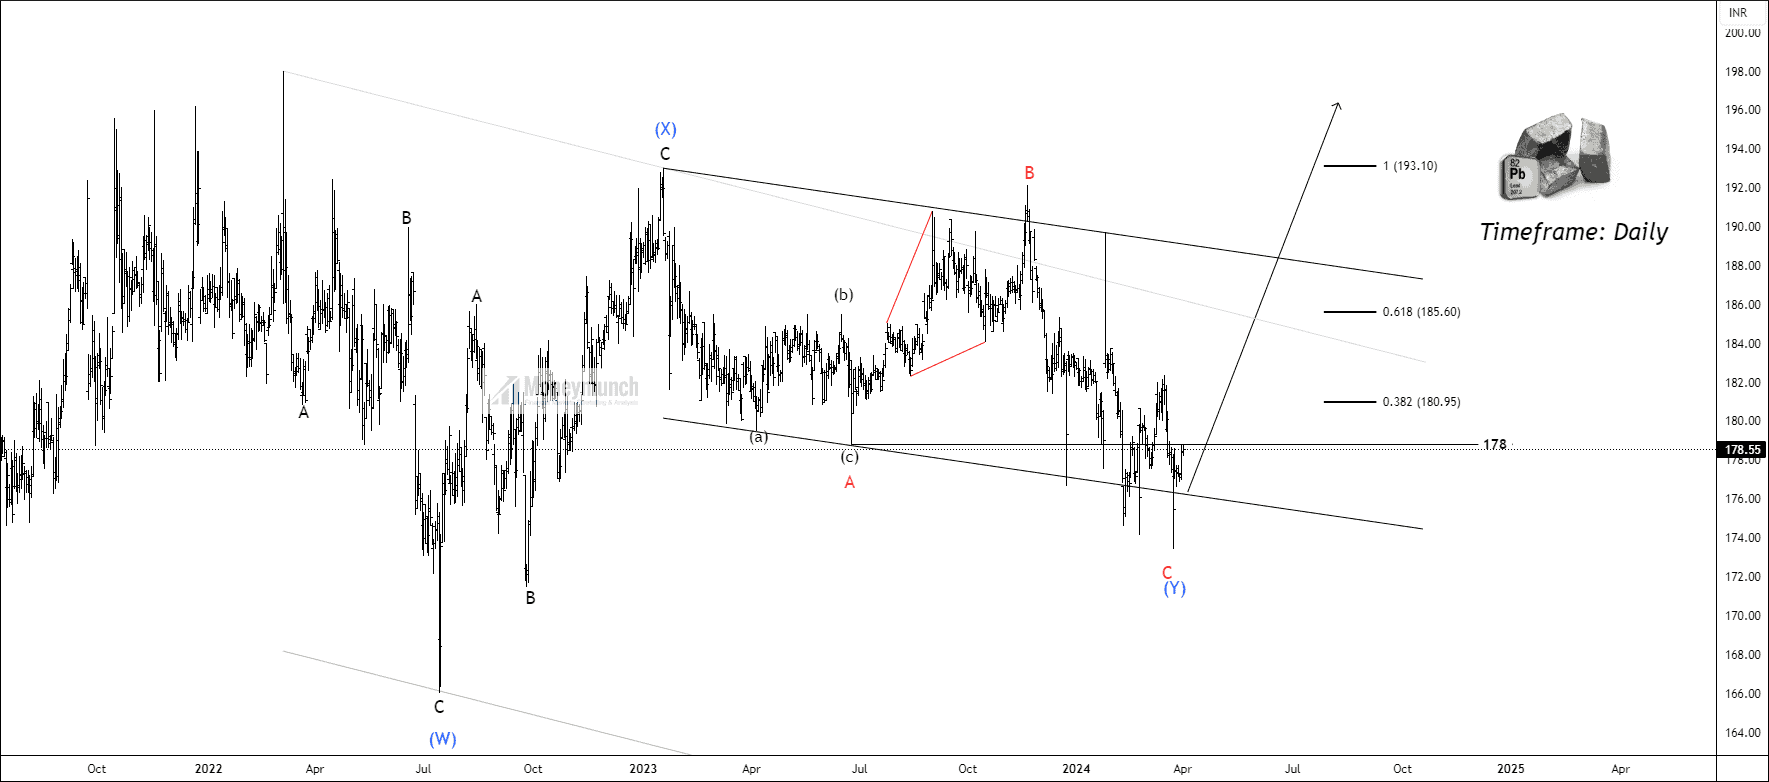
As per this MCX Lead chart, it’s trying to march upward. We may see T1 to T3 soon. Further information I will update you soon.
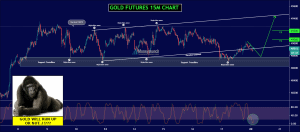
UPDATE: Gold & Copper Overall Outlook Is ‘Strongly Bullish’
Yesterday’s Chart:
Today:
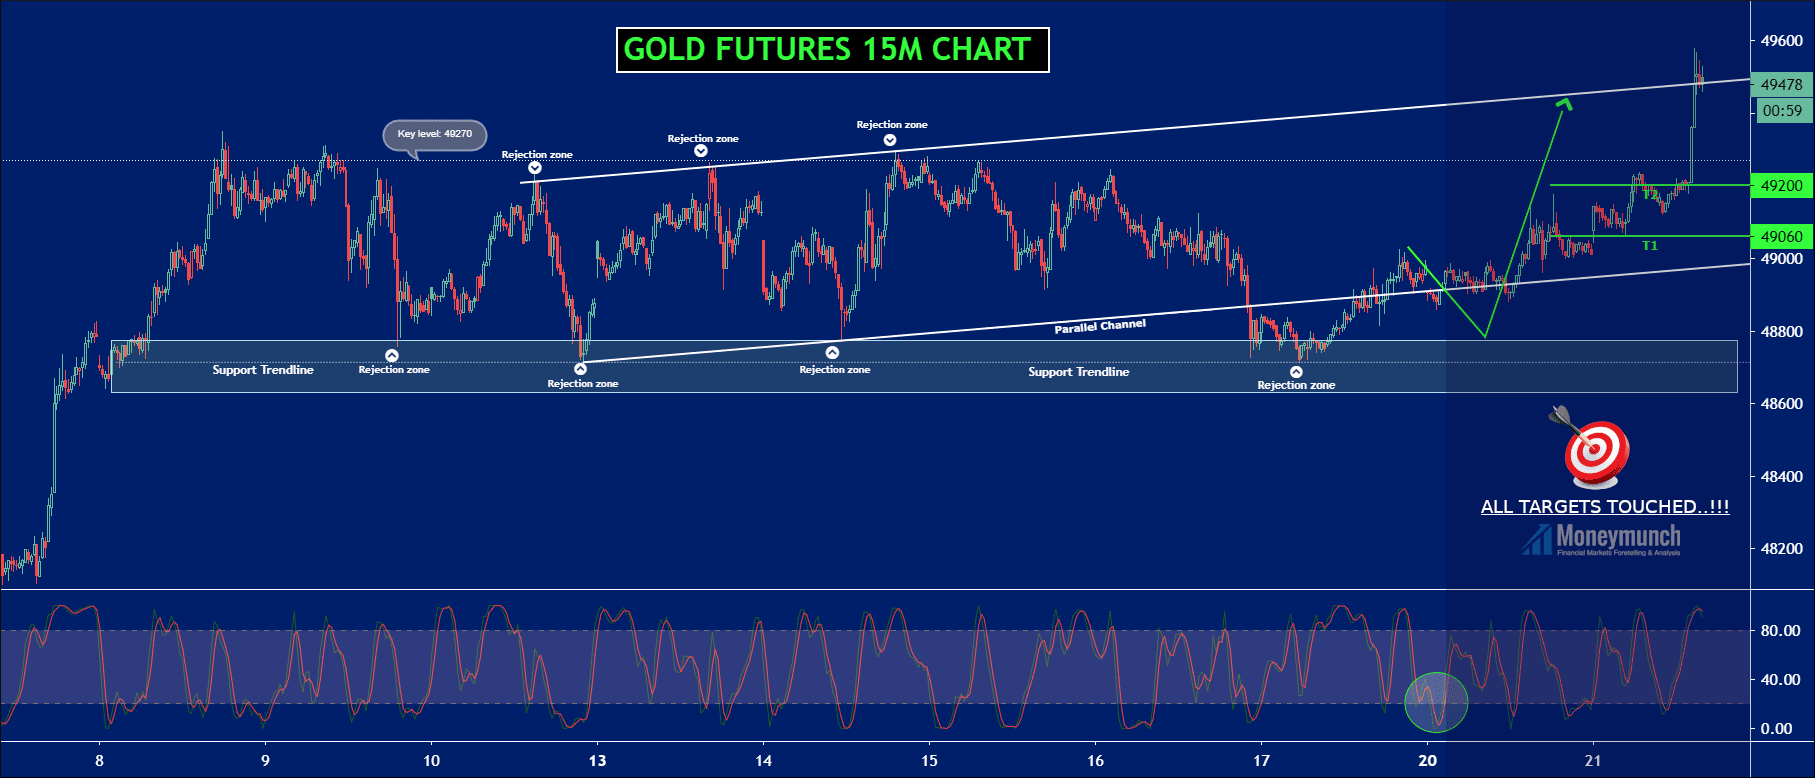
Gold call hit all targets level. Moreover, it has touched the key level within 24 hours. To become a subscriber, subscribe to our free newsletter services. Our service is free for all.
To become a subscriber, subscribe to our free newsletter services. Our service is free for all.