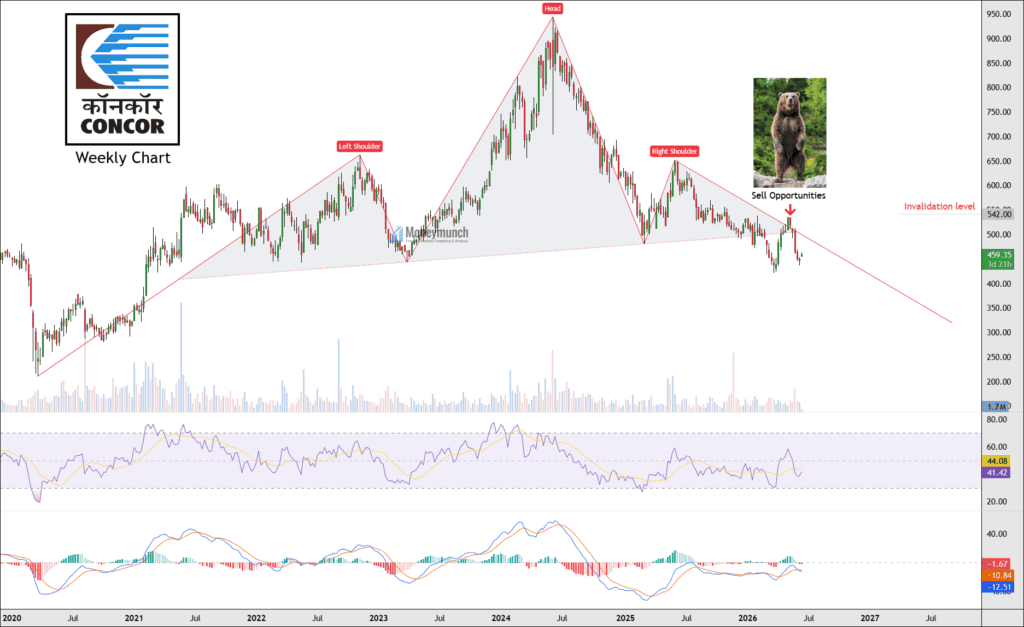
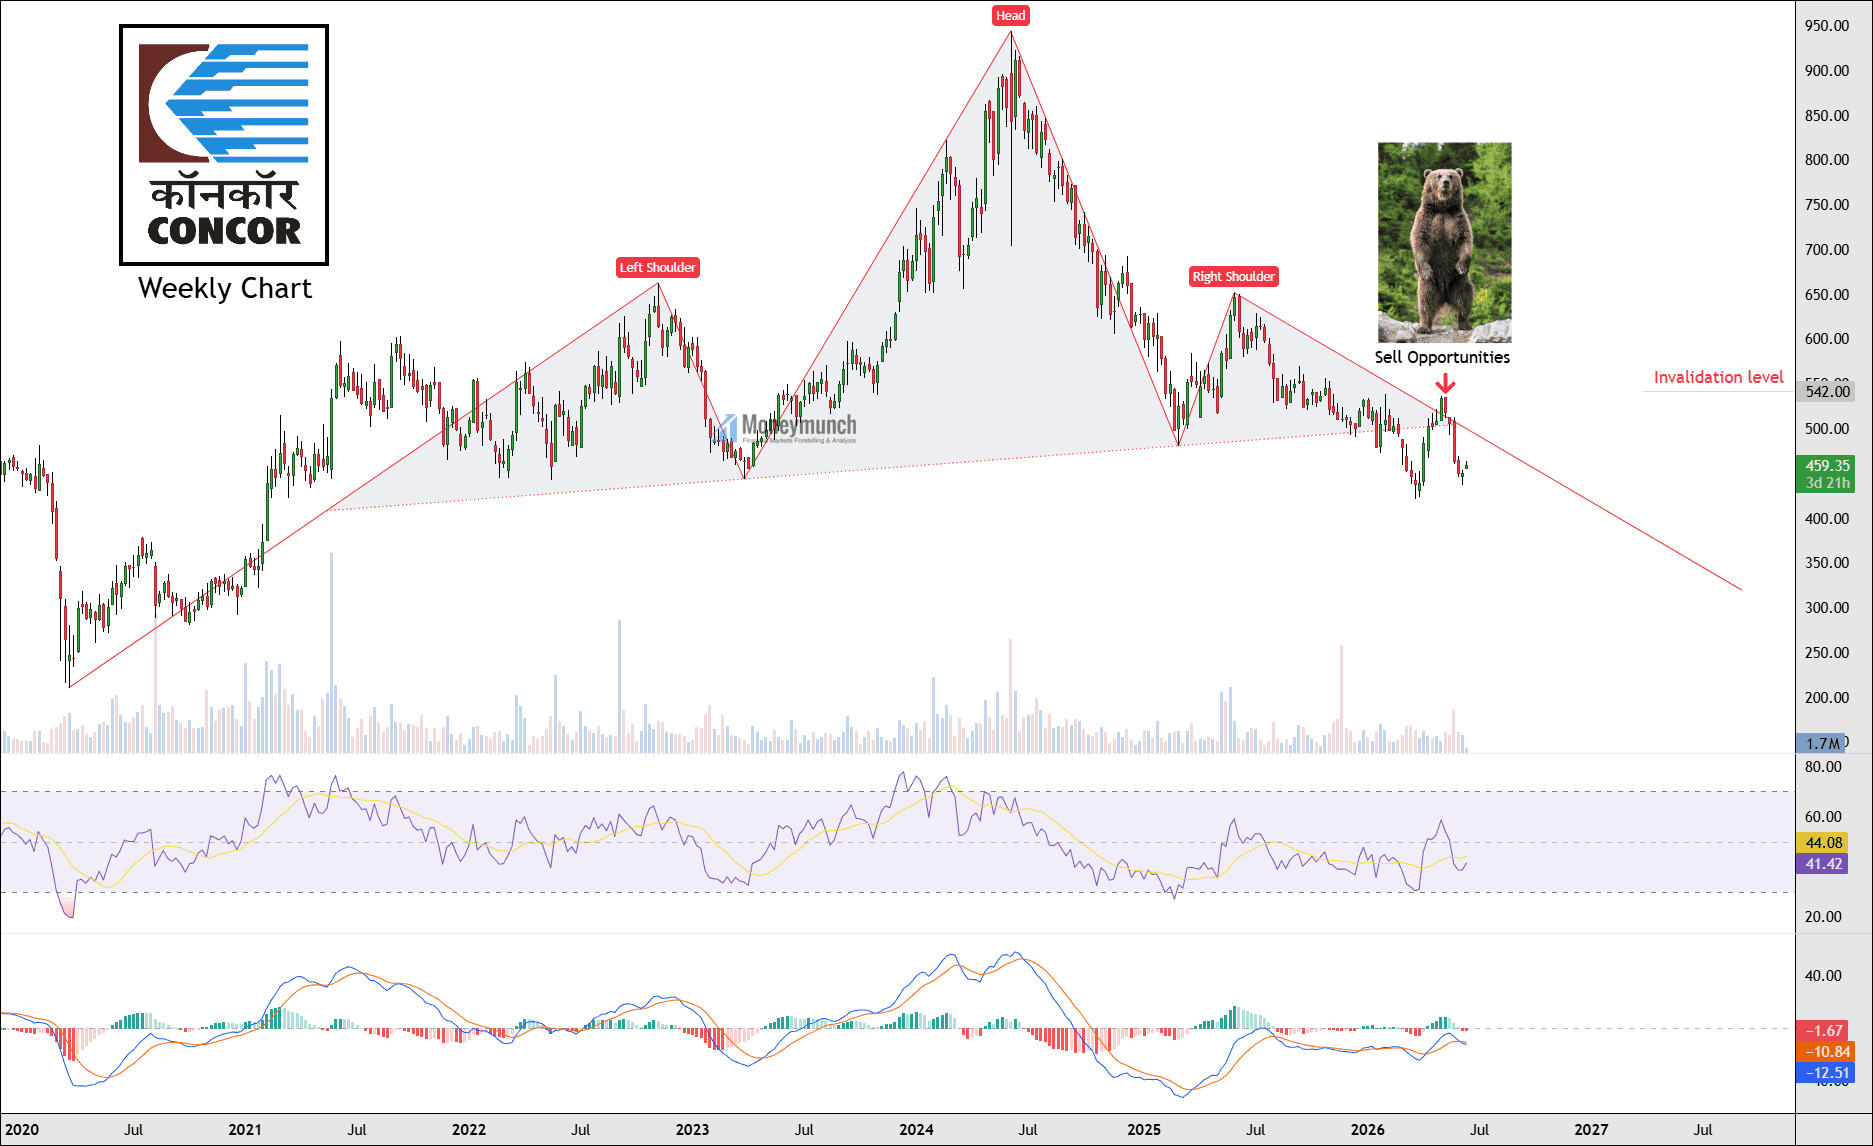
CONCOR Weekly Chart Signals Bearish Trend After Head & Shoulders Breakdown
Container Corporation of India Ltd. (CONCOR) is showing signs of weakness on the weekly chart. The stock appears to have formed a Head & Shoulders pattern, which is generally considered a bearish reversal pattern. Price has already moved below the neckline support, indicating that the long-term uptrend has lost strength.
Momentum indicators are also supporting the negative view. The RSI has failed to make new highs, showing weakening momentum, while the MACD remains below the zero line, suggesting that buying interest is still limited. Volume has gradually declined after the formation of the head, which is in line with a typical topping pattern.
- Targets: 426 – 400
- Long-term targets: 360 – 326 – 300
Get free important share market ideas on stocks & nifty tips chart setups, analysis for the upcoming session, and more by joining the below link: Stock Tips
Have you any questions/feedback about this article? Please leave your queries in the comment box for answers.
no sell but still buy slow
can i have premium access for 7 day? I will join thank you
Good report. What’s your analysis now?