Publish Date: 26/08/2021
UPDATE 2.0
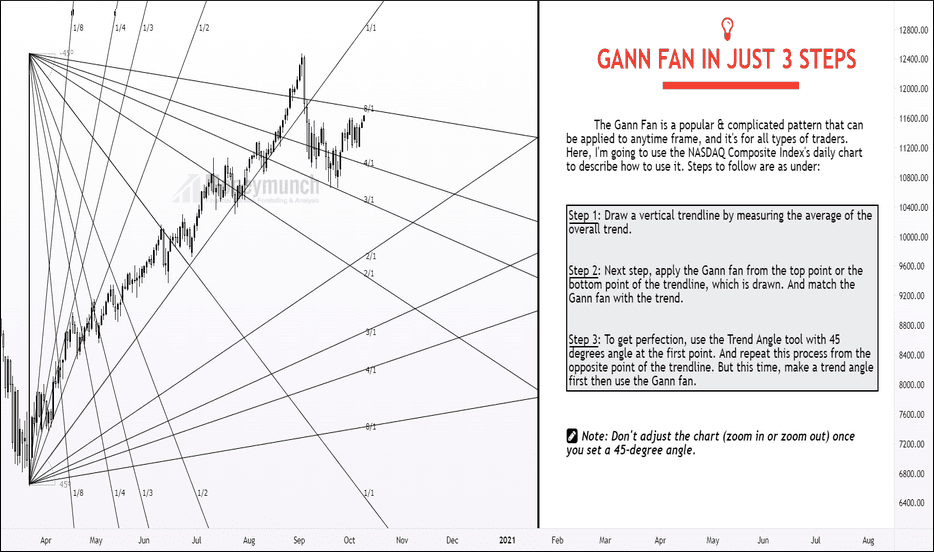
3-Tricks : Where to start Elliott Wave counting on the chart?
We get a lot of questions about Elliott Wave, but a set of questions often received from the followers:
- Where to start wave counting on the chart?
- How do I begin/start wave counting on the chart?
- How do you do Wave Counting?
Part 1: Which Strike Prices Are The Most Money-Making?
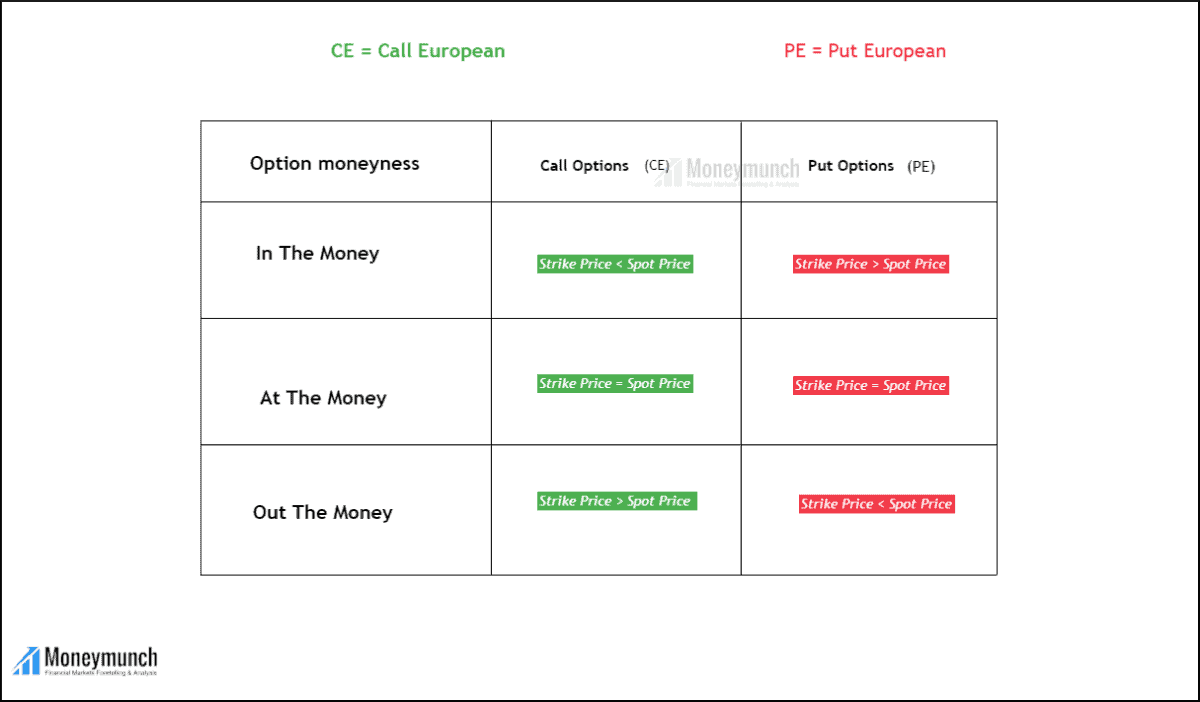 Figure 1.1
There is tremendous importance in options trading when it comes to strike prices. Traders can reduce the pain of option decay by choosing the right strike price. In terms of money, there are three kinds of strike prices. 1) ATM – At the Money 2) OTM – Out of the Money 3) ITM – In the MoneyContinue reading
Part 1: How to Count Waves Using Chart Patterns?
We can count waves using traditional patterns like Head and shoulders , Double Top and Bottom,
Triangle, cup & handle, etc. This article is about how you can count waves by identifying chart patterns.
I have covered Three chart patterns in this article,
1) Triangles
2) Head and shoulders
3) Double Top and Bottom
1) Head and shoulders :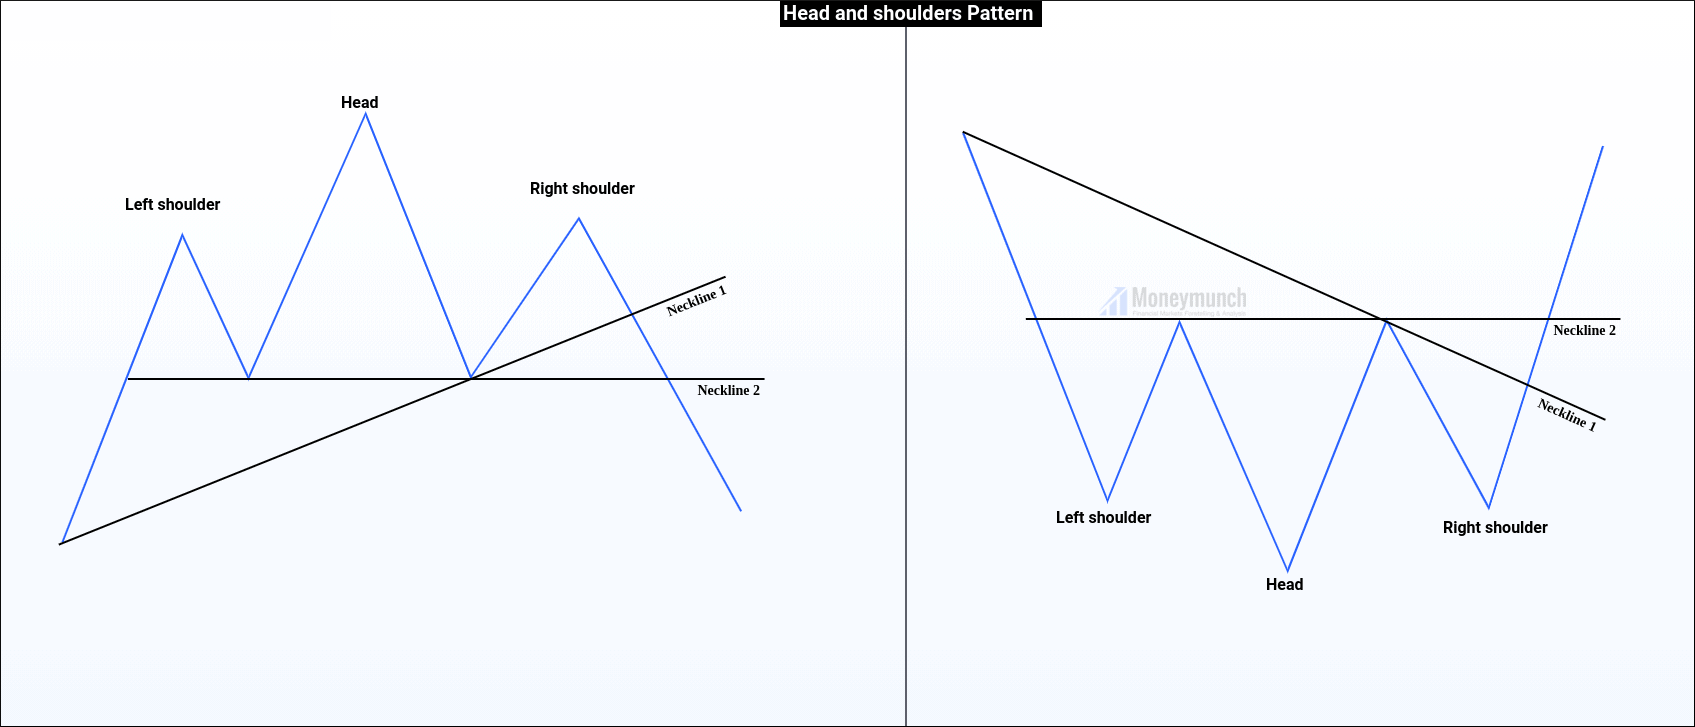
Information on Elliott waves trading analysis
Yesterday we had provided this:
RELIANCE NSE:
Buy reliance 2018
Stop-loss 2009
Target 2057
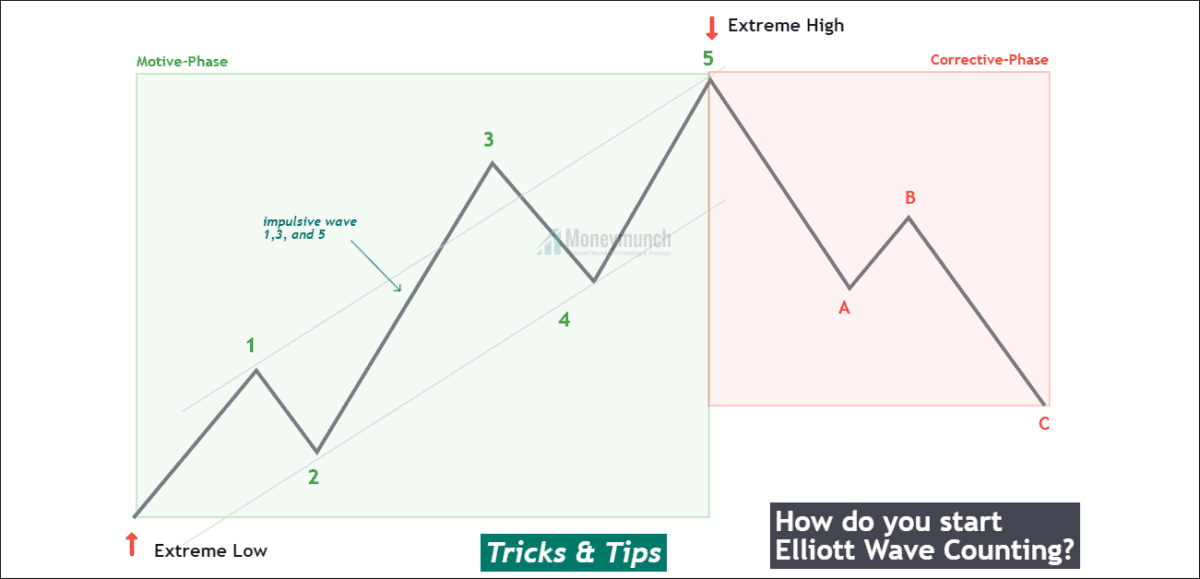
What is Elliott wave theory?
Elliott wave theory is a method of technical analysis that looks for red current long-term price patterns related to persistent changes in investor sentiment and psychology, the theory identified as impulsive waves that set up a pattern and corrective waves that oppose the larger trend.
The Elliott wave theory was developed by Ralph.nelson, Elliott to describe price movements in financial market, in which he observed and identified recurring.fractal wave patterns wave can be identified in stock price movements and in consumer behavior investors trying to profit from a market trend could be described as” riding a wave” a larger, strong movement by homeowners to replace their existing mortgages with new ones that have better term is called a refinancing wave.
To become a subscriber, subscribe to our free newsletter services. Our service is free for all.

How do Elliott waves work in our trade?
Some technical analysts try to profit from wave patterns in the stock market using the Elliott wave theory, this hypothesis says that sock price movements can be predicted because they move in repeating up and down patterns called waves they are created by investor psychology.
The theory identifies several types of waves including motive waves, the subject can not all traders interpret the theory the same way to agree that it is a successful strategy. The whole idea of wave analysis itself does not educate to a regular blueprint information, where you simply follow the traction, unlike most other price information, wave analysis offer signal into text dynamic and helps you understand price movements in a much deeper way.

The Elliott wave principle consists of impulse and corrective wave at its core
Impulsive wave consists of five sub-wave that make next movement in the same direction as the trend of the next largest degree this pattern is the most common motive wave and the easiest to spot in a market, like all motive wave, it consists of five sub wave three of them are also motive waves, and two corrective waves .this is labeled as a5-3-5-3-5 structure, which was shown above
Corrective wave-consist of three, or combination of three, sub wave that make at motion opposite to the trend of the next largest degree like all motive waves, its goal is to move the mark in the direction of the trend
Also, like all motive consists of five sub waves the difference is that the diagonal looks like either an expanding or contracting wedge .also the sub-wave of the diagonal may not have a count of five, depending on what types of diagonal is being observed.as with the motive waves, each sub wave, and sub wave three of the diagonal may not be the shortest wave.

To be CONTINUE this research in next “STOCK ANALYSIS”
Continue reading
Full information how to trade using MACD INDICATOR
What is MACD indicator?
MACD is a trend following indicator. MACD indicator is created by two EMI(exponential moving average)indicators,MACD indicator is the one type of moving average indicator.
The MACD indicator have 4 main point important
1.MACD line(fast line)-indicated with green line
2. Signal line (slow line)-indicated with green line
3. Zero line(baseline and center line)
4. MACD histogram
Exponential Moving Average (EMA)-calculation
MACD line (12 day EMA-26day EMA)
signal line (9 day EMA of MACD line)
MACD histogram (MACD line-signal line)
IMPORTANT NOTICE FOR OUR SUBSCRIBERS:
Only subscribers can read the full article. Please login to read the entire article.
 Unlock This Article
To become a subscriber, subscribe to our free newsletter services. Our service is free for all.

How to trade with MACD indicator-(MACD-MOVING AVERAGE CONVERGENCE DIVERGENCE)
This indicator is invented by Gnvented in.MACerald Apple,this indicator is the most important and popular indicator for trading…
this indicator used in:
-share market
-commodity market
-forex market
-future market
MACD Indicator is very helpful for long term trader and short term trader, similarly.
NOTE– The most important MACD indicator is when you trade with MACD then your stop loss is in very close range.when your trade triggered stop loss it can give you a very small loss……it is helpful to take a smaller loss.

How does MACD work?
In this indicator have 2-important line, MACD line and signal line. MACD line and signal line provide a signal moving around zero line. When the MACD line and signal line are crossed over then it is given a signal for buying and selling.
The MACD indicator have 2 types of cross over
- Positive cross over(bullish crossover)
- Negative cross over(bearish crossover)
When the MACD line is cross over down-up, it is a signal for buying-positive cross over-BULLISH TREND. When the MACD line is cross over up-down, it is a signal for selling-negative cross over-BEARISH TREND.
In MACD Why is the zero line important?
When positive crossover created upside of zero line and positive crossover created in downside of zero line and after both lines going the upside of zero line -STRONG BULLISH TREND. When negative crossover created downside of zero line and negative crossover created in upside of zero line and after both lines going the downside of zero line -STRONG BEARISH TREND.
Note: When a positive crossover is created in the downside of zero line it is not a strong bullish trend then both lines cross over upside it is a strong bullish trend. If the both line is not cross over-wishaw. When negative crossover is created in the upside of zero line it is not a strong bearish trend, then both lines cross over downside it is a strong bearish trend. If the both line is not cross over-wishaw.
MACD indicator double top and double bottom
When MACD is created a double top in upside of zero line then more chances to trend reversal. When MACD is created a double bottom in downside of zero line then more chances to trend reversal.
How does MACD-histogram help?
MACD-histogram shows a trend and momentum in the positive divergence(trend strength) and negative(trend weakness) divergence. HISTOGRAMS DIVERGENCE-(1)histogram positive divergence(2)histogram negative divergence.
(1)histogram positive divergence-then price goes down, MACD goes down, but histogram will go up it is signal of bullish.
(2)histogram negative divergence-then price go up, MACD go up, but histogram will be going down it is sign of be
MACD divergence:(1)positive divergence(bullish divergence)(2)negative(bearish divergence)
(1)positive divergence(bullish divergence):-when price will move in downside and MACD gives a signal of up movement it is signal of positive divergence.
(2)negative(bearish divergence):-when price will move in upside and MACD gives a signal of down movement, it is a signal of negative divergence.
How does MACD help in buying and selling?
(1)when MACD line is cross over down-up, it is signal for buying-positive cross over-buying signal
(2)when a MACD line is cross over up-down, it is a signal for selling-negative cross over-selling signal.
Note: when MACD is created a double top in upside of zero line then more chances to trend reversal. When MACD is created a double bottom in downside of zero line then more chances to trend reversal
HISTOGRAMS DIVERGENCE-(1)histogram positive divergence(2)histogram negative divergence.
(1)histogram positive divergence-buy
(2)histogram negative divergence-sell.
Continue reading