Information on Elliott waves trading analysis

Yesterday we had provided this:

RELIANCE NSE:
Buy reliance 2018
Stop-loss 2009
Target 2057

What is Elliott wave theory?

Elliott wave theory is a method of technical analysis that looks for red current long-term price patterns related to persistent changes in investor sentiment and psychology, the theory identified as impulsive waves that set up a pattern and corrective waves that oppose the larger trend.

The Elliott wave theory was developed by Ralph.nelson, Elliott to describe price movements in financial market, in which he observed and identified recurring.fractal wave patterns wave can be identified in stock price movements and in consumer behavior investors trying to profit from a market trend could be described as” riding a wave” a larger, strong movement by homeowners to replace their existing mortgages with new ones that have better term is called a refinancing wave.

To become a subscriber, subscribe to our free newsletter services. Our service is free for all.

How do Elliott waves work in our trade?

Some technical analysts try to profit from wave patterns in the stock market using the Elliott wave theory, this hypothesis says that sock price movements can be predicted because they move in repeating up and down patterns called waves they are created by investor psychology.

The theory identifies several types of waves including motive waves, the subject can not all traders interpret the theory the same way to agree that it is a successful strategy. The whole idea of wave analysis itself does not educate to a regular blueprint information, where you simply  follow the traction, unlike most other price information, wave analysis offer signal into text dynamic and helps you understand price movements in a much deeper way.

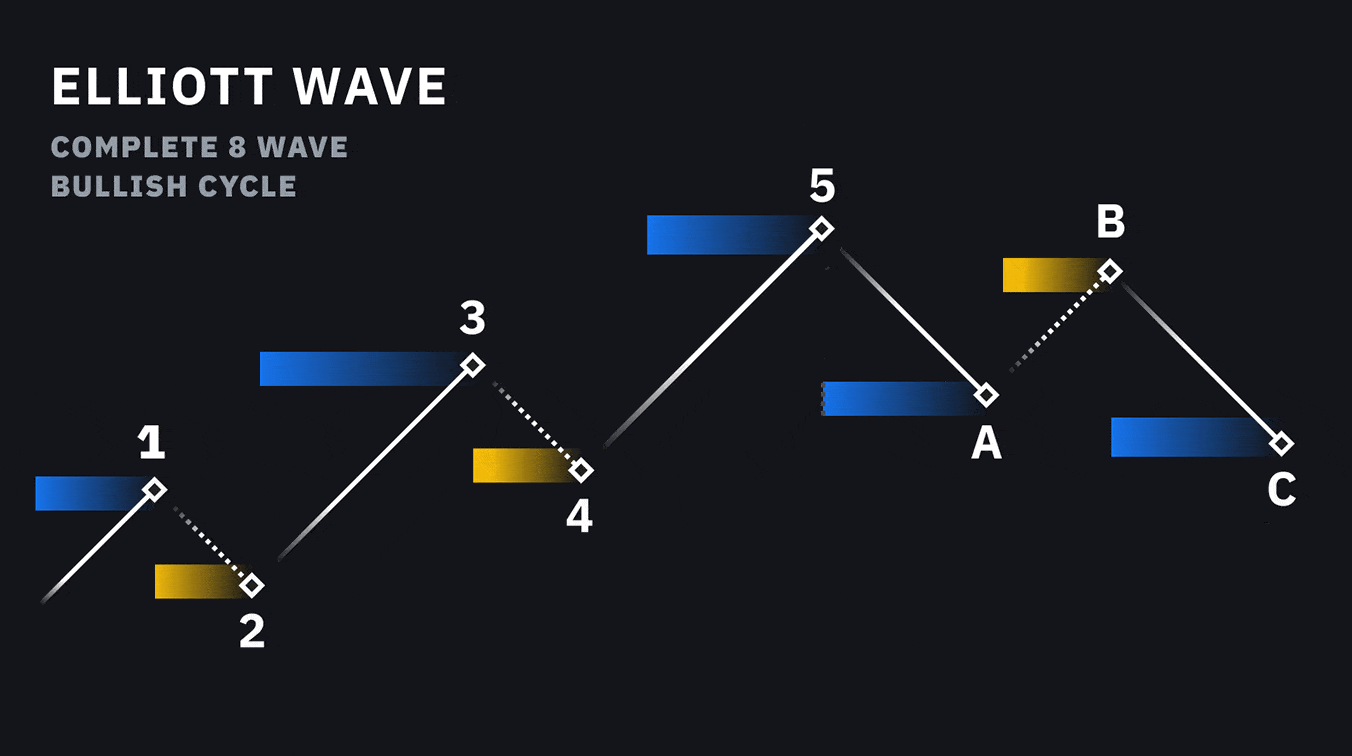
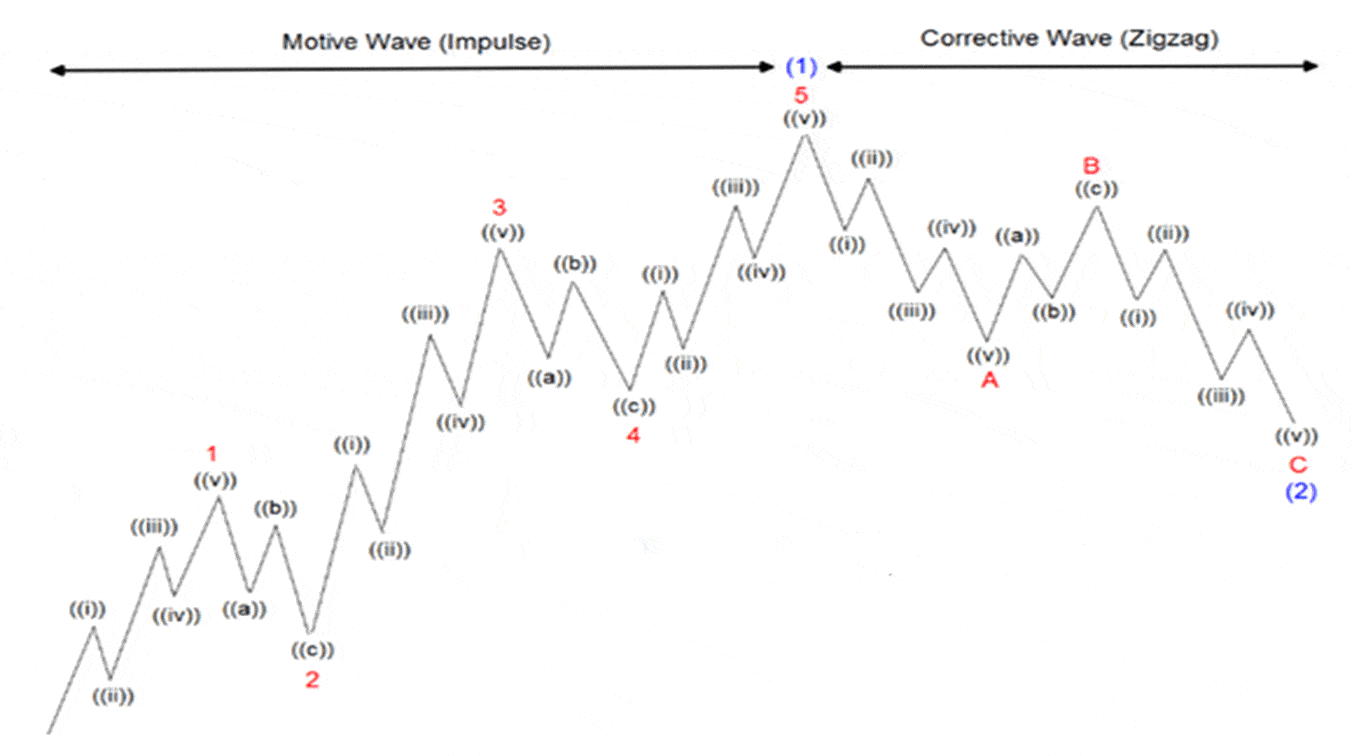
The Elliott wave principle consists of impulse and corrective wave at its core

Impulsive wave consists of five sub-wave that make next movement in the same direction as the trend of the next largest degree this pattern is the most common motive wave and the easiest to spot in  a market, like all motive wave, it consists of five sub wave three of them are also motive waves, and two corrective waves .this is labeled as a5-3-5-3-5 structure, which was shown above 

Corrective wave-consist of three, or combination of three, sub wave that make at motion opposite to the trend of the next largest degree like all motive waves, its goal is to move the mark in the direction of the trend

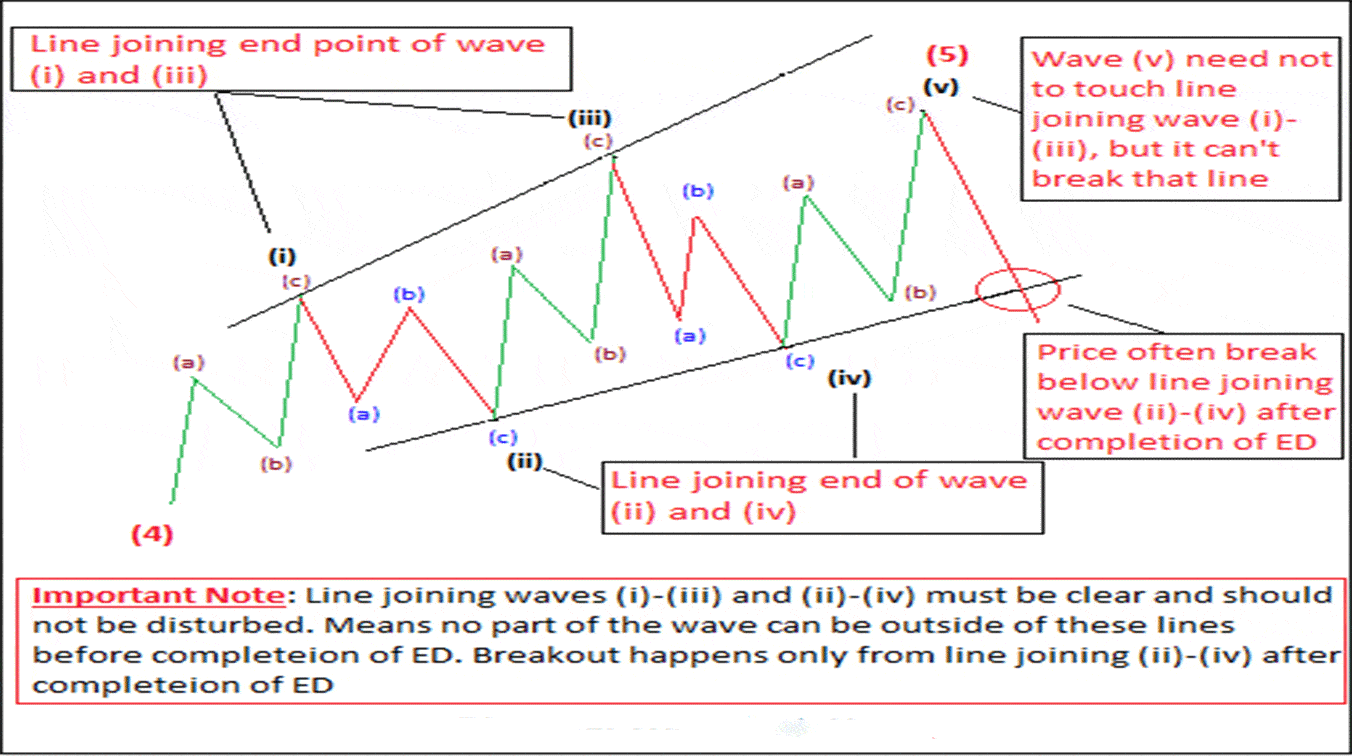
Also, like all motive consists of five sub waves the difference is that the diagonal looks like either an expanding or contracting wedge .also the sub-wave  of the diagonal may not have a count of five, depending on what types of diagonal is being observed.as with the motive waves, each sub wave, and sub wave three of the diagonal may not be the shortest wave.

To be CONTINUE this research in next  STOCK ANALYSIS”

Continue reading

Full information how to trade using MACD INDICATOR

What is MACD indicator?

MACD is a trend following indicator. MACD indicator is created by two EMI(exponential moving average)indicators,MACD indicator is the one type of moving average indicator.

The MACD indicator have 4 main point important

1.MACD line(fast line)-indicated with green line

2. Signal line (slow line)-indicated with green line

3. Zero line(baseline and center line)

4. MACD histogram

Exponential Moving Average (EMA)-calculation

MACD line (12 day EMA-26day EMA)

signal line (9 day EMA of MACD line)

MACD histogram (MACD line-signal line)

IMPORTANT NOTICE FOR OUR SUBSCRIBERS:

To become a subscriber, subscribe to our free newsletter services. Our service is free for all.

How to trade with MACD indicator-(MACD-MOVING AVERAGE CONVERGENCE DIVERGENCE)

 This indicator is invented by Gnvented in.MACerald Apple,this indicator is the most important and popular indicator for trading…

 this indicator used in:

     -share market    

     -commodity market

     -forex market

     -future market

MACD Indicator is very helpful for long term trader and short term trader, similarly.

      NOTE– The most important MACD indicator is when you trade with MACD then your stop loss is in very close range.when your trade triggered stop loss it can give you a very small loss……it is helpful to take a smaller loss.

How does MACD work?

In this indicator have 2-important line, MACD line and signal line. MACD line and signal line provide a signal moving around zero line. When the MACD line and signal line are crossed over then it is given a signal for buying and selling.

The MACD indicator have 2 types of cross over

  1. Positive cross over(bullish crossover)
  2. Negative cross over(bearish crossover)

When the MACD line is cross over down-up, it is a signal for buying-positive cross over-BULLISH TREND. When the MACD line is cross over up-down, it is a signal for selling-negative cross over-BEARISH TREND.

In MACD Why is the zero line important?

When positive crossover created upside of zero line and positive crossover created in downside of zero line and after both lines going the upside of zero line -STRONG BULLISH TREND. When negative crossover created downside of zero line and negative crossover created in upside of zero line and after both lines going the downside of zero line -STRONG BEARISH TREND.

Note: When a positive crossover is created in the downside of zero line it is not a strong bullish trend then both lines cross over upside it is a strong bullish trend. If the both line is not cross over-wishaw. When negative crossover is created in the upside of zero line it is not a strong bearish trend, then both lines cross over downside it is a strong bearish trend. If the both line is not cross over-wishaw.

MACD indicator double top and double bottom

When MACD is created a double top in upside of zero line then more chances to trend reversal. When MACD is created a double bottom in downside of zero line then more chances to trend reversal.

How does MACD-histogram help?

MACD-histogram shows a trend and momentum in the positive divergence(trend strength) and negative(trend weakness) divergence. HISTOGRAMS DIVERGENCE-(1)histogram positive divergence(2)histogram negative divergence.

(1)histogram positive divergence-then price goes down, MACD goes down, but histogram will go up it is signal of bullish.

(2)histogram negative divergence-then price go up, MACD go up, but histogram will be going down it is sign of be

MACD divergence:(1)positive divergence(bullish divergence)(2)negative(bearish divergence)

 (1)positive divergence(bullish divergence):-when price will move in downside and MACD gives a signal of up movement it is signal of positive divergence.

  (2)negative(bearish divergence):-when price will move in upside and MACD gives a signal of down movement, it is a signal of negative divergence.

How does MACD help in buying and selling?     

(1)when MACD line is cross over down-up, it is signal for buying-positive cross over-buying signal 

(2)when a MACD line is cross over up-down, it is a signal for selling-negative cross over-selling signal.

Note: when MACD is created a double top in upside of zero line then more chances to trend reversal. When MACD is created a double bottom in downside of zero line then more chances to trend reversal

HISTOGRAMS DIVERGENCE-(1)histogram positive divergence(2)histogram negative divergence.

(1)histogram positive divergence-buy

(2)histogram negative divergence-sell.

Continue reading

Full information on Volume profile indicator

What is the volume profile indicator? 

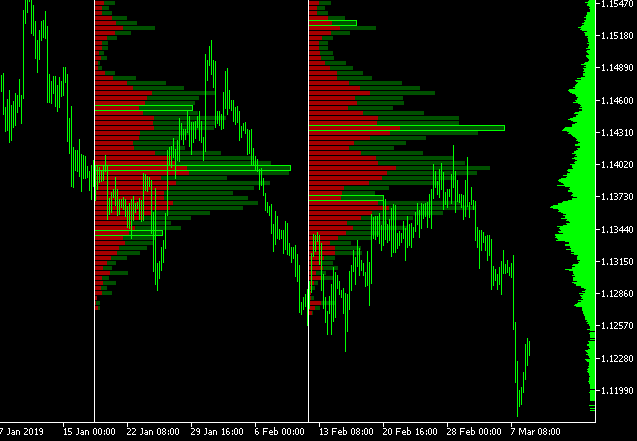
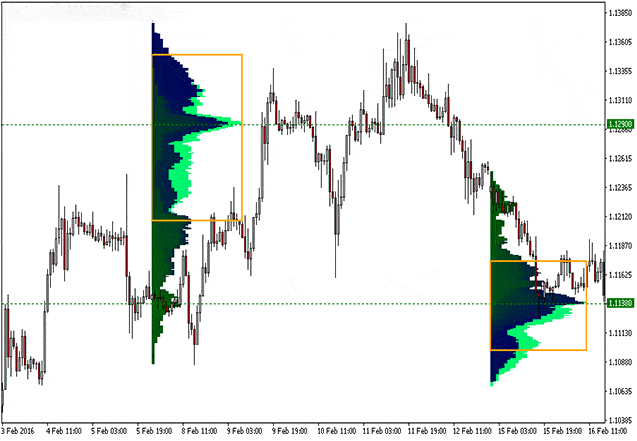
Volume profile is a charting feature that shows the traded volume amount of an asset, over a specified period at certain levels’ volume profile shows this data as a histogram in a y-axis next to price levels

Volume profile uses the past traded volume and all the strategies and plans are coming from historical data.

How are these volume profile bars created? 

It takes total volume traded at a price, in a specific time period, and divides total buys and sell volumes and shows it on a histogram chart.

Traders can understand and use these volume profile indicators as the most powerful tools in their trading.

Different types of volume profile:There are three different types of volume profile. These types are not so much different in what they do. Their difference is how they show on your chart and the exact time period you want to see

Visible range(vpvr) volume profile visible tool that everyone uses it comes next to price level as a histogram Vpvr automatically shows the volume traded in the price level from the candles shown on the screen. If you charge or go back and forth in your price actions time period, the volume profile visible range will change

Fixed range volume profile fixed range is the exact same volume profile with a minor difference. 

When you want to see the traded volume in a time period of price action such as an uptrend or downtrend, you can define the start and end point and see the volume profile only for that time period. 

The benefits of using vpfr is that the volume profile Will not change by scrolling in the chart, and it always shows the traded volume in the price levels only for a selected amount vof candle.

Session volume (vpsv) Volume profile session volume shows the volume profile for all sessions shown on a chart. 

You see a divided volume profile for each session presenting on the chart. Each session is considered a day, and it is the same with the change time period of the charts. 

What is volume profile strategy?

The volume profile strategy is basically a study of the volume based on price. This is a bit different compared to the regular volume bars. This is then categorized into the buy volume or sell volume and makes this information available visually as it is plotted on a histogram on the y-axis.The longer horizontal volume bars are the ones of interest. These bars represent the price where there is the highest amount of volume. 

Value area: The value area is basically the percentage of all the volume that is traded. The default setting for the market profile indicator is 70%. The value of 70% is based on the normal distribution curve.

Continue reading

How to trade using RSI Indicator a tool?

RSI-relative strength index

   “Inventor-j.welles wilder,jr, invented in 1978”

What is Relative Strength Index (RSI)?

Relative Strength Index (RSI) is a momentum oscillator, Measuring the velocity and magnitude of direction of price movements. Momentum is the rate of the rise or fall price in RSI. It is used in computer momentum. The relative strength index was developed by j. Wellles Wilder and published in a 1978 book.

Bifurcation:

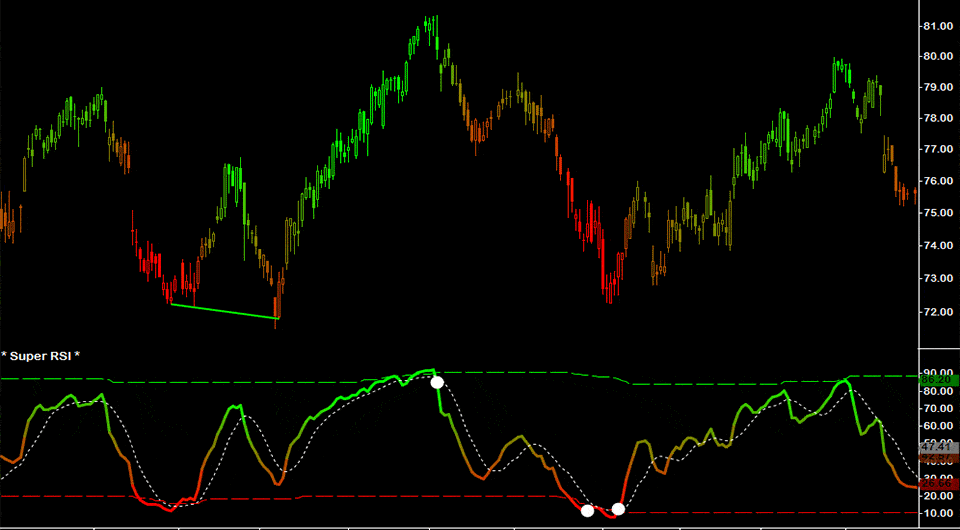
Bearish divergence occurs when price makes a new high but the RSI makes a lower high, thus failing to confirm. Bullish divergence occurs when price makes a new low but RSI makes a higher low.

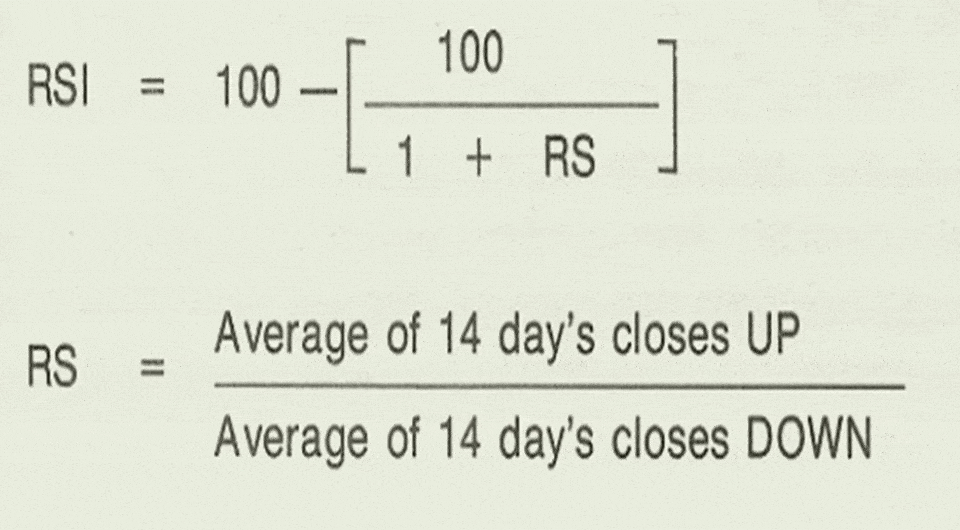
How to calculate RSI? 

The smoothed moving averages should be appropriately initialized with a simple moving average.

How does RSI help in trading? 

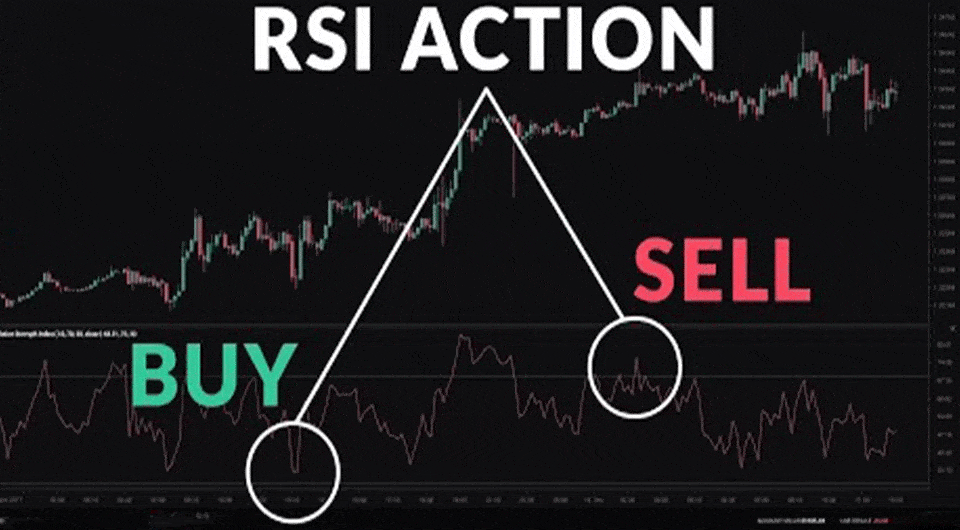
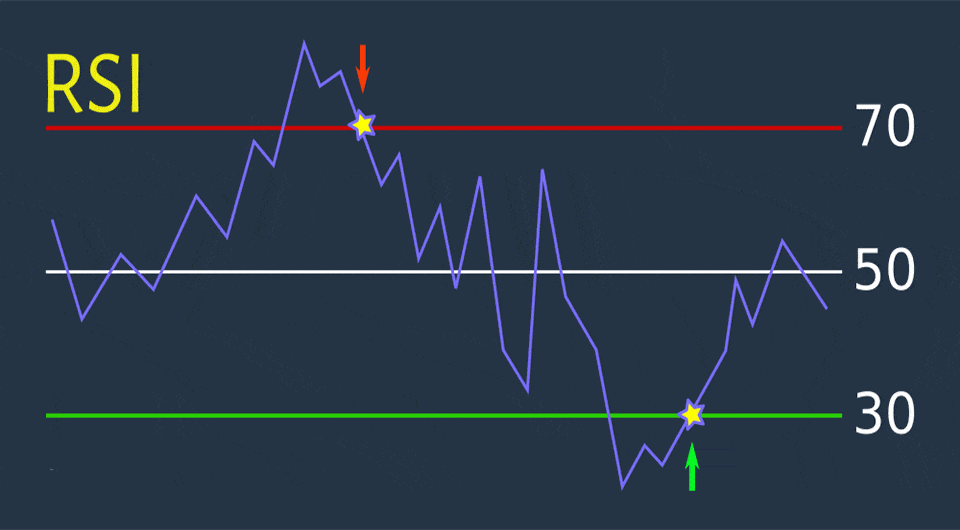
The price oscillates between 0 and 100, traditionally the RSI is considered overbought when above 70 and over sold when below 30.

  When indicators start going above 70, then it’s called the market overbought, and it signals for the sell.

   When indicators start going below 30 , then it’s called the market oversold, and it’s a signal for buy.

Uptrend and downtrends:

(1)RSI Bullish-indicators survive in the range of 50-100.

(2)RSI bearish-indicators survive in the range of 0-50.

(3)RSI sideways-when indicators survive around 50,minor momentum

  Indicators pattern-double top and bottom double:

Whenever an indicator creates a double top in the range of 70-100,then is the signal of strong reversal.

Whenever an indicator creates a double bottom in the range of 0-30,then is the signal of a strong reversal.

Continue reading

Five Tips to Improve Your Stock Trading Mindset

Stock Trading Mindset TipsYou need to have a certain quality and have the right mentality to become an expert in stock trading. You not only need to overcome nature-to learn about stock trading, but you also need to overcome yourself-to overcome innate psychological obstacles such as deep-rooted fear, hope and greed, and gradually develop the right attitude.

So, what is the right mindset to improve stock trading? Follow these five steps to win:

Continue reading

8 Tips to Manage Your Small Business Effectively

manage small businessEvery business owner wants to be successful. Properly managing your business and finances is a key to business success. For massive growth and higher productivity, your business should be well-organized.

Check out the top ways that can transform your office into an efficient workplace:

Continue reading