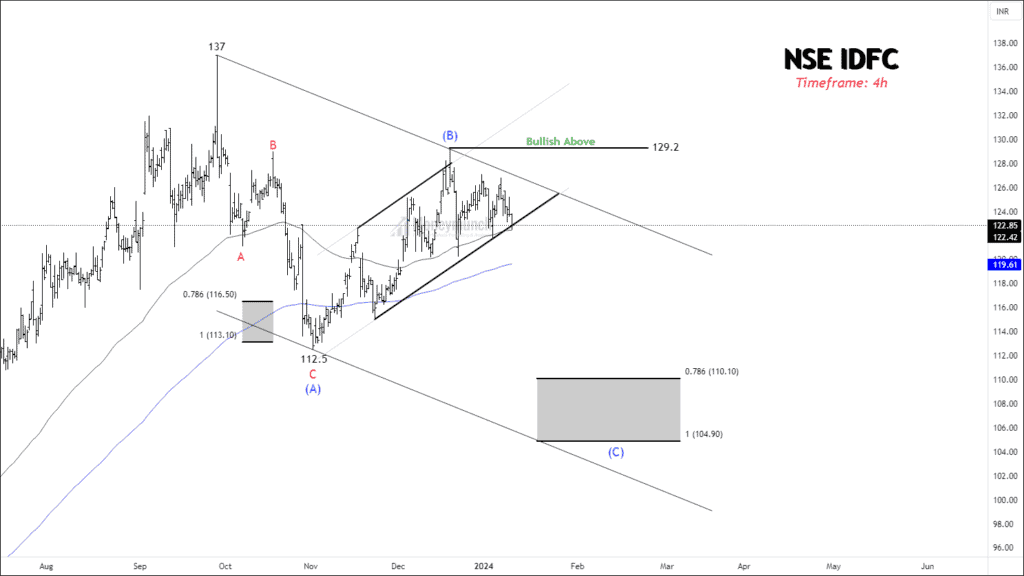
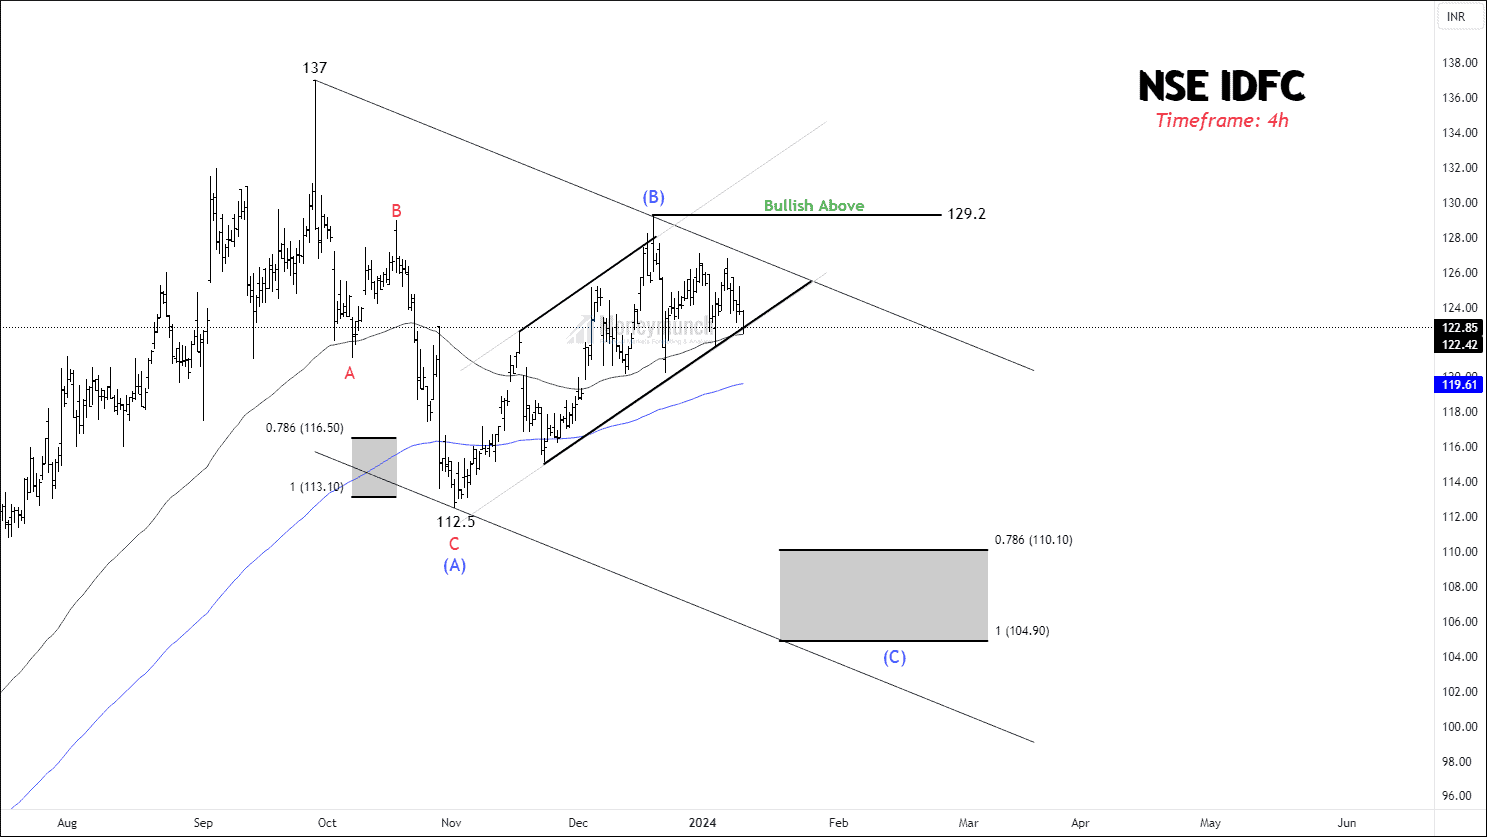
Timeframe: 4h
NSE IDFC has made a high of 137 and started falling to correct the impulse. The RSI of the price is 42.48, and a bearish divergence is visible on the 4-hour chart. ATR of the price is 1.68.
The angle from 112.5 to 129.2 looks bearish. If the price breaks down the lower band of Channel (B), traders can short for the following targets: 119 – 115 – 110+. Wave (C) can be equal to wave (A) at 104.9, where wave (C) = Wave (A). Please be aware that the bulls will have control over the breakout of the major A-B-C channel, and it is important to establish an invalidation point above wave (B).
We will update further information soon.
Get free important share market ideas on stocks & nifty tips chart setups, analysis for the upcoming session, and more by joining the below link: Stock Tips
Have you any questions/feedback about this article? Please leave your queries in the comment box for answers.


Great work
pls share nifty analysis and hul
Tnx for sharing