Build your knowledge and skills in investing with our comprehensive investor training. Learn the fundamentals of investing, portfolio management, risk assessment, and more with our expert guidance.
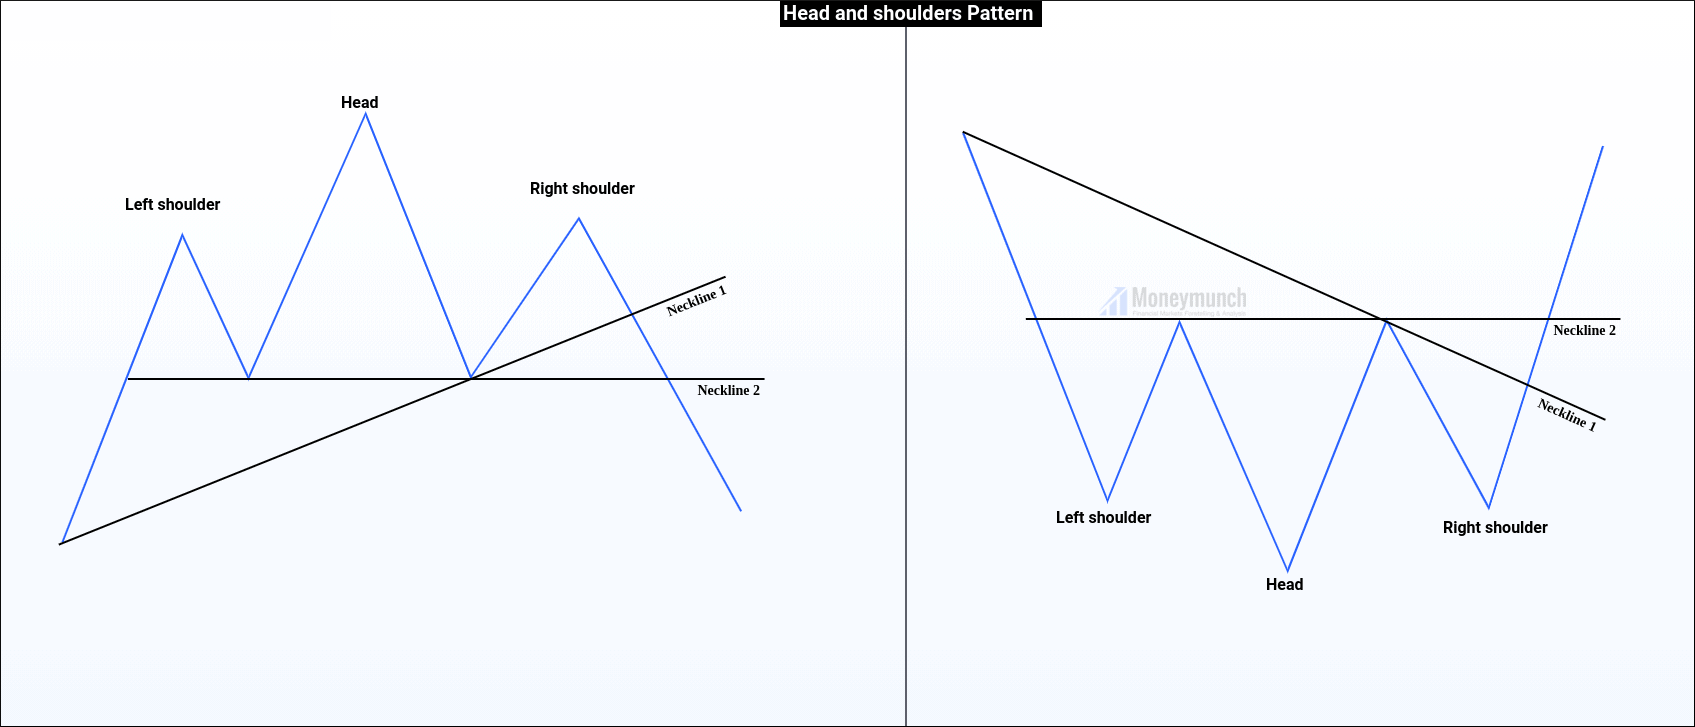
We can count waves using traditional patterns like Head and shoulders , Double Top and Bottom, Triangle, cup & handle, etc. This article is about how you can count waves by identifying chart patterns.
I have covered Three chart patterns in this article, 1) Triangles 2) Head and shoulders 3) Double Top and Bottom
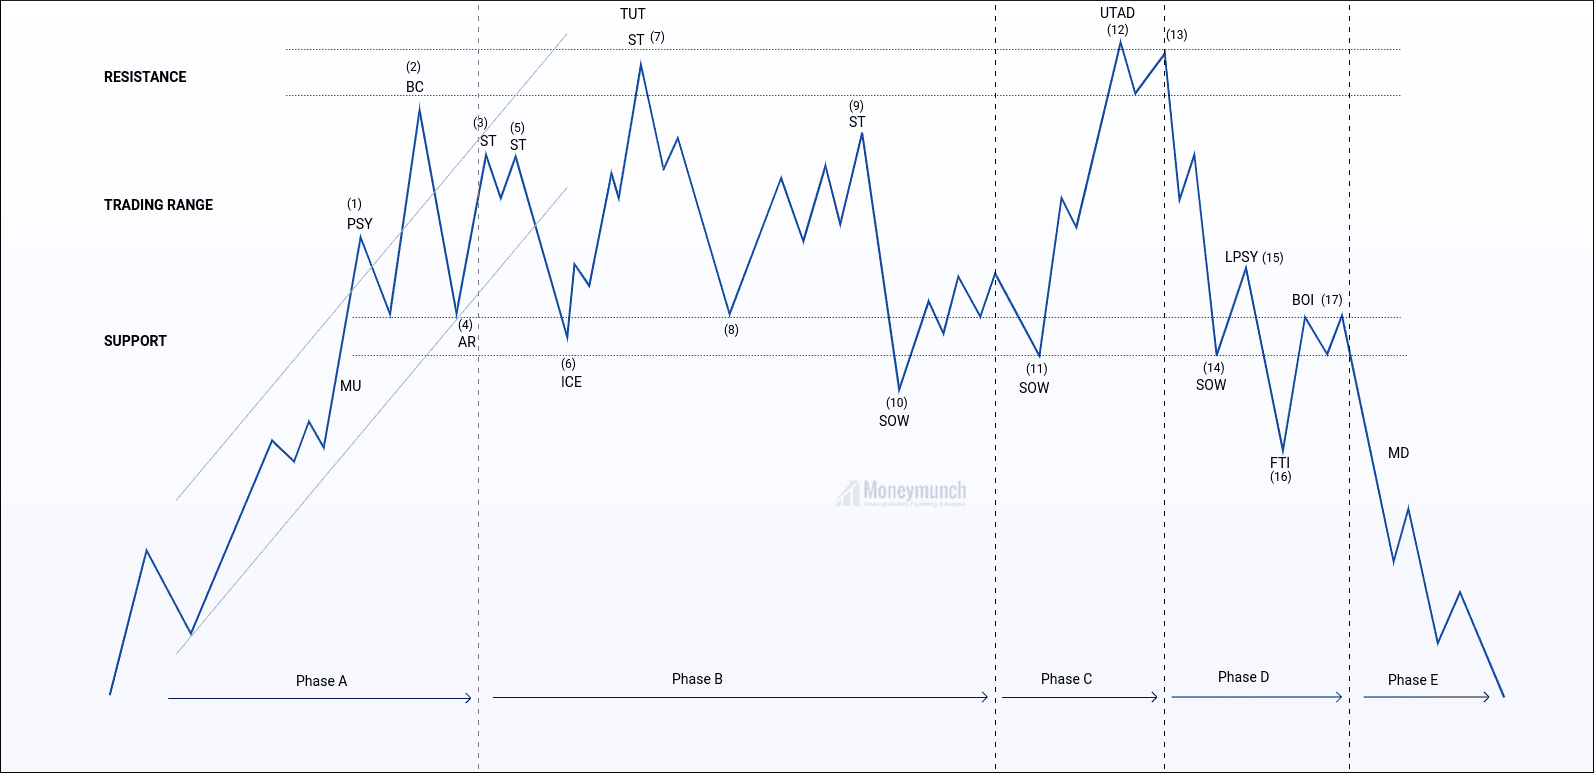
Wyckoff was a pioneer in the technical analysis of the stock market in the early 20th century. He established the Stock Market Academy in 1930. The main course is to introduce how to identify the dealer’s process of collecting chips and the process of distributing chips/judge. Second and third, in the basic law of “causality”, the horizontal P&F count within the trading range represents the cause, and the subsequent price changes represent the result.
Fourth, fifth, the relationship between price and volume on the candlestick chart to analyze the relationship between supply and demand. This law sounds simple, but it takes a long time to practice in order to accurately grasp the volume and price. I heard that Wall Street financial institutions are using Wyckoff’s trading method to judge the trend of the stock market and look for opportunities. So what exactly is Wyckoff’s theory? Today, I will introduce to you the famous Wyckoff transaction method.
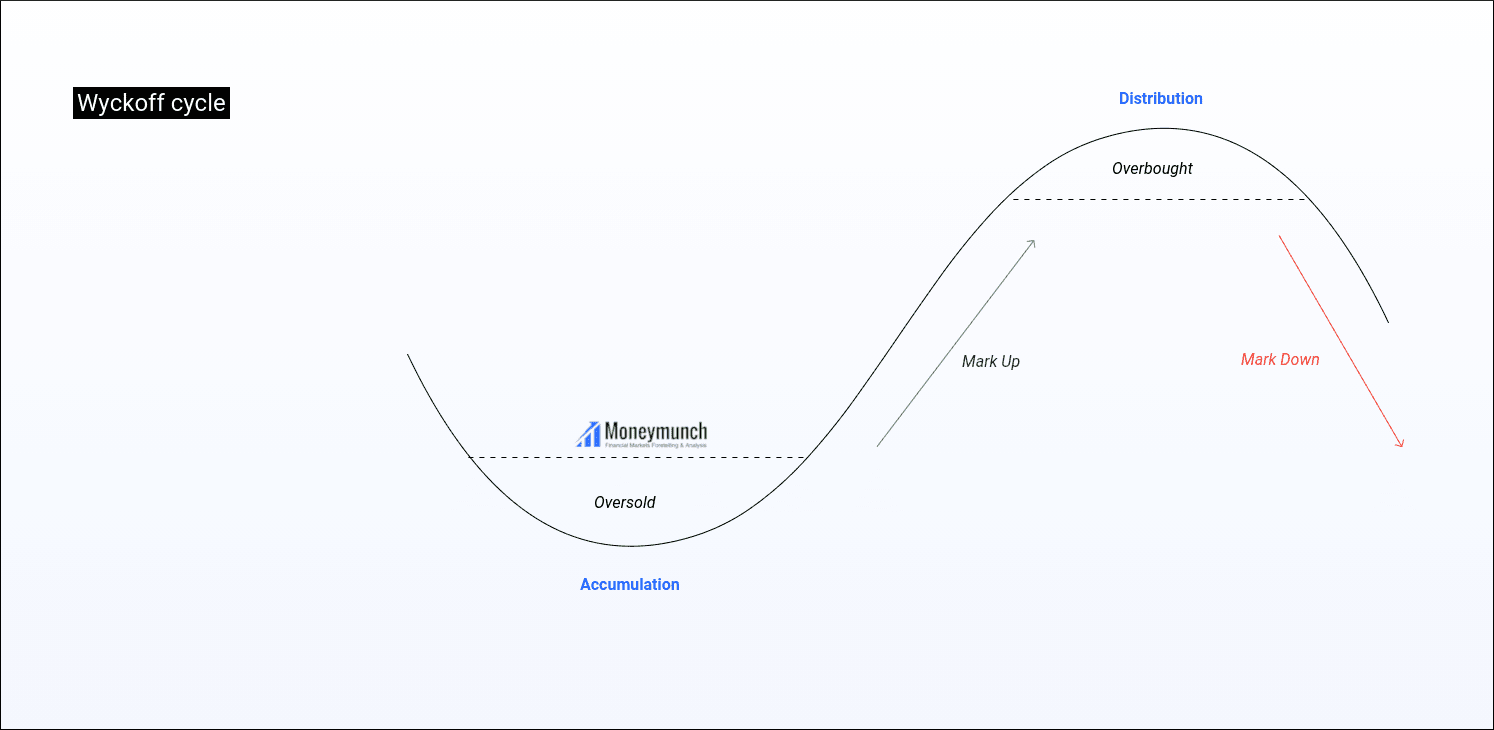
The background of the birth of Wyckoff theory
Wyckoff’s theory was proposed by Richard Wyckoff. He was a pioneer in the technical analysis of the stock market in the early 20th century. He and Dow Jones, Gunn, Elliott, and Merrill Lynch are considered the five giants of technical analysis.
Wyckoff is good at summarizing his years of failures in stock investment, and is committed to introducing individual investors to the rules of the game in the market and the impact of large funds behind them.
In 1930, he established the Stock Market Academy. The main course is to introduce how to identify the dealer’s process of collecting chips and the process of distributing chips. Till, there are still many professional traders and institutional investors applying Wyckoff’s method.
Two Five Steps of Wyckoff Analysis
(1) Determine the current state of the market and possible future trends. Judging the current market trends and future trends can help us decide whether to enter the market and go long or short.
(2) Choose stocks that are consistent with market trends. In an uptrend, choose stocks that are trending stronger than the market. In a downtrend, choose stocks that are weaker than the market.
(3) Choose stocks whose “reason” equals or exceeds your minimum target. An important part of Wyckoff’s trading selection and management is his unique method of using long-term and short-term trading point forecasts to determine price targets.
In Wyckoff’s basic law of “causality”, the horizontal P&F count within the trading range represents the cause, and subsequent price changes represent the result.
(4) Make sure that the stock is ready to move.
(5) When the stock market index reverses, there must be contingency measures Three-quarters of the stocks are moving in line with the market. Grasping the market trends can increase the success rate of transactions.
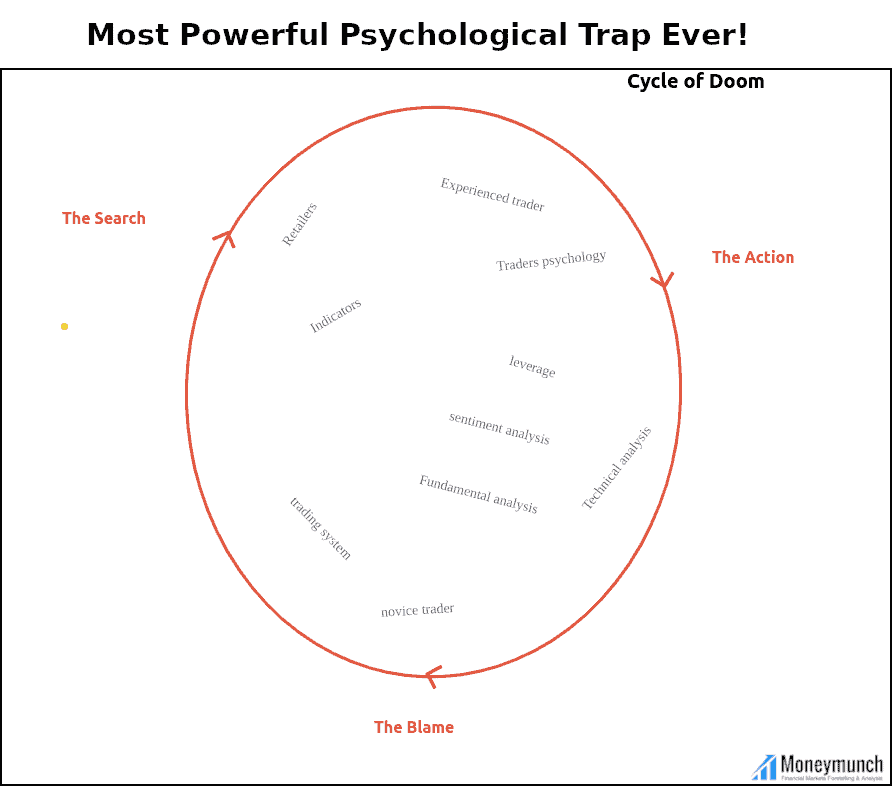
You need to have a certain quality and have the right mentality to become an expert in stock trading. You not only need to overcome nature-to learn about stock trading, but you also need to overcome yourself-to overcome innate psychological obstacles such as deep-rooted fear, hope and greed, and gradually develop the right attitude.
So, what is the right mindset to improve stock trading?Follow these five steps to win:
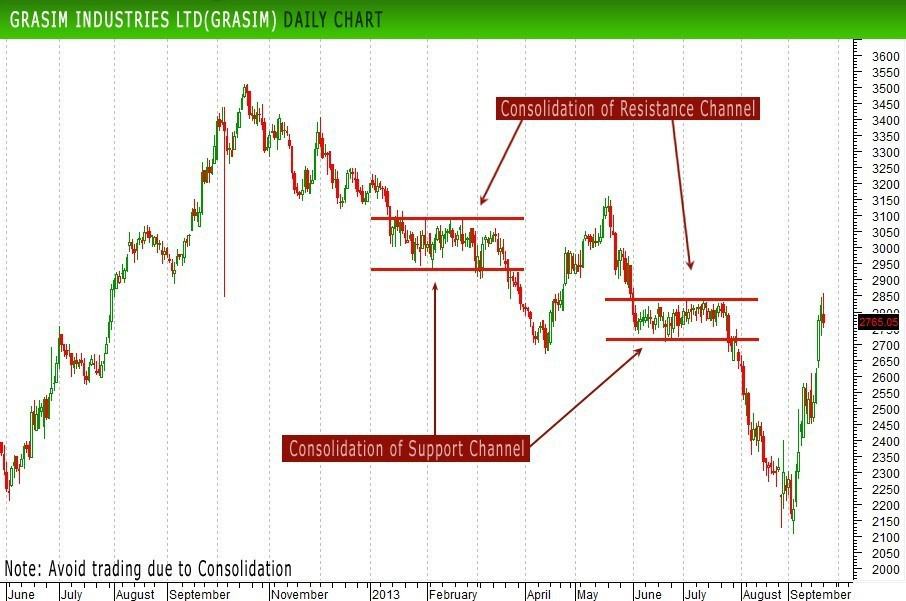
You can earn Money in trading is made from finding an important trend of market. Losing Money in trading happens by missing or staying on the incorrect side of trends. Therefore, the Real Question is how do we guard and maintain our trading capital … herein one of parts which is called ‘Consolidation market’ OR “Choppy market”
Meaning of ‘Consolidation’ OR “Choppy”
Simply, Consolidation is known as trade in range which not crossing or breaking range. The fluctuations of an stock’s price inside a clear pattern or boundary of trading levels, called as ‘Consolidation OR Choppy’ In technical analysis. Choppy level of stock price is commonly known as a period of unpredictable , which ends when the price of the stock cracks the limited boundaries. Periods of Choppy market are known in charts covering when time interval.
Lots of traders are making more money whenever his or her setups happen, then again give their profits made into losses whenever the market runs towards CONSOLIDATION OR CHOPPY secessions, aren’t they?
Now, if you find Choppy secession of market, this information will keep you in Profit and you became one of Profitable Traders.
Yup, Choppy markets chop up your profits. Occasionally understanding whenever do not to trade is really as worthwhile as knowing whenever to trade.
Understanding your trading plans and trade and whenever to trade is your “offense.” Understanding whenever do not to take your trading plan is your “defense.”
To winnings at the trading game, one need both a Good offense and a Good defense.
[sws_pullquote_left]But, simply as notable, it also shows you how to predict the end of choppy conditions and the beginning of new trends … therefore getting you early into new megatrends! [/sws_pullquote_left]
As I properly describe it, this one is likely to be the best you can change to create trading strategy for the coming major opportunities in stock market. Lots of traders study about a trading technique by reading a book or purchasing a trading system, …
Can you be sure if the technique will really work for you. Do you jump right in to the market with real rupees and start trading away? .
Some traders perform, and that is an costly way to learn that a system is not for you. Initially, let’s review various of the key data tips that can be collected and calculated in the back test process.
Please, Comment here…!
If you don’t know how to trade and if you are not making money than trade with in our association to make money and learn free advance technique of stock market trading, Elliott wave, Fibonacci Ratio, Divergence, Chart pattern, option trading, Future trading for Intraday and Positional Trading and get exclusive recommendation or tips.
To become a subscriber, subscribe to our free newsletter services. Our service is free for all.
There is usually a surge of investors looking to make the most of tax-free investment. The stock market show’s huge gains. An increasing number of investor tempts to invest in equity, rather than the other alternative like money market instrument, so where should be invested what is safe or risky? But… but… but…Alas…! No answer for that but surely to stop you from making common Mistake usually an investor dose. Investor should be all time panic, should keep ass on fire or crossing the fingers after investment decision…nope just you need..! To take precaution of not repeating other’s mistake?
1) Decision of right price and right time when to invest?
Investing thrives on only one golden principle – buy low, sell high. Most new investors make mistakes in telling what is low and what is high, especially in a
m where decisions are based on various factors and technical parameters. Buyers buy at prices that they think is low enough – the same prices that seem high enough to the seller. Now, you can see that different conclusions can be drawn from the same market information. So, it’s very important that you study how to make decisions based in market parameters before jumping in. Before investing at all, you must know the right price for you to enter, the right time for you to invest, the amount of risk to take.
Buying an investment just because it is going up might sound silly but this is precisely what impulse investors do. Similarly, bargain hunting among shares or funds that have fallen heavily might seem tempting but quite often bad news begets more bad news – only buy in if you truly want to own it for the long term.
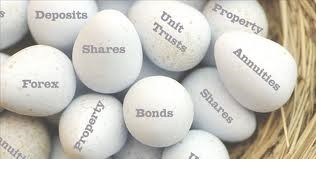
2) Putting all your eggs in one basket
Diversification is the best tool in investment and yeah all make most mistake here only
Another common investing mistake that beginners make is investing 100% of their money in a single type of asset. This is far from being a good decision. Most investors even go through the pain of investing in stocks in several industries and sectors. However, this is not true diversification because you are still focused on paper assets.
As a beginner, you should always commit less capital into any market you plan to invest in. This will help you study the market better with time. Once you have better knowledge of that market and you are more familiar with how things work, then you can afford to take bigger risks. To be truly diversified, you should invest in paper assets (stocks, bonds, insurance) and hard assets (Real estate, gold, businesses).
3) Falling in love with an investment
You might be stuck following a certain sports team for life but there is no need to become emotionally attached. same way I have seen investor investing in those company who’s product, service he avail or following there attachment .so being emotional regarding company is foolishness rather being practical regarding is your investment is smartwork so do smart trading rather being emotional fool
4) Not learning the basics
Learning new thing in life is best habit.” we know age is not bar for learning new thing be always on your toes & get update yourself”
You will find may self proclaimed investors who don’t understand basic investment terms like support and resistance, volume, P/E, market cap, all time high, 52 week high, stock index, all time low, and so on. Always take your time to learn and understand these basics. The more you understand them, the clearer it becomes to you that the market is very complex.
5) carving for quick gains
Most new investors enter into the market because they expect to start making huge profits within a few months. This desperation leads them to making many mistakes, which eventually force them out of the market.
In investing, there are no quick gains, as profits accumulate over a long time. This could be more than 20 years. In fact, to most experienced investors, a short-term investment is one that is set for less than 3-4 years. So, if you are finding a means to get rich overnight, don’t consider investing.
6) Being too short term
You should invest for a three to five year time horizon as a minimum – so there is no need to react to every market fluctuation. When constructing a portfolio it often makes sense to hold off buying. There is nothing wrong with dripping money into the markets or buying on the dips once your chosen investments have been identified.
7) fail to take opportunity’s
There is nothing wrong with banking a profit, especially if an investment exceeds your expectations. Use profits to diversify your portfolio or to rebalance it. Re-balancing or buying into areas that have been struggling recently is often known as contrarily investing. This style often needs patience to work but can be very rewarding, but as detailed above, don’t buy just because it has been a big falter
8) Not having enough time to monitor your investments properly
Usually a investor face the problem of monitoring there investment and so higher fund manager. But money is your concern and wealth so keep keen eye on you portfolio and check on it regularly
To have a portfolio of shares it is our view that you probably need at least 20 – so you will need a lot of time to monitor them. Funds need less monitoring, but you should certainly check them at least every six months.
9) Being afraid of making a mistake – and doing nothing
“Being conservative is a good attribute to possess,but you being among one of those people who don’t do anything at all. Even when opportunity knocks man still has to get up and answer the door.”
This is the most foolish behavior of any investor being afraid of mistake better not to invest and is often heard people saying stock market is speculation should not invest in stock market better to keep long in bank or post-office etc
10) Doubling up on risk
A common mistake is having too much of a portfolio facing in one direction. For instance investing in mining funds and Chinese equities may bizarrely offer little diversification. As the mining sector is dependent on Chinese growth it may mean the two rise and fall virtually in tandem. Similarly, owning funds which have big stakes in shares you already hold.


 Diversification is the best tool in investment and yeah all make most mistake here only