Discover our category for free expert commodity trading tips and insights on Indian MCX, NCDEX, and COMEX markets. Expand your knowledge with our collection of educational articles and research reports to enhance your trading skills.
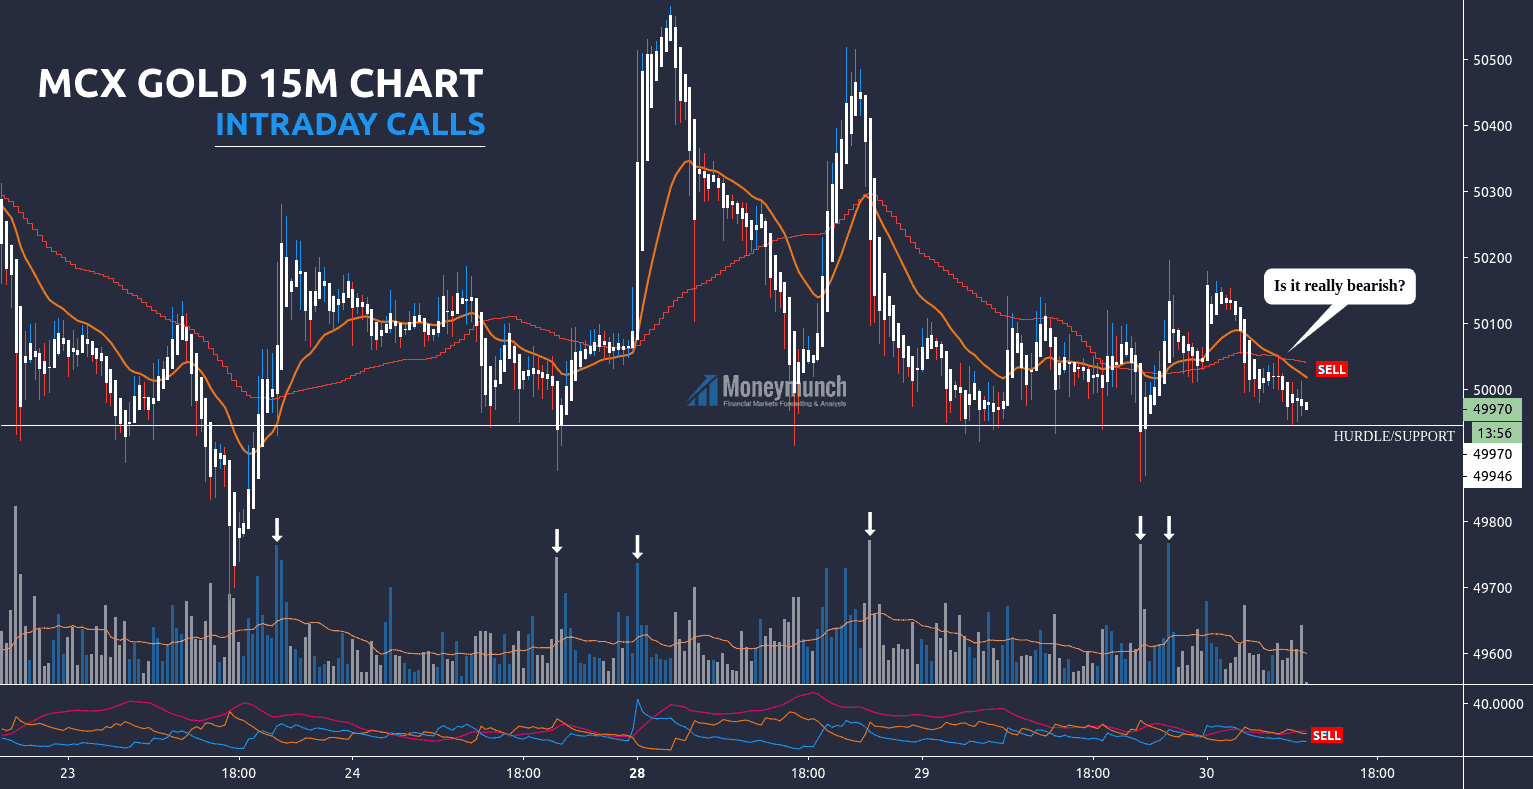
This is MCX Gold 15 minutes chart (Heikin Ashi). It is bouncing from the hurdle (support). And if we look at the Gold Spot, the RSI is bullish and calls for further upside. Hence, MCX traders can buy for the following targets: 50060 – 50120 – 50200.
According to MA, EMA, and DMI, it’s bearish. If it remains below to hurdle, intraday traders must sell it for the targets of 49860 – 49800.
To become a subscriber, subscribe to our free newsletter services. Our service is free for all.
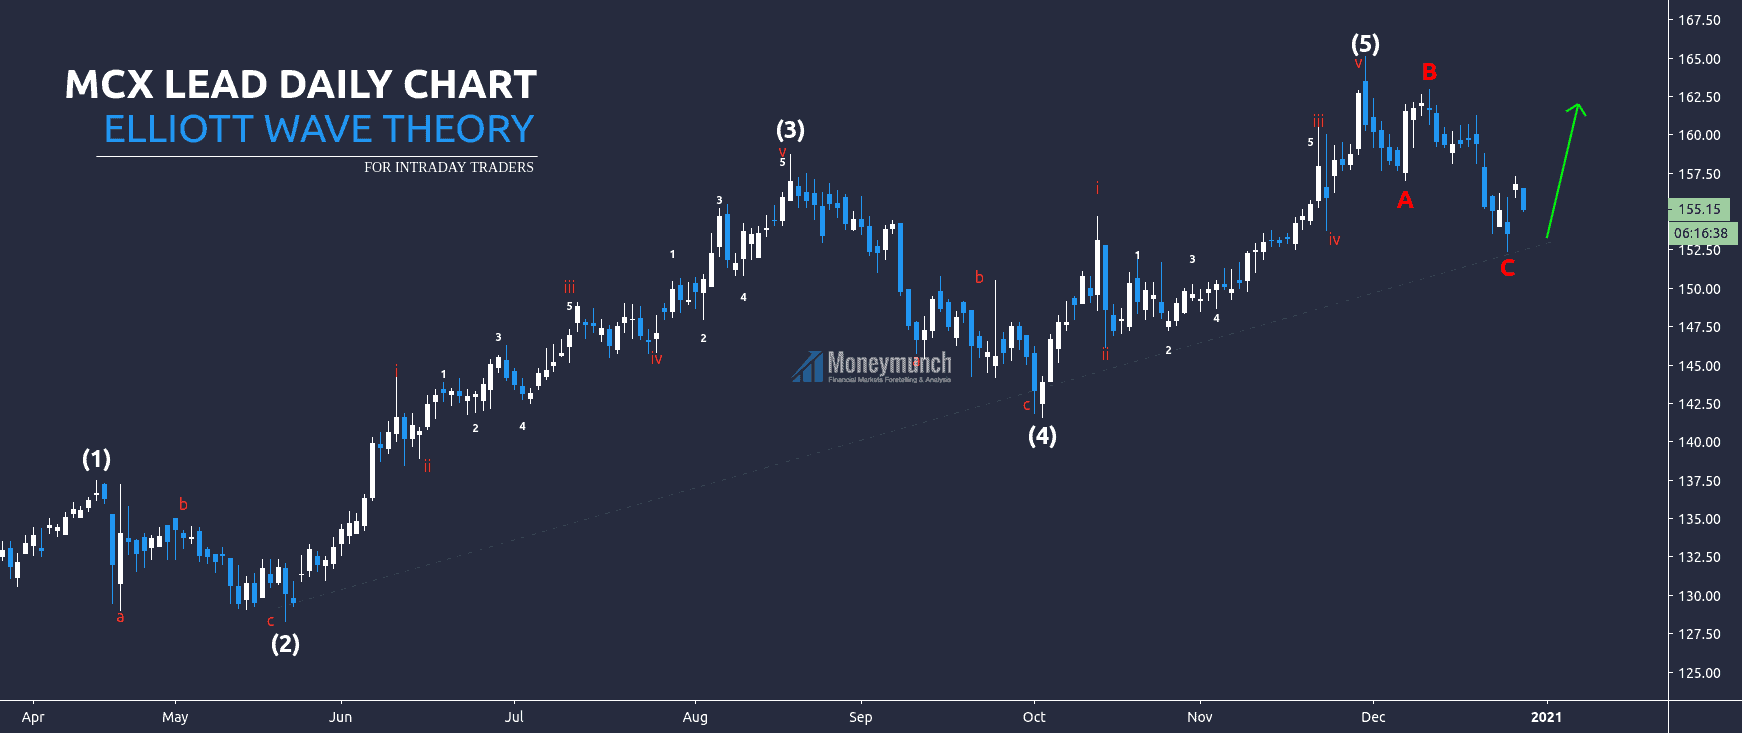
It’s the daily chart of the lead. Here, it has made the bullish Elliott pattern, and the ABC correction was completed on the 24th of December 2020. And right now, it started to move upside as per the rules of the bullish Elliott wave pattern. And it will move upwards till 158.6 – 162.
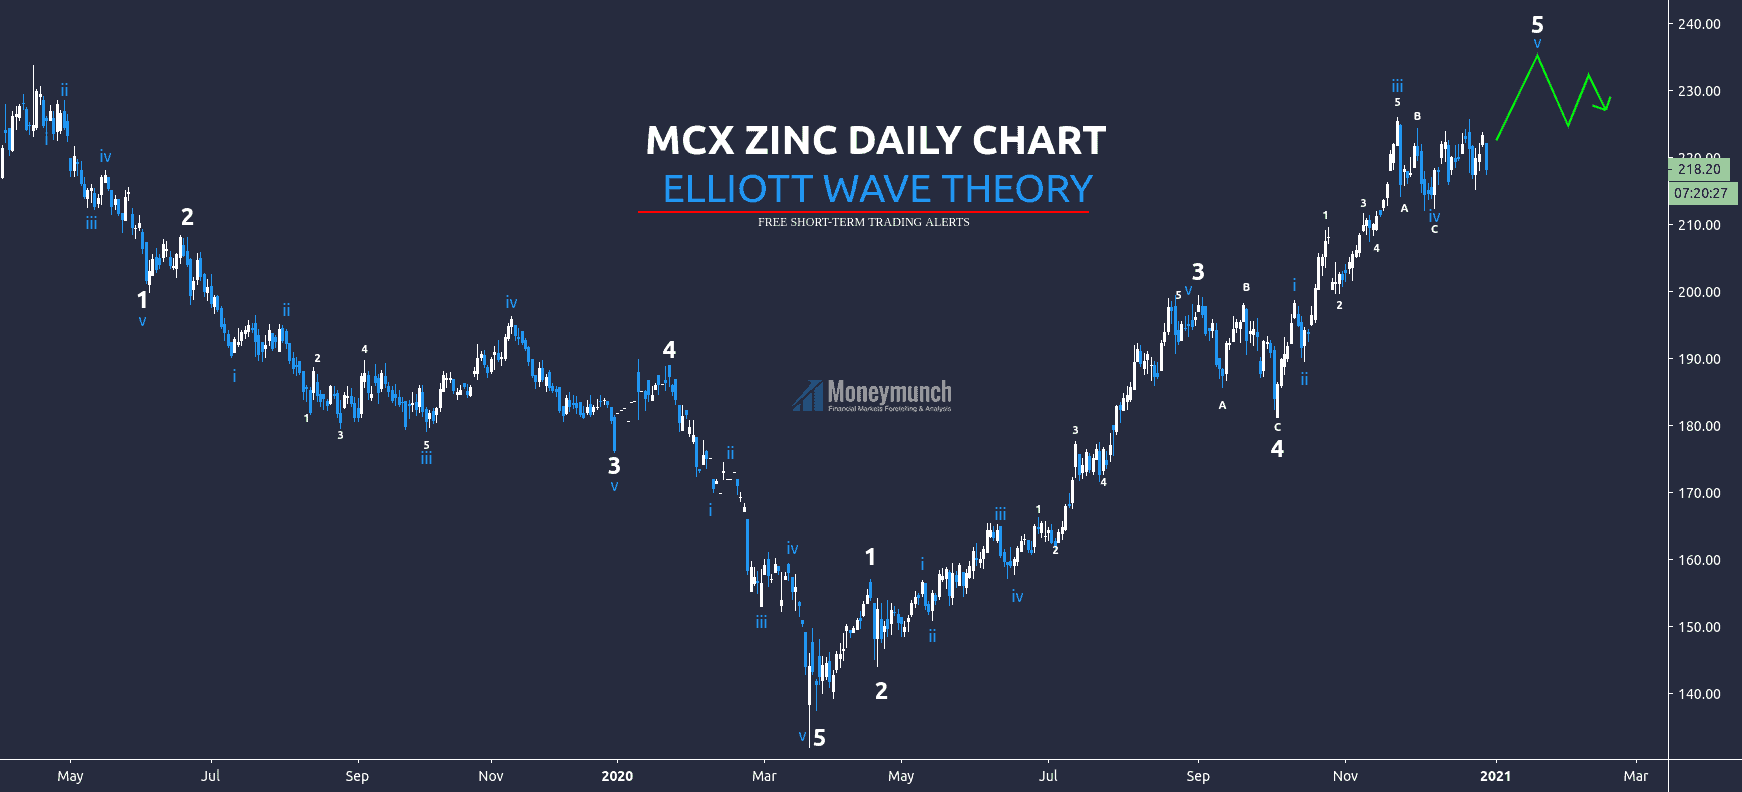
MCX Zinc Will Touch 240 by EWT
Here’s the daily chart of the MCX zinc. It has made two Elliott waves. The first one is bearish, and the second one is bullish. The bearish was started from the 11th of April 2019 and ended on the 19th of March 2020. The bullish one started on the 19th of March 2020, and the fifth wave of this Elliott wave is remaining. In the Elliott wave theory, each wave has five sub-waves.
Short-term investors can see the following levels soon: 228 – 234 – 240.
To become a subscriber, subscribe to our free newsletter services. Our service is free for all.
Unlock This Article
Only subscribers can read the full article. Please login to read the entire article.
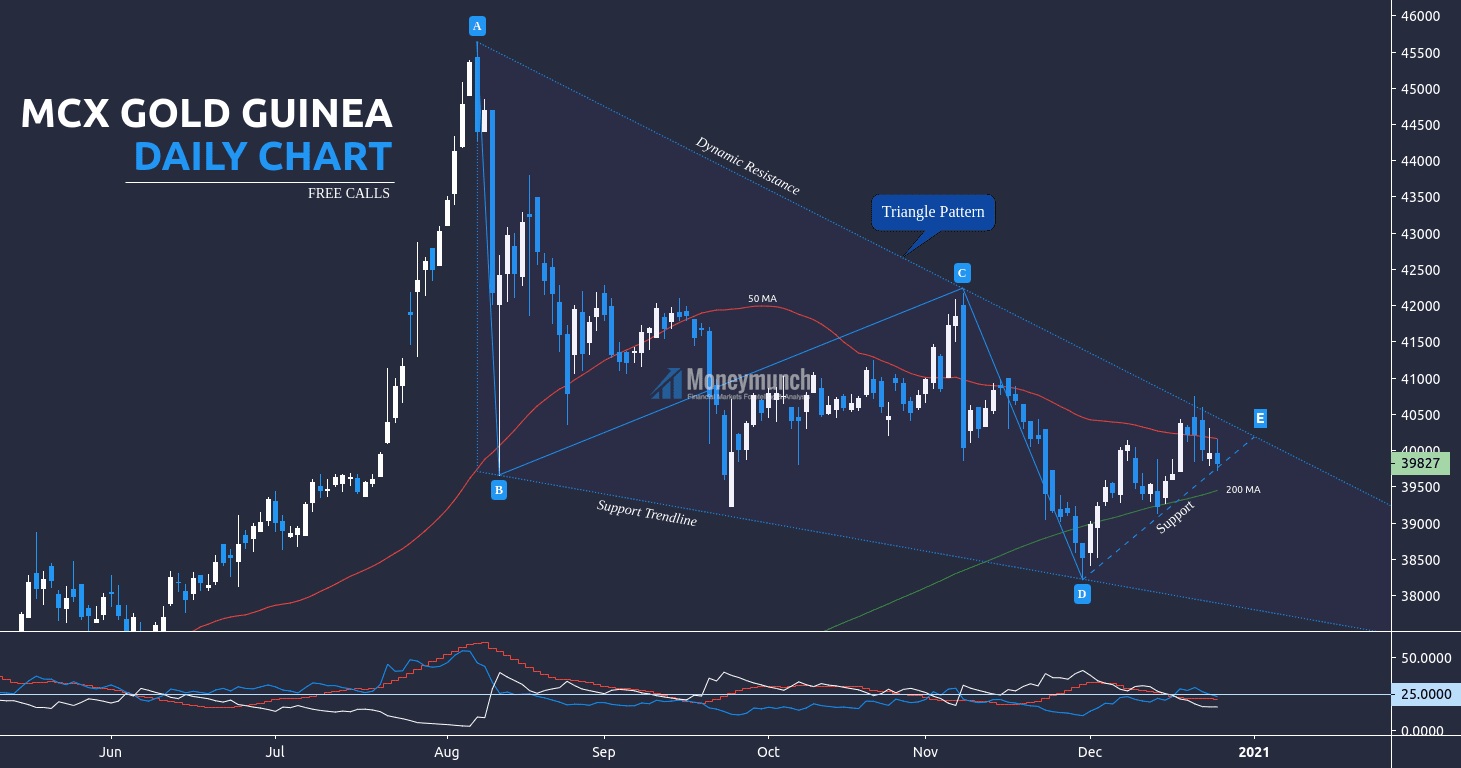
MCX Gold Guinea is making a triangle pattern. As per the ADX, the trend is weak and, +DI is above the -DI. That indicates an uptrend ahead. Additionally, 200 MA isn’t broken.
According to DMI & MA, we have chances to see 40260 – 40500+ levels.
But, if you look at the triangle pattern, it seems bearish. We have more chances to see downward (huge selling pressure) if it breaks the support line (dashed). And 50 MA is indicating the same.
Hence, once it breaks the support line, intraday traders can sell for the following targets: 39460 – 39260
To become a subscriber, subscribe to our free newsletter services. Our service is free for all.
Do you want to know where MCX Gold will go? Read Here →
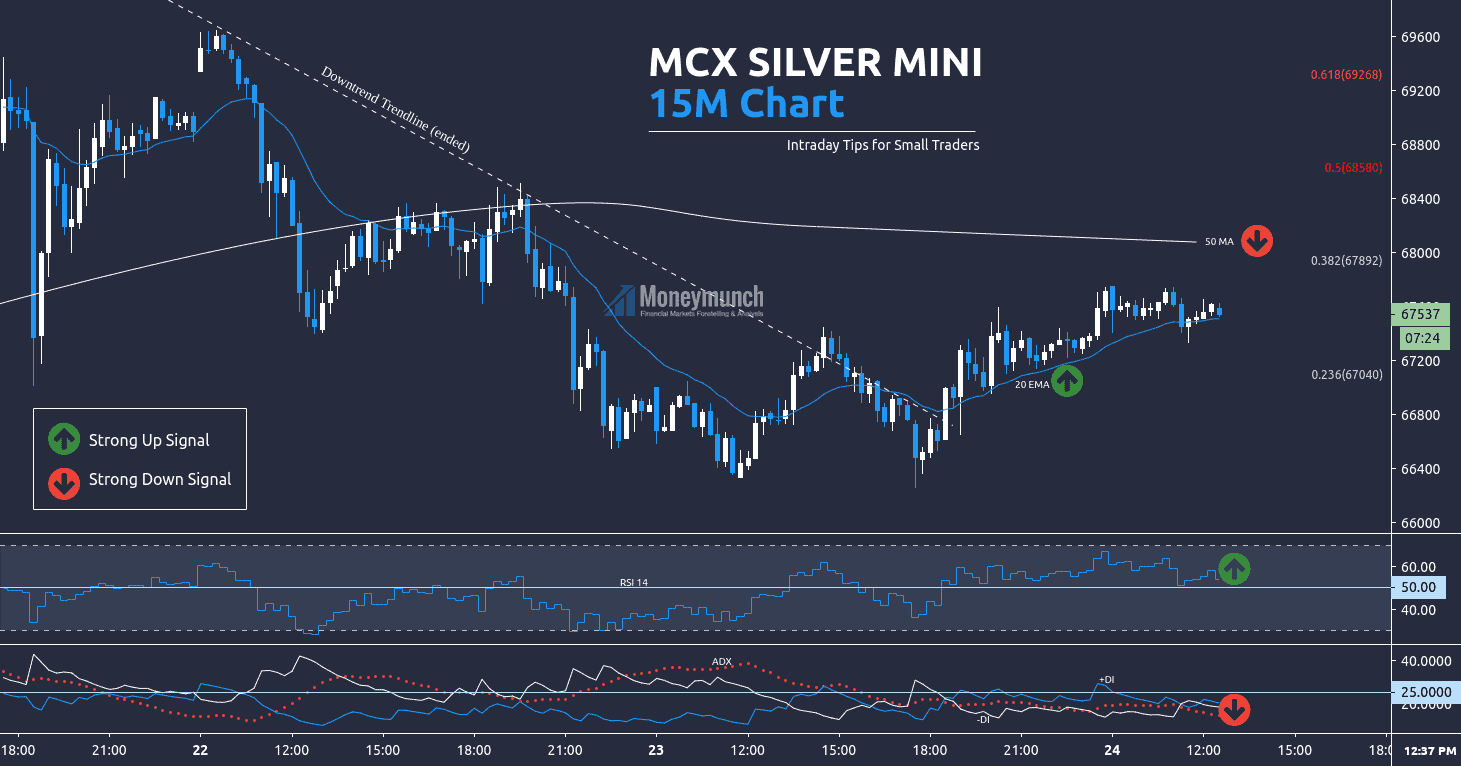
This is MCX Silver mini 15 minutes chart. I have used here moving average, Fibonacci, DMI, and RSI.
Fib Levels: T 71496 and B 65664
Silver will try to touch 0.382 (67892) from here. It will act as resistance. Moreover, there is a 50 MA. If silver breaks both, it will fly from there and touch, 68580 levels. Intraday traders can play between it.
But if it takes a U-turn from 50 MA and breaks the 20 EMA, be ready for the following targets: 67060 – 66600.
To become a subscriber, subscribe to our free newsletter services. Our service is free for all.
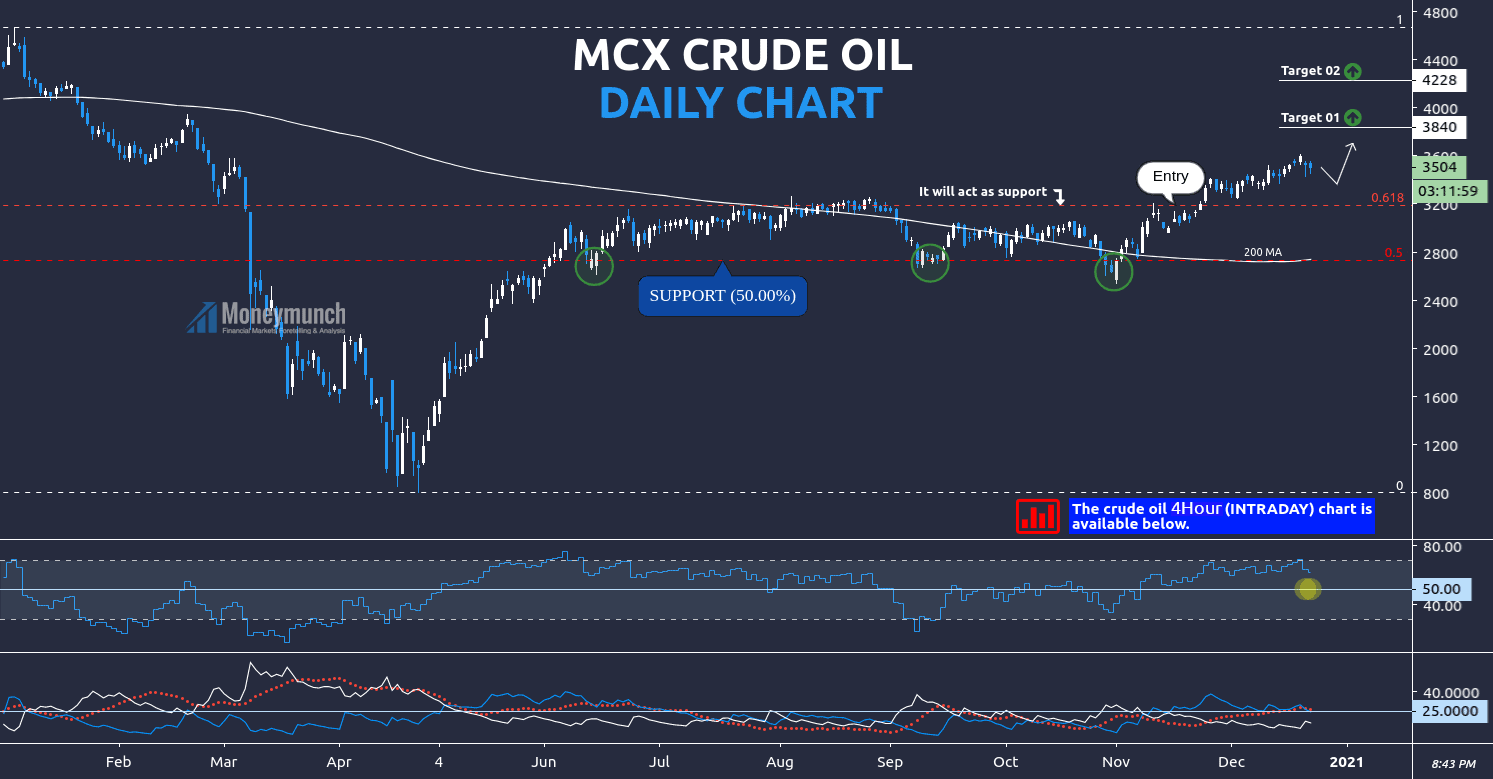
According to the daily chart of MCX crude oil, it is further advance for short-term investors. The retracement level of 0.618 is a perfect entry-level.
As per RSI & MA, it seems bullish . We will see soon target 1 and target 2 price after a short reversal.
But if you want to see a clear trend, we’d see it in a 4 hours chart:
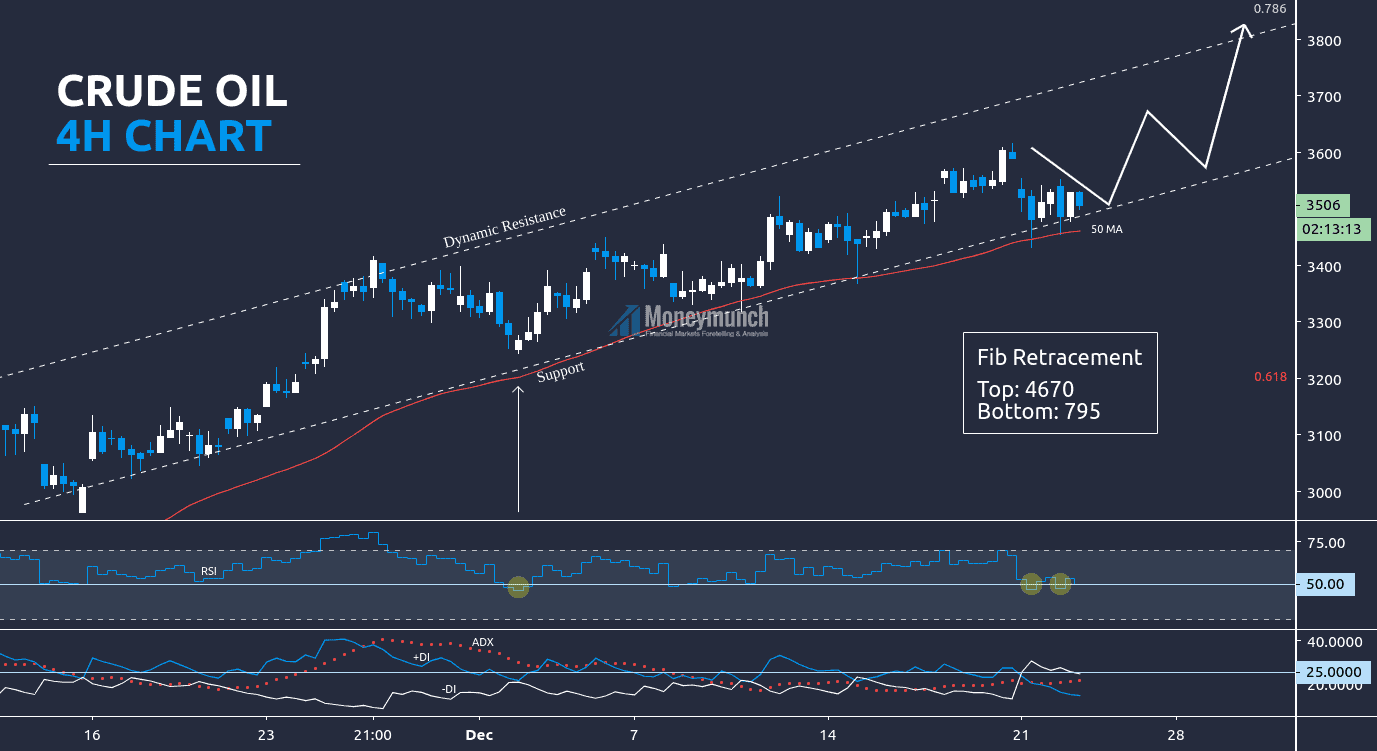
According to the 4H chart of MCX crude oil, it’s sharply moving upward. It’s safe for intraday & short-term traders to take a position nearby the support trendline or 50 MA for the targets of 3600 – 3660 – 3700 – 3800.
But what if it breaks the support trendline? DMI is indicating collapse ahead. How much crude oil can come down after breaking out the support trendline? To become a subscriber, subscribe to our free newsletter services. Our service is free for all.
Unlock This Article
Only subscribers can read the full article. Please login to read the entire article.
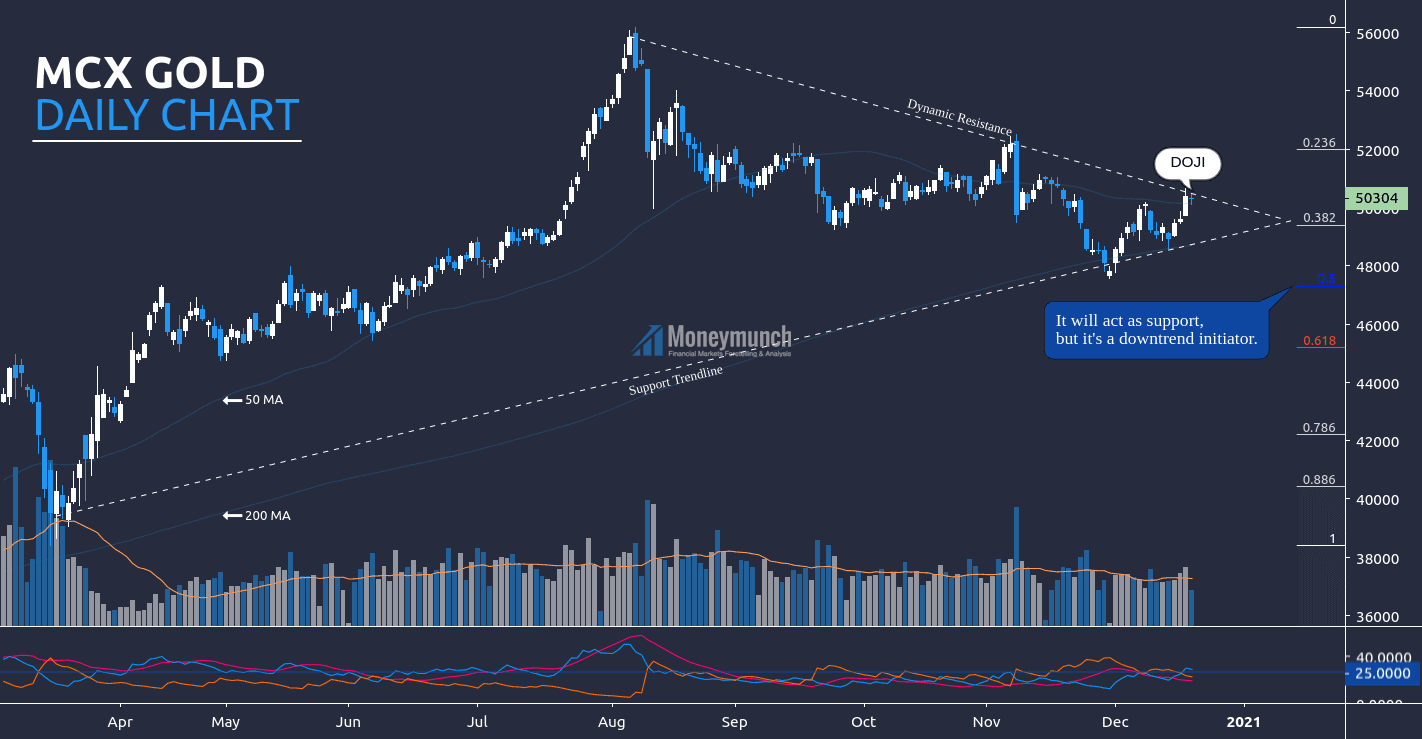
According to this chart, gold has started falling from August month. Doji appearing in the last trading session. It’s signaling a possible reversal. If gold follows the dynamic resistance, we may see a continuous downtrend. That can be up to 0.5 (47300) to 0.618 (45200) of Fib retracement.
Here’s ADX less than 25, and +DI is above the -DI . Additionally, 200 MA & 50 MA is throwing uptrend signals. If we follow the moving average, gold may try to hit 51000 – 51990 (0.236) levels.
Intraday traders should watch dynamic resistance before entering.
Silver Follow Up & Future Predictions For 2020 & 2021 – Part I
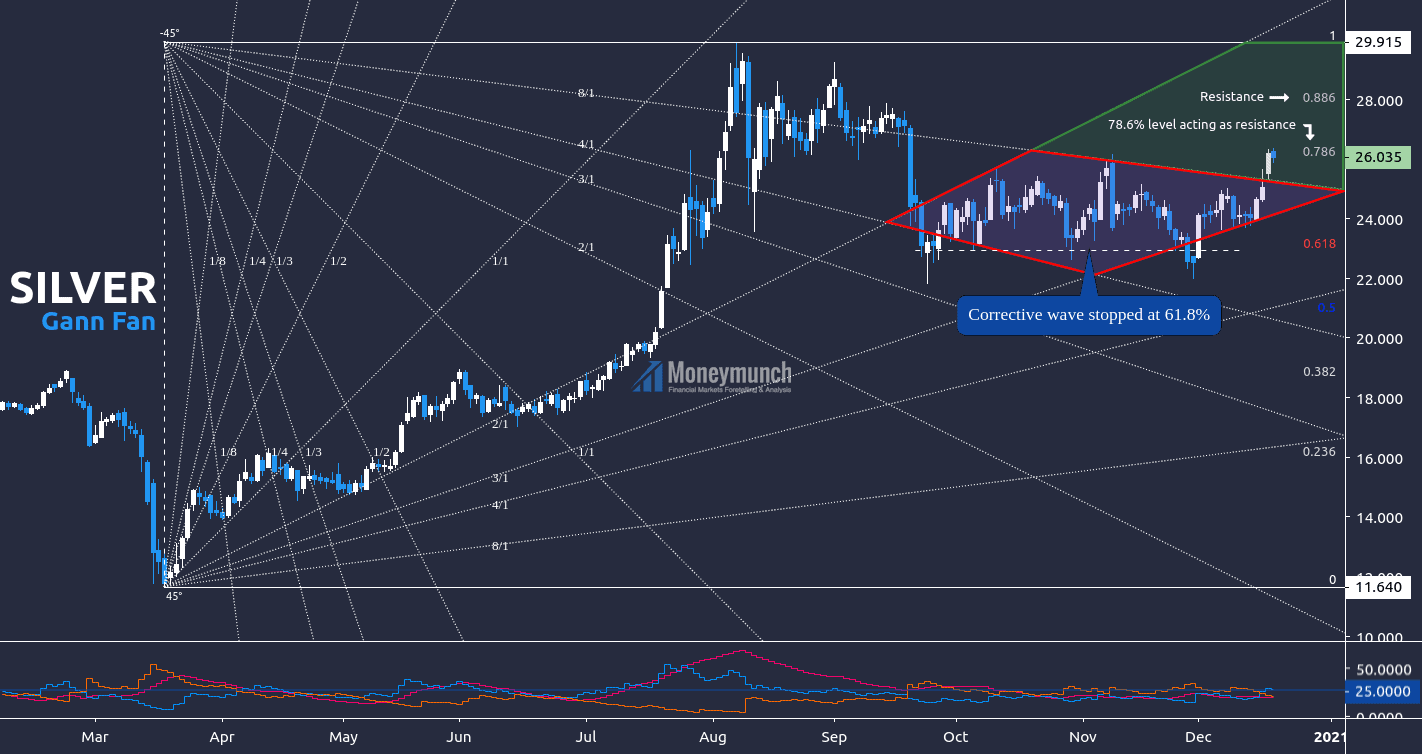
Here I have used Gann fan and Fibonacci on Silver sport to identify the current trend.
Fib Retracement: Top: $29.90 Bottom: $11.64
If silver remains above the 78.6% level, the target will be $27 – $27.8
And if it goes inside 8/1 or remains below 78.6% level, we will see the silver price at 0.618 value of fib retracement. The day traders can use the following levels as targets: $25 – $24 – $23
According to DMI, ADX is less than 25 but turning up. And +DI is signaling an upside rally. Technically, silver is a further advance.
For advance traders, watch significant releases or events that may affect the movement of gold , silver & crude oil: Monday, Dec 21, 2020:

 Unlock This Article