Update: Will Crude Oil Hit 5400 Next Weekend?
How many of you bought crude oil nearby 5130 after reading my article?
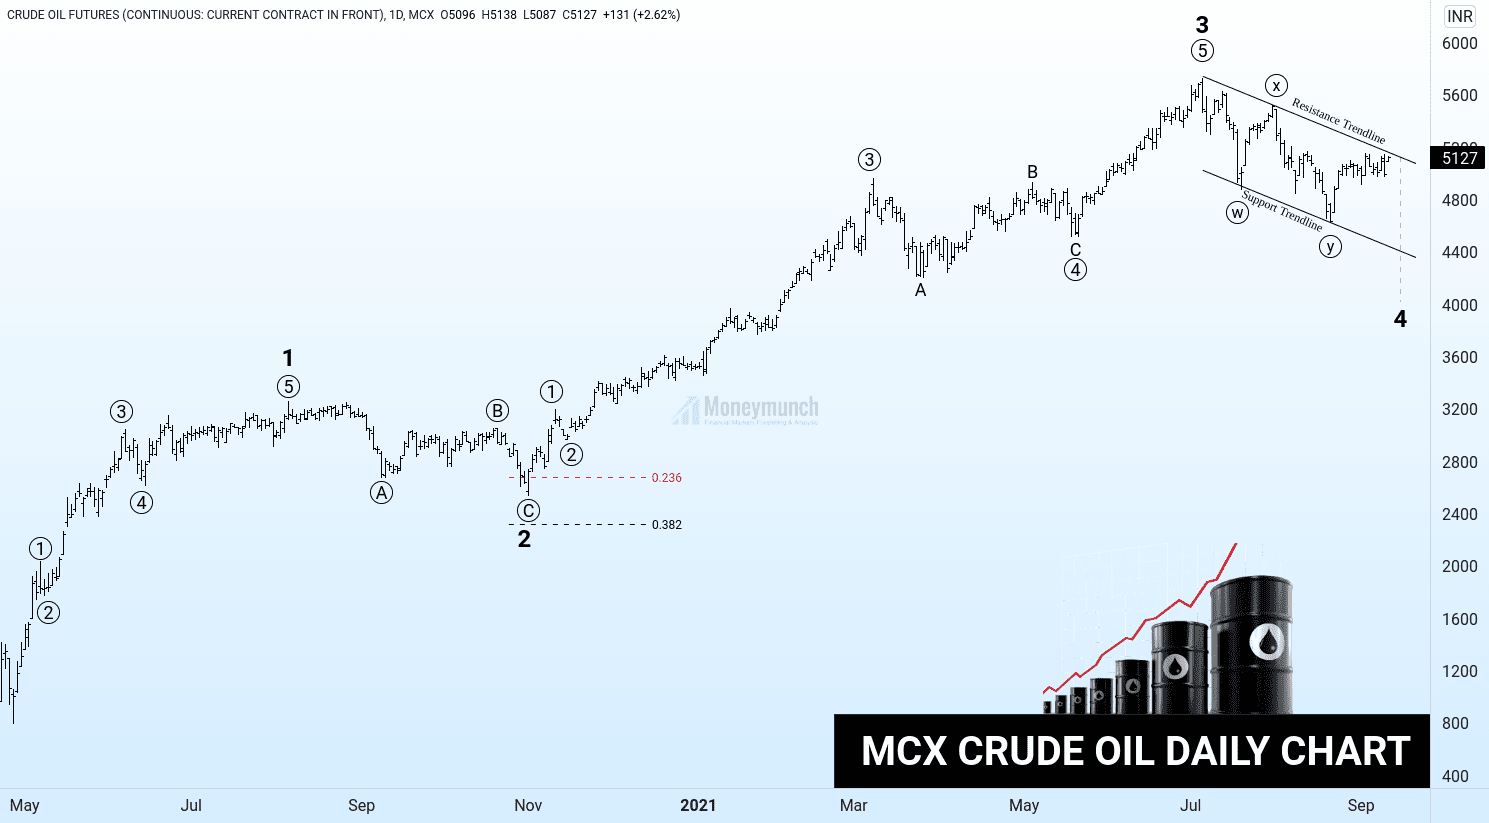
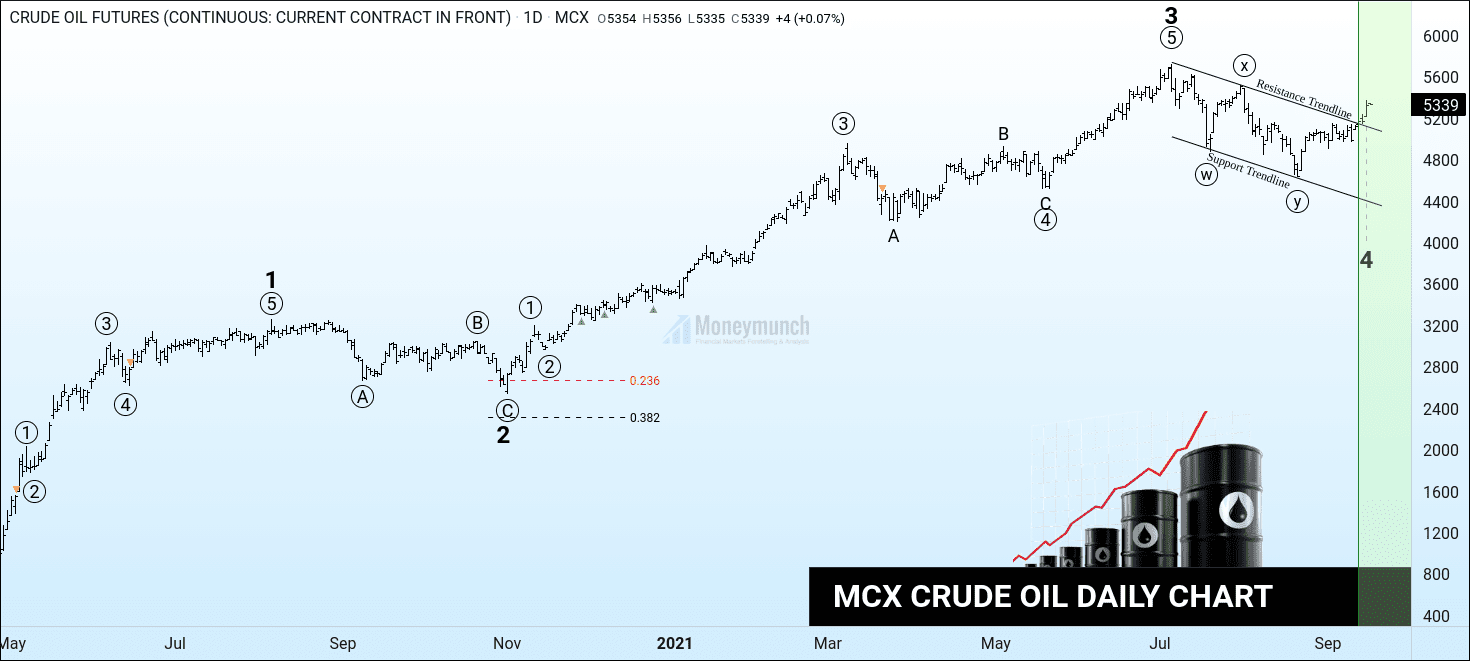
I had written in bold words, “…so, what about short-term investors and intraday traders? If you look into 4 hours chart, it seems bullish from here. Crude oil is trying to break the resistance trendline. Whenever that the resistance trendline break, then we may see the prices at 5300 – 5400+“.
It has touched the first target.
Safe/intraday traders can book full profit here.
To become a subscriber, subscribe to our free newsletter services. Our service is free for all.
Only subscribers can read the full article. Please login to read the entire article.
 Unlock This Article
 Continue reading