MCX Crude Oil Hourly Charts In-Depth Analysis

free commodity crude oil chart tips

FOR THE DAY TRADERS:
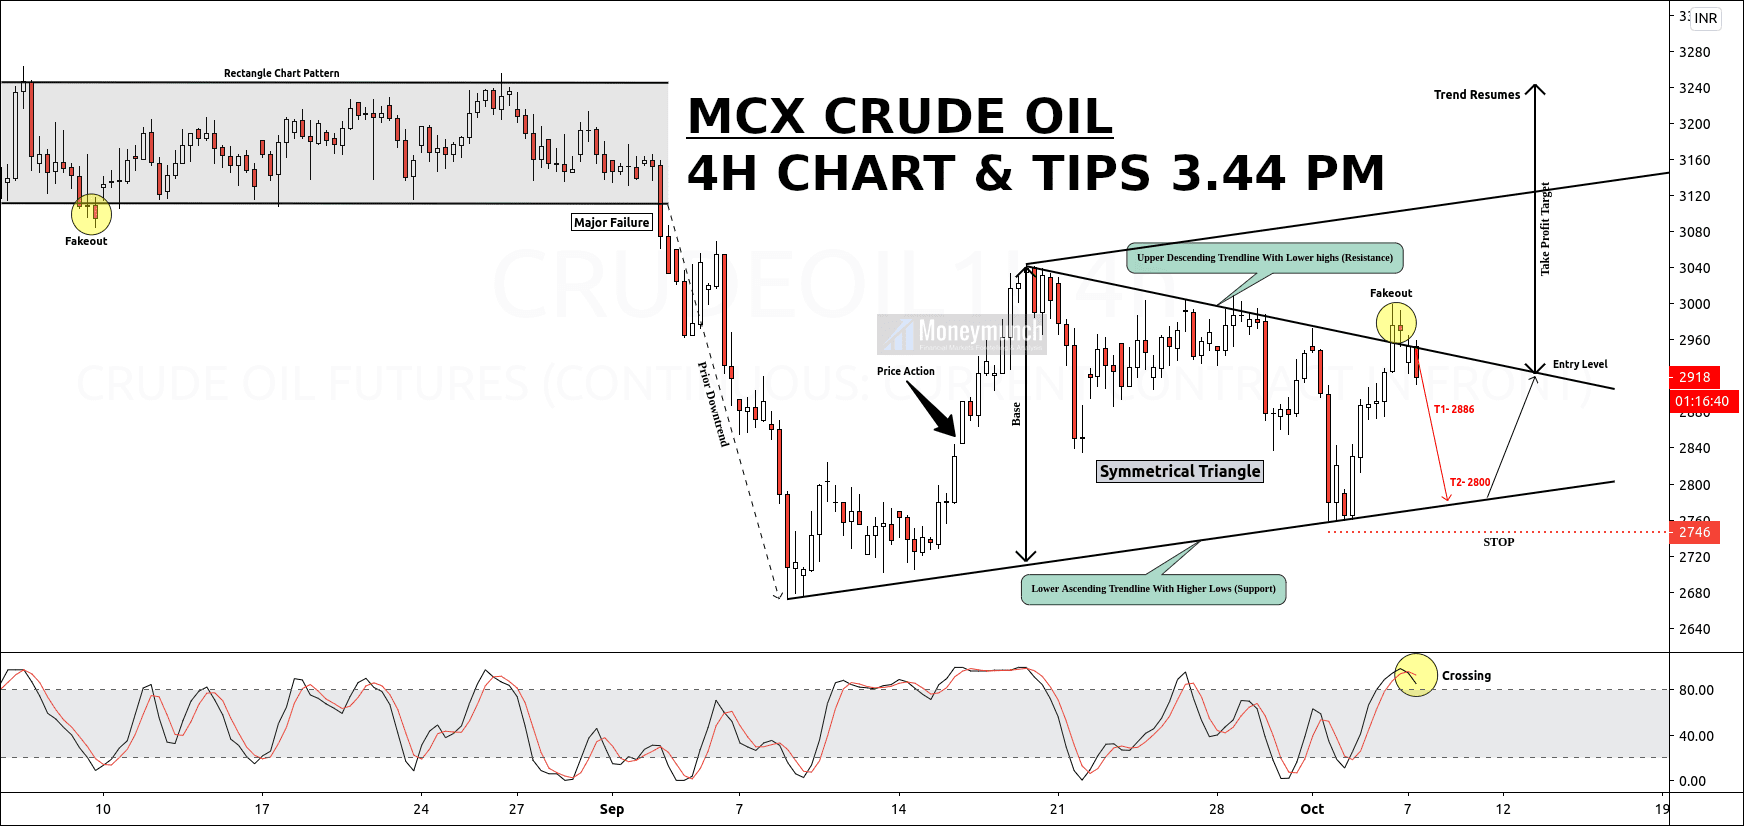
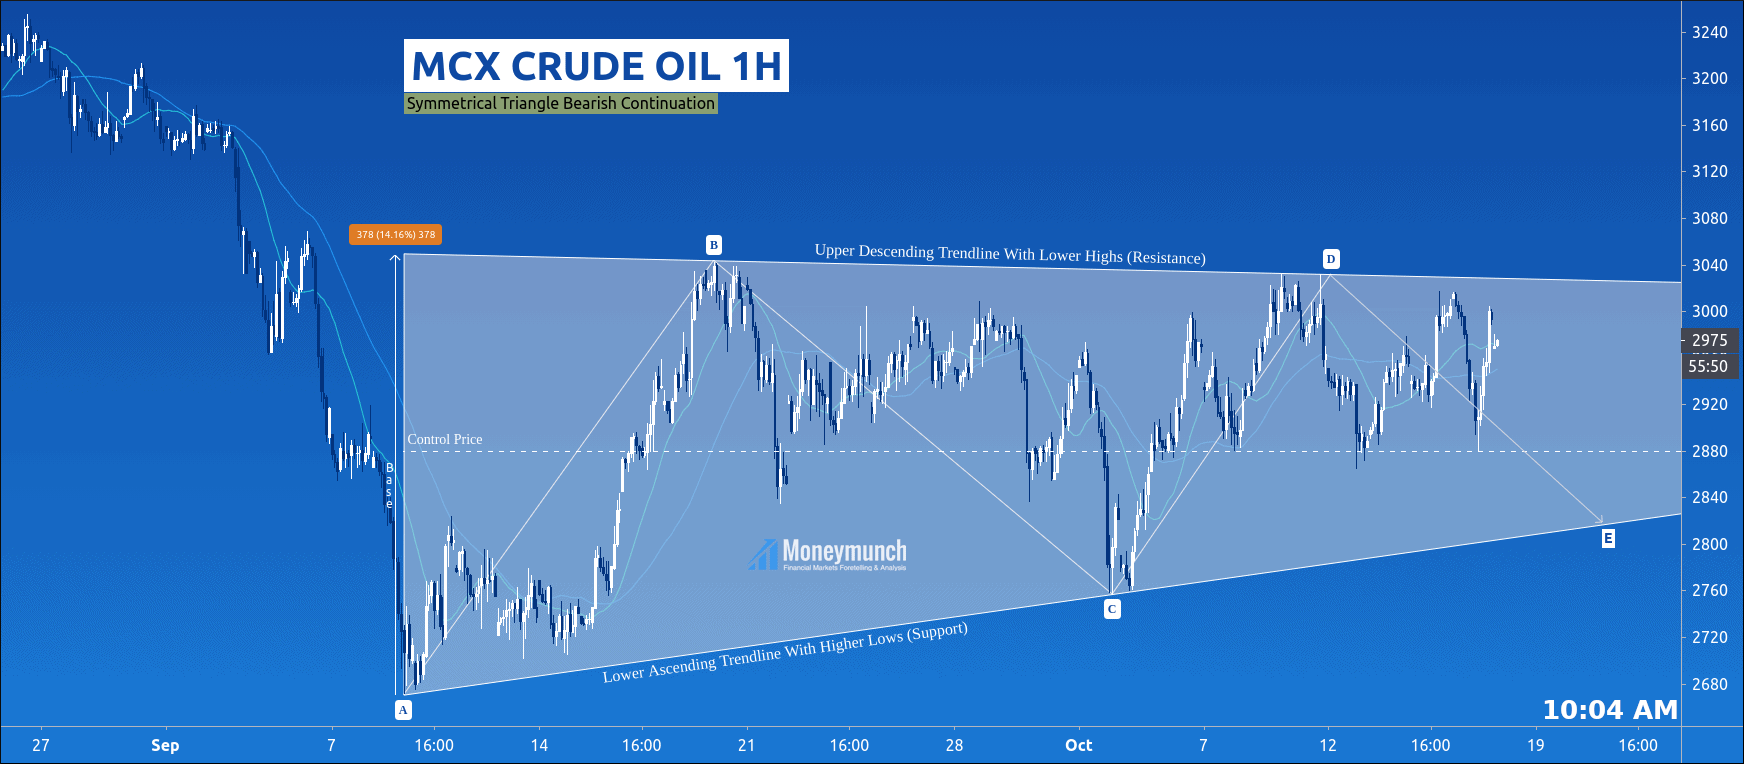
MCX Crude oil has made a symmetrical triangle pattern, and that indicates a bearish continuation. At present, its price is moving inside the triangle pattern. That’s a consolidation area. The prices will keep playing sideways here.

Intraday traders can sell or buy based on control price. The last expected stop is at E. So, we may see crude oil at/below 2840 – 2820 level.

FOR SHORT-TERM INVESTORS:
This symmetrical triangle base range is 378 points. So, the game will begin whenever crude oil will breakout the triangle pattern.

Upper breakout’s targets: 3130 – 3200 – 3280+
Downward breakout’s targets: 2610 – 2500 – 2460

Beware of tail, fakeout, and excess. Accurate entry-level, target and stop-loss is available for the premium members only.

Base Metals Trading Calls Update: MCX Zinc Ready For Another Rally Attempt

Yesterday I had an updated intraday trading call on Zinc. It has made a high of 194.55 level and closed at 194.35. Will it reach the first & second target or not?

Bullion Update: MCX Silver’s Next Target 65200 by the Elliott Wave

I had updated an intraday call on the silver the day before yesterday while its price was running nearby the 61500 levels. It has reached the first target before collapsing. So, what are you expecting ahead?

Will silver hit the next targets or keep falling? To become a subscriber, subscribe to our free newsletter services. Our service is free for all.
Continue reading

MCX Zinc Ready For Another Rally Attempt

free commodity zinc chart calls

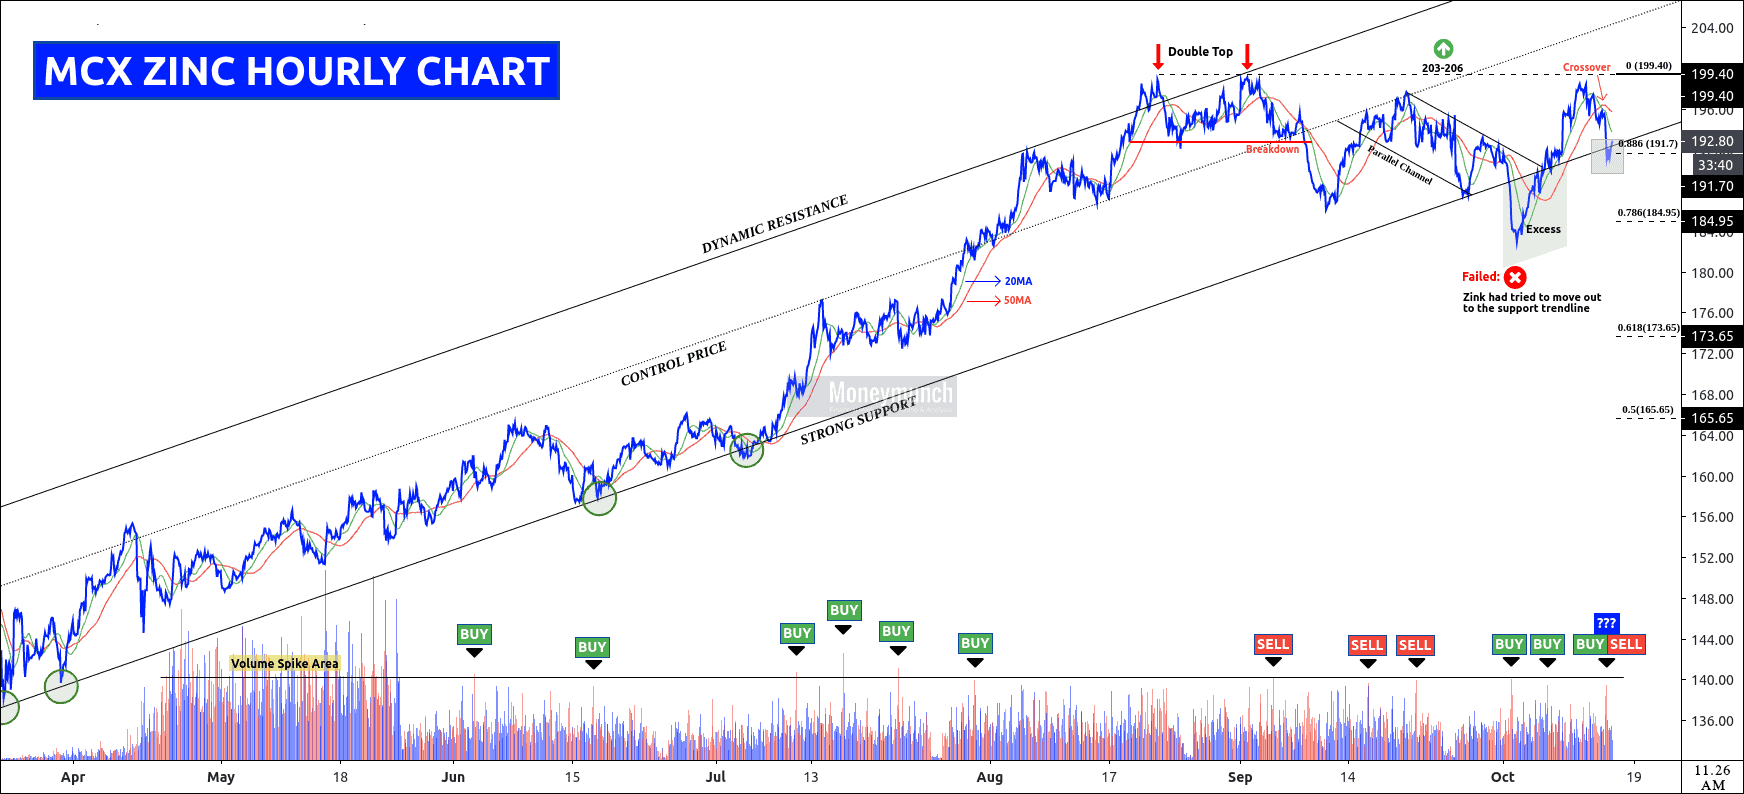
Zinc is going upward since April. Recently, it has broken the strong support trendline and made an excess. At present, it’s running at a strong support line. So what are you expecting next?

Technically, the crossover of 20 & 50 MA indicating a downtrend ahead, and multiple volume spikes are a direct sign for an uptrend.

Simple Trading Strategy for the Intraday Traders:

The day traders can keep buying above 0.886 value of retracement for the target of 194.6 – 196 and above.

Breakout of 199.4 means boom! It can fly from there for 203 – 206 levels.

According to the Fibonacci retracement & moving average, zinc will collapse soon to the value of 0.786. So, short-term investors can go for 185 levels.

To become a subscriber, subscribe to our free newsletter services. Our service is free for all.
Continue reading

MCX Silver’s Next Target 65200 by the Elliott Wave

free silver tips chart

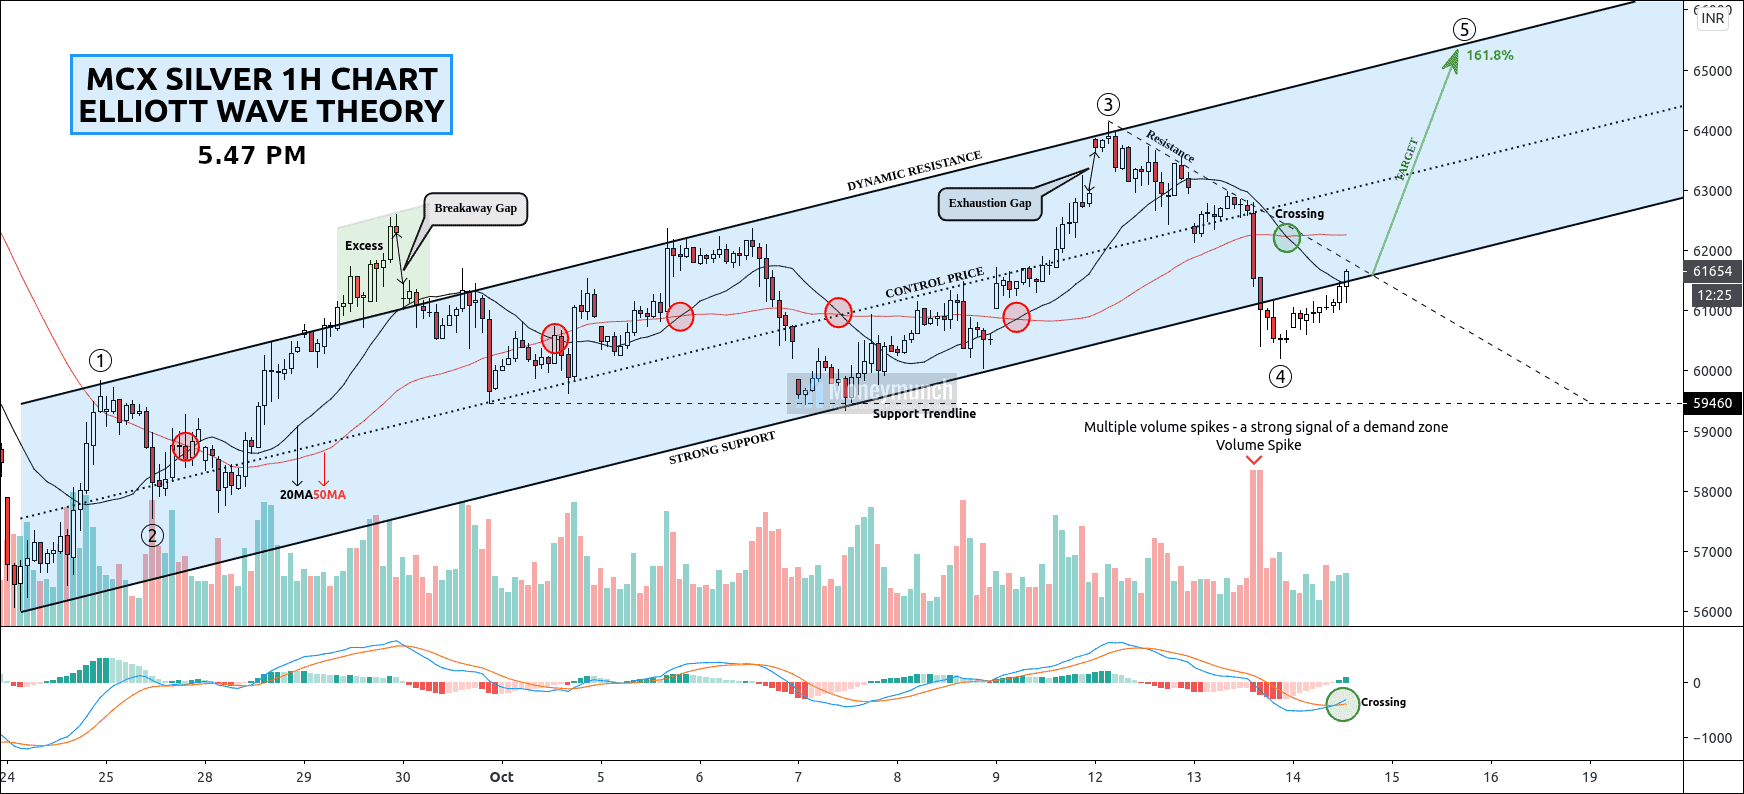
Here, I have applied Elliott wave, moving average, volume, and MACD. Wave 4 can be steady or sideways for a while. Overall, silver is in an uptrend. Safe investors can buy silver at wave 4 for the following levels:

Intraday Targets: 62100 – 63300
Positional Targets: 64260 – 65200

At present, moving average and MACD throwing upward signal by crossover. Technically, multiple volume spikes are a great sign of a bullish trend.

To become a subscriber, subscribe to our free newsletter services. Our service is free for all.

Continue reading

Gold Spot & MCX Nickel – Massive Bearish Pressure Coming Soon

free commodity gold spot hourly chart tips

GOLD SPOT See What These Gann Gan & Fibonacci Retracement Value Say About Trend

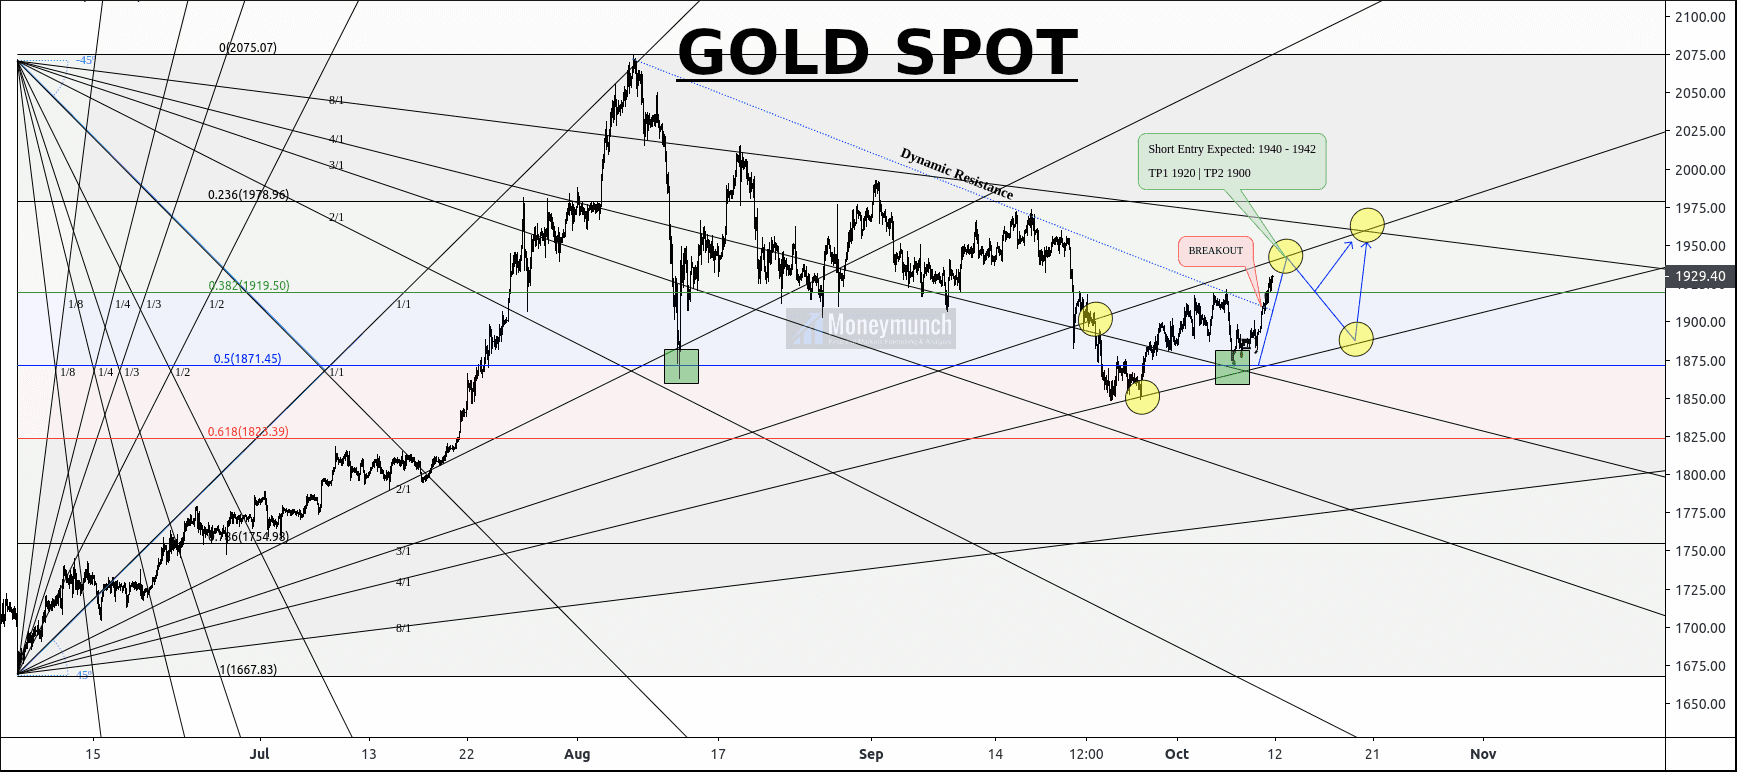
Here, I have used Gann Fan & Fibonacci Retracement to identify the next move of Gold Spot. Wherein, it is taking reversal from the 0.5 retracement value (highlighted by green square). And now it’s running under 3/1 & 4/1 Gann Fan value.

According to this chart, gold will keep drilling upward up to $1940. After that, it can fall for 0.382 value of retracement. And a breakdown of this retracement means $1900 waiting ahead.

Overall we can see a bullish trend. That can be for $1960 – $1976 levels before Nov end.

MCX Gold Report: Intraday Pullback Before Acceleration Lower

Gold in Correction Mode..?To become a subscriber, subscribe to our free newsletter services. Our service is free for all.

Nickel Trading Calls Updates

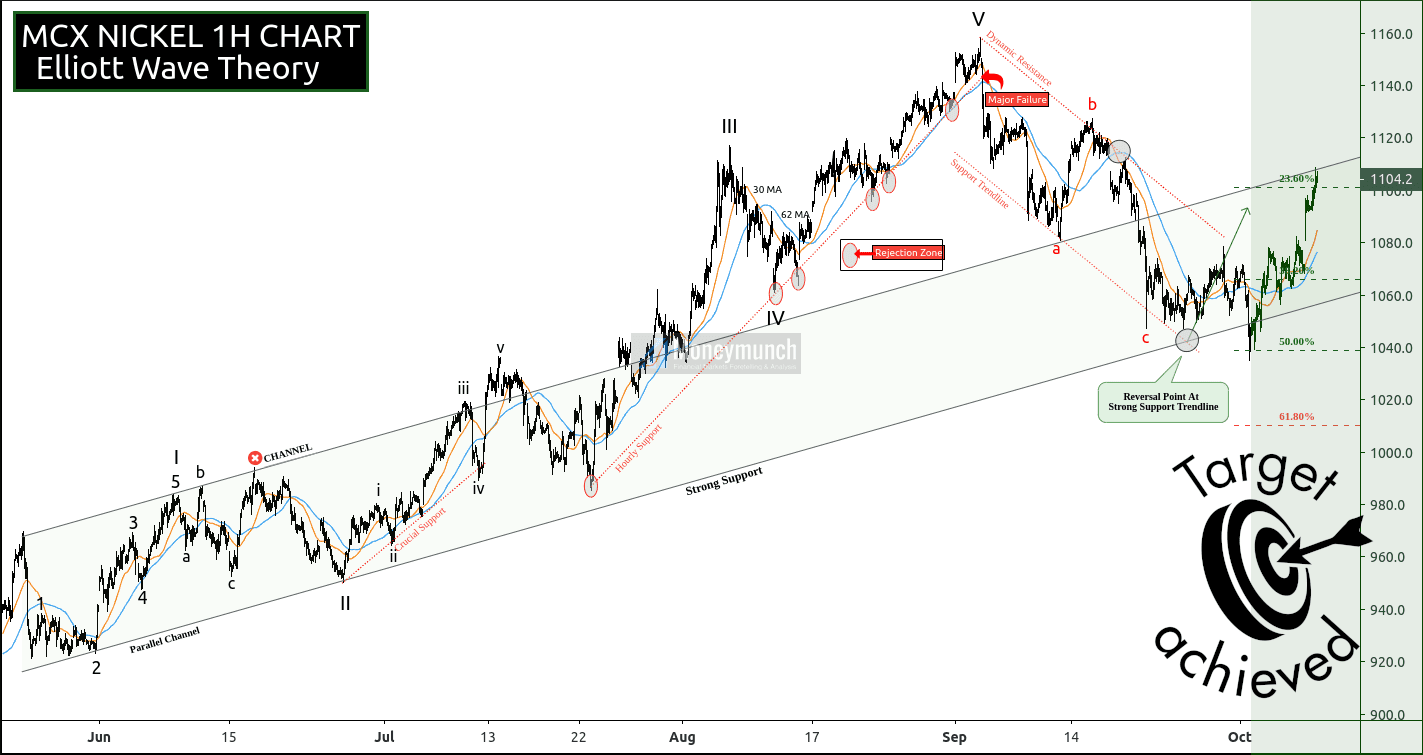
free mcx nickel calls chartHow many of you bought Nickel? If not, read this article: MCX Nickel Detailed Trend Forecast & Tips

I have written in bold words, “…nickel will start raising for 1076 – 1090 – 1100 level. Dynamic resistance breakout will lead the prices for a 23.60% retracement level”.

In the last trading session, MCX Nickel has reached all targets (see below). What else you want!?

free mcx nickel tips & updates

Continue reading

Positional & Intraday Crude oil Call

free commodity crude oil tips

The trend is making a symmetrical triangle.
In the symmetrical triangle, you can see the trend is descending, and it will continue to fall up to the particular targets, which are shown in the charts (T1 2886 & T2 2800).

After knocking the lower ascending trendline with higher lows (support), It will bounce to the upper descending trendline with the lower highs (resistance). After that, If the trend makes consecutive candles, there will be an ascending trend. But don’t sell if the trend falls and crosses the stop loss.

To become a subscriber, subscribe to our free newsletter services. Our service is free for all.

Continue reading

MCX Gold Intraday Pullback Before Acceleration Lower

gold intraday calls hourly chart

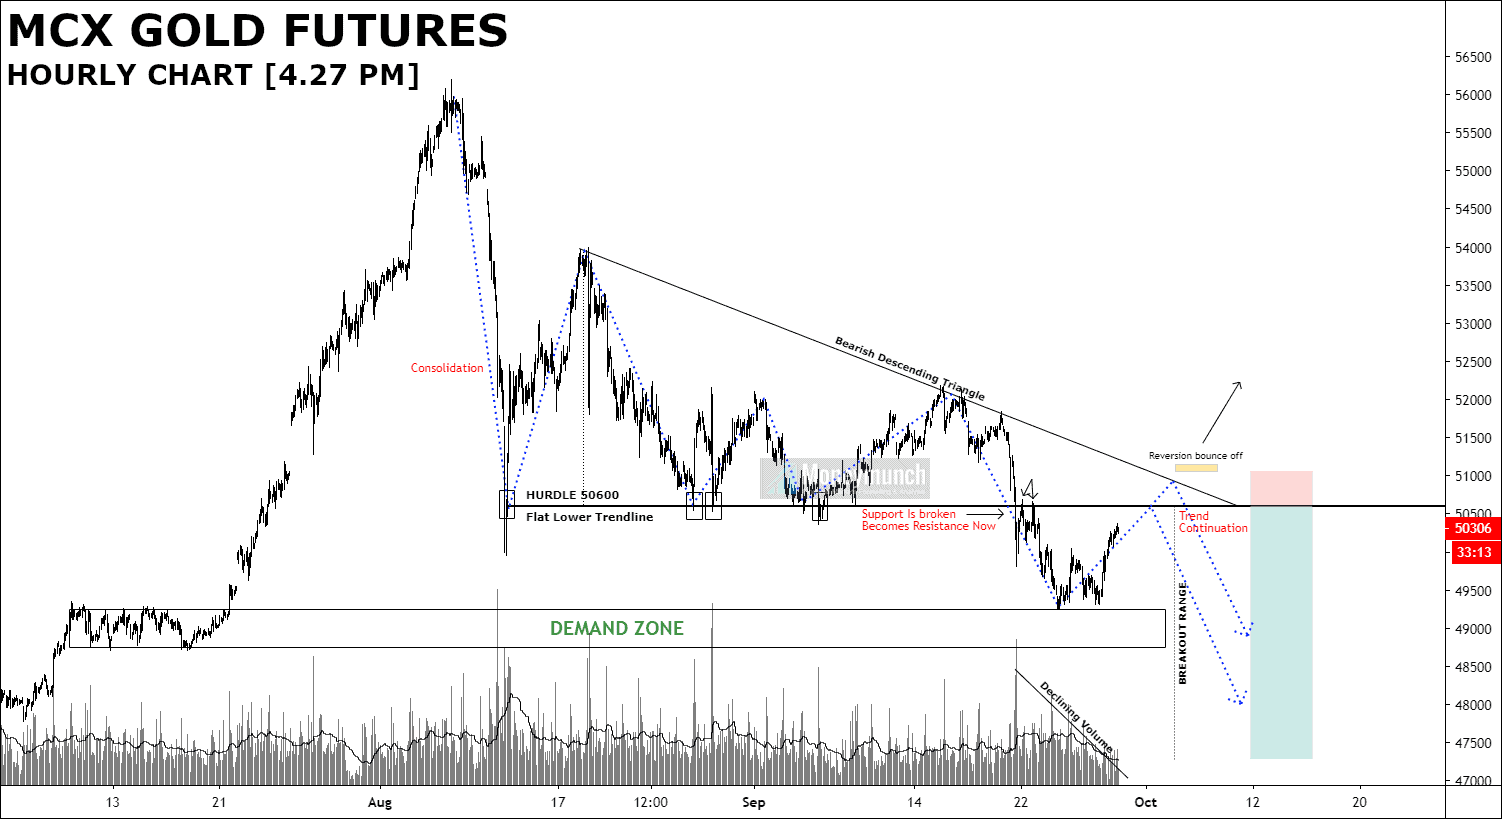
Breakout Range: Approx. 3300 points
Hurdle: 50600 level

At present, gold is trying to recover the previous loss. The support level has broken (flat lower trendline), and it becomes resistance now. We may see the continuation of the downtrend from there. That could fall to the following levels: 49360 – 48760 and below.

Lion heart traders can hold for, 48000 to 47360.

Please don’t mess after a breakout of reversion bounce off level. To become a subscriber, subscribe to our free newsletter services. Our service is free for all.

Continue reading