Gold Price 2021 Roadmap – EWT

free commodity gold chart tips

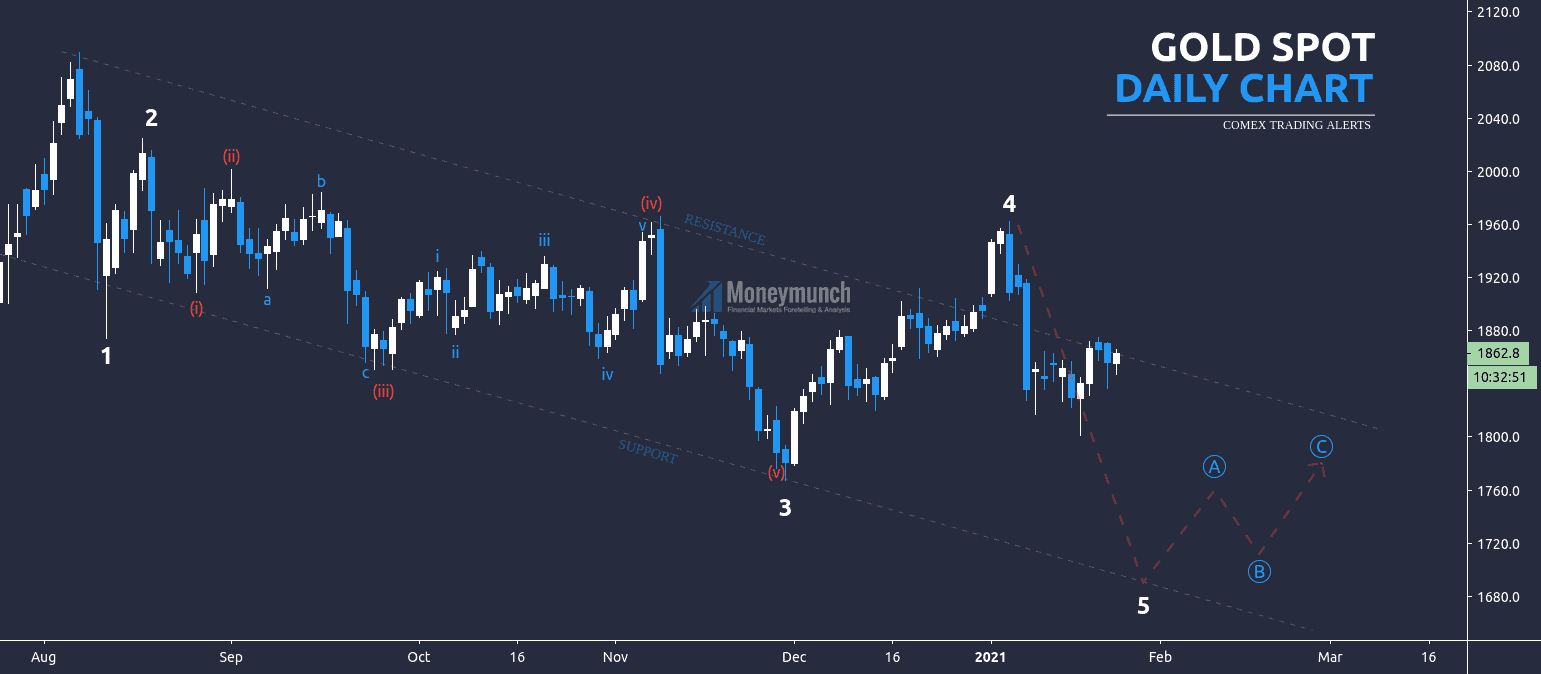
The Gold spot started the bearish Elliott wave on the daily timeframe. Right now, it’s making the 5th wave. It has to cross 1824 – 1800 – 1776 to complete the fifth wave. The fifth wave will complete around 1690.

If there will be the upside breakout of wave 4, then it’s a failure of the Elliott wave pattern. And the target for the uptrend will be as following 1980 – 2000.

To become a subscriber, subscribe to our free newsletter services. Our service is free for all.

Continue reading

MCX Aluminium 2021’s Supercycle

free commodity aluminium tips chart

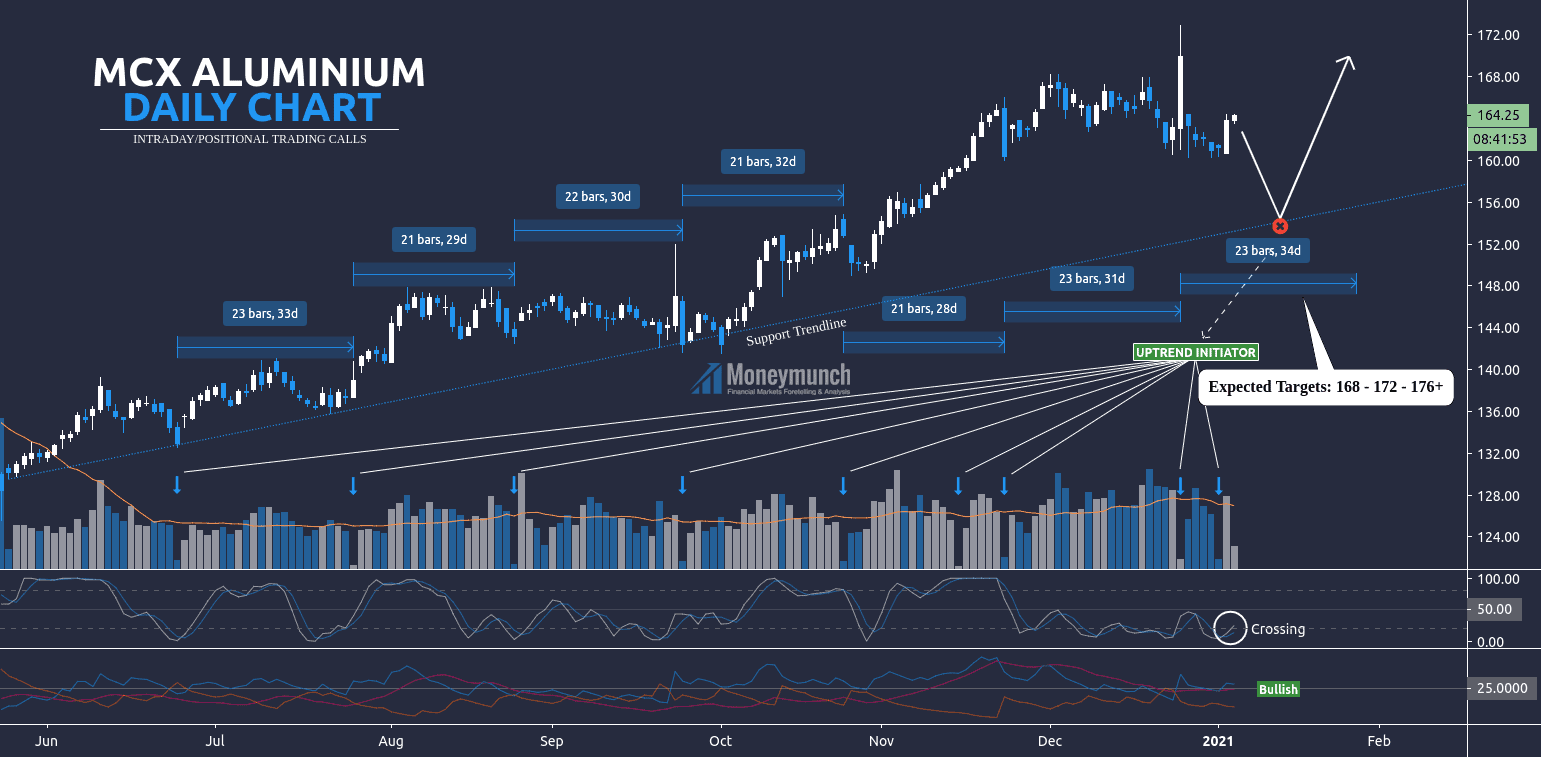
MCX Aluminium is moving sharply. Its range is 21 to 23 bars or a month. It can fall back up to the support trendline (TP: 159 – 156).

According to this chart, aluminum will not stop here. It is further advance up to 168 – 172 – 176 levels.

PREVIOUS TRADING CALLS UPDATES

To become a subscriber, subscribe to our free newsletter services. Our service is free for all.

Continue reading

MCX Copper in a Temporary Pullback (EWT)

free commodity copper tips daily chart

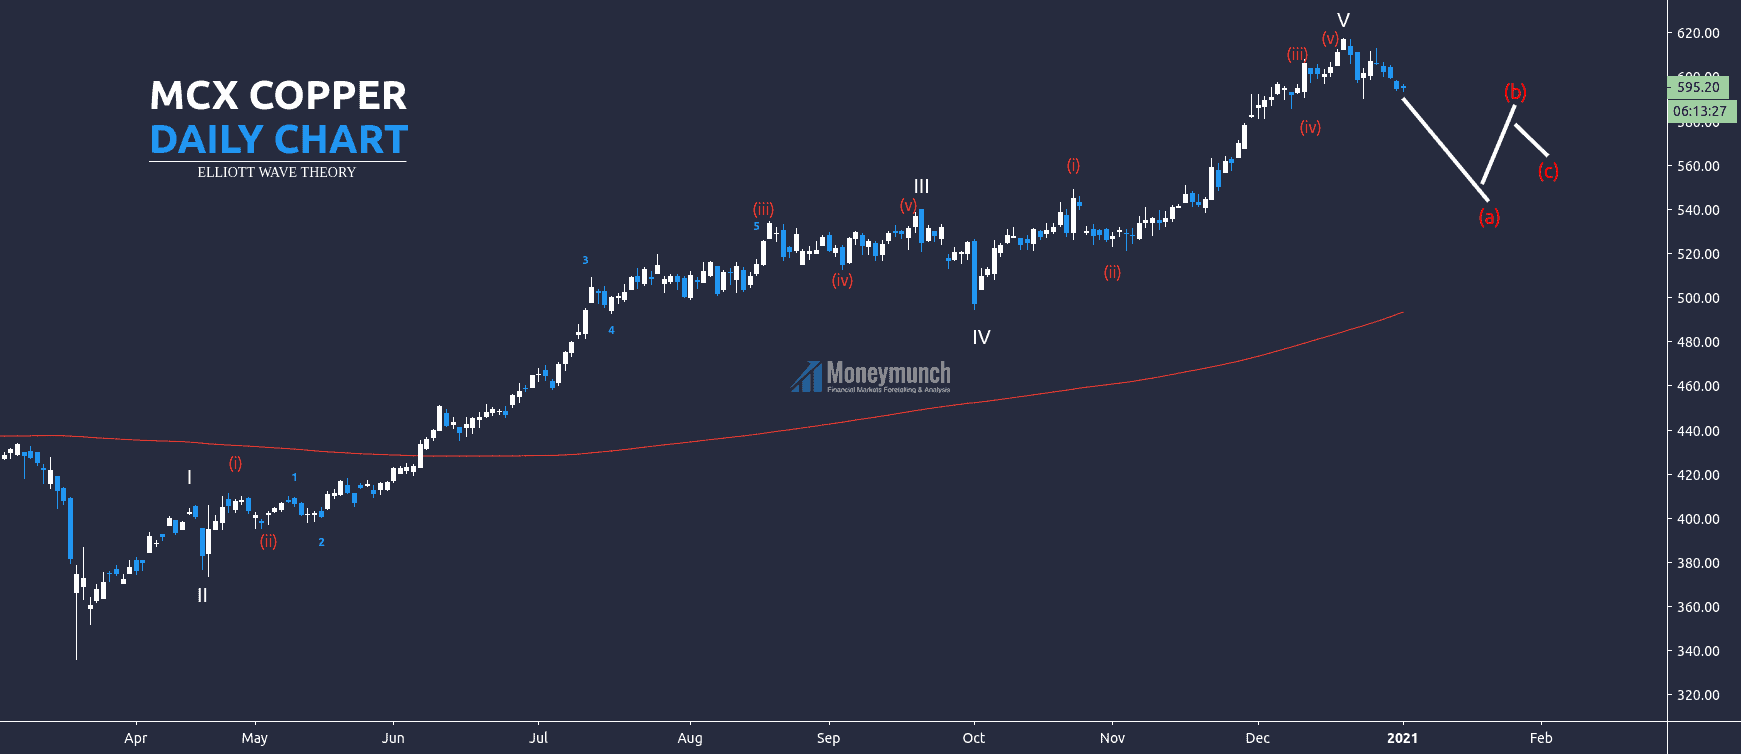
Copper has made the Bullish Elliott wave on the daily timeframe. It’s completed the five-wave cycle, ABC correction is remaining. After the 5th wave, the trend started to make the A, and it’s still making it. MCX copper has to cross 585 – 580 – 560. After that, it will rise for a short period to make the B. And it will fall again to make C. But all over, it’s an uptrend.

To become a subscriber, subscribe to our free newsletter services. Our service is free for all.

Continue reading

Is Natural Gas Ready to Complete a “Head and Shoulders”?

free commodity naturalgas chart tips

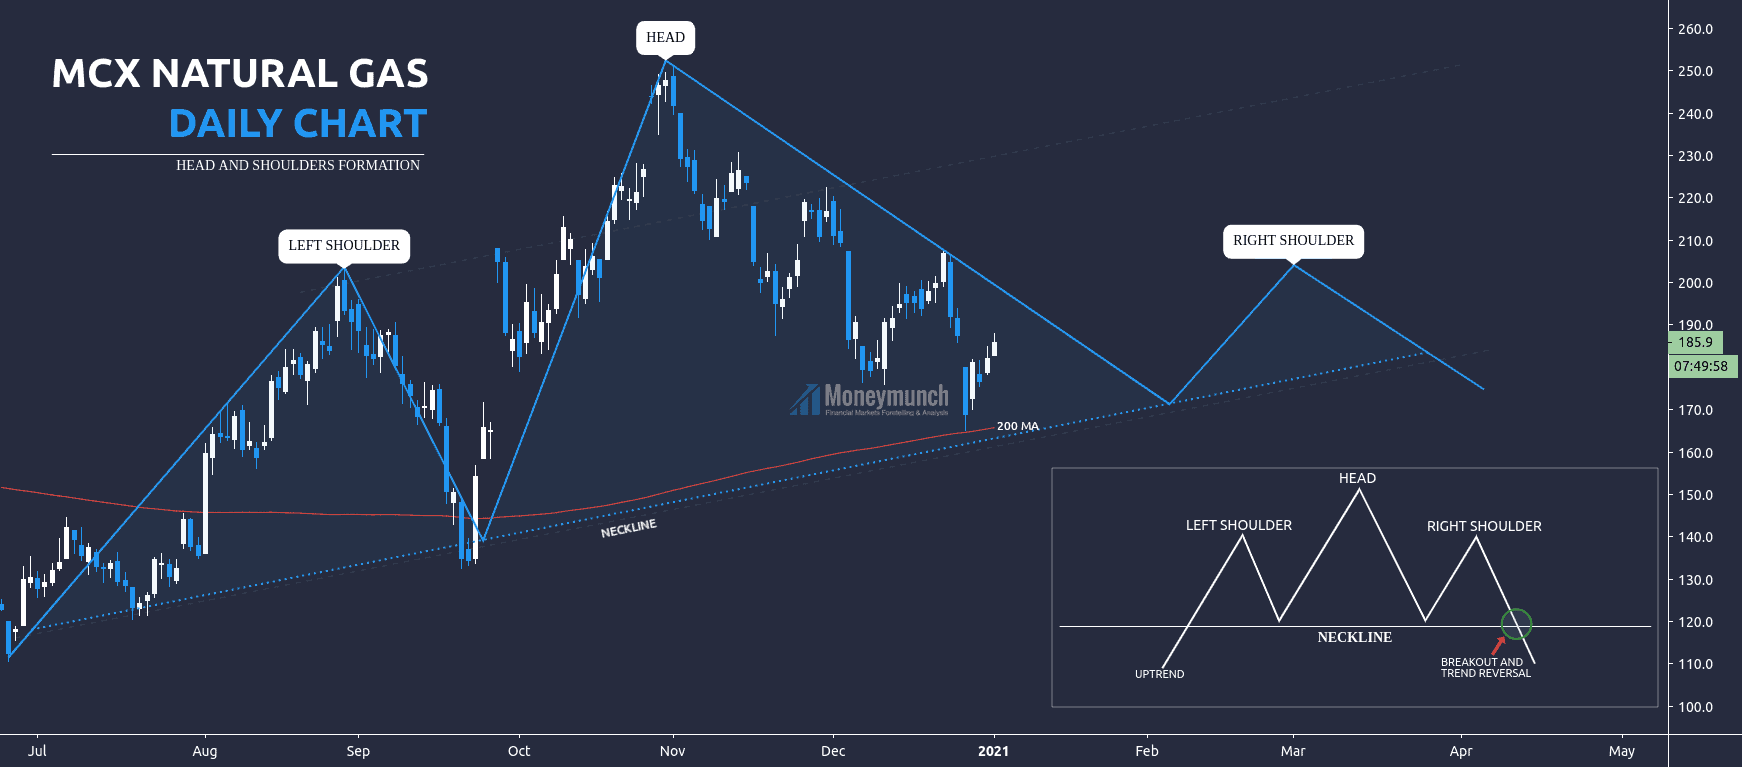
Natural gas started to make the head and shoulders pattern on the daily timeframe. First, let’s understand some basics about the head and shoulders pattern. Here, it’s a bearish head and shoulders pattern. In this pattern, the trend starts with the uptrend and makes the left shoulder, head, and the right shoulder. And after the completion of the right shoulder, it falls by breaking the neckline.

In this chart, the trend completed the left shoulder, and the head is almost there. And then it will create the right shoulder. It will fall up to the neckline to complete the formation of the head. And the targets to reach the neckline are as following, 180 – 175 – 168.

After hitting the neckline, the next step of natural gas will be the right shoulder. As per the rules, the right shoulder can be similar to the left shoulder or, it can be at a higher level than the left shoulder. Because the left shoulder is at 203, the trend will march again to 203 to make the right shoulder. To reach 203, natural gas will hit 180 – 190 – 200.

And then the trend will take reversal and fall by breaking the neckline.
Targets: 195 – 185 – 175.

To become a subscriber, subscribe to our free newsletter services. Our service is free for all.

Continue reading

MCX Gold 2021’s Supercycle

free commodity gold daily chart tips

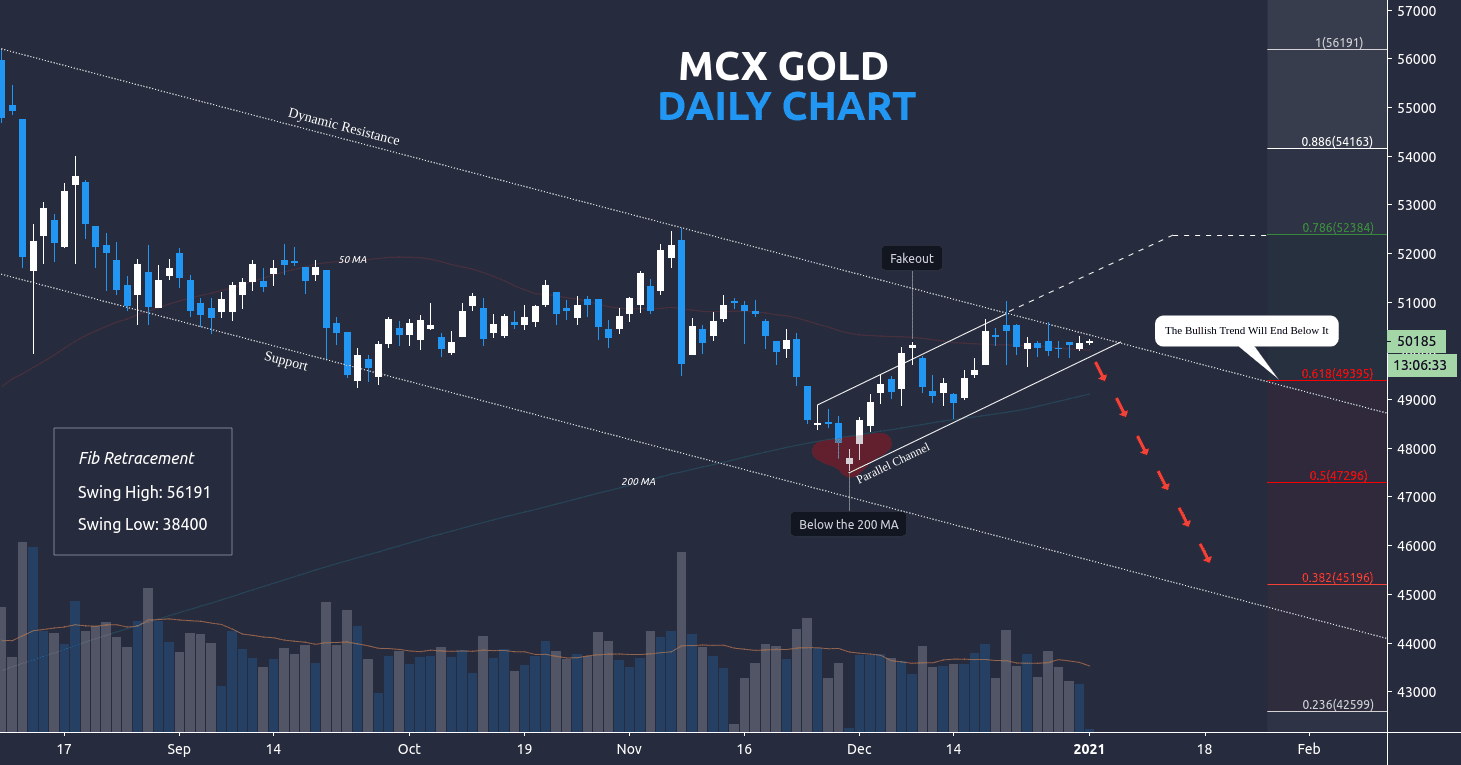
MCX Gold is collapsing after making the all-time high of 56191 (swing high). It has created a parallel channel in December. Gold prices are rising here. If gold breaks the dynamic resistance without fakeout, it can touch 51000 – 52000 – 52384 levels at the beginning of 2021.

And if gold breaks the parallel channel and retracement value of 0.618, it will become unstoppable and hit the following levels: 48800 – 47800 – 47296 – 46000 – 45196

To become a subscriber, subscribe to our free newsletter services. Our service is free for all.
Continue reading

MCX SILVER – MA, EMA, & DMI [Buy Now]

free commodity silver 15m chart tips

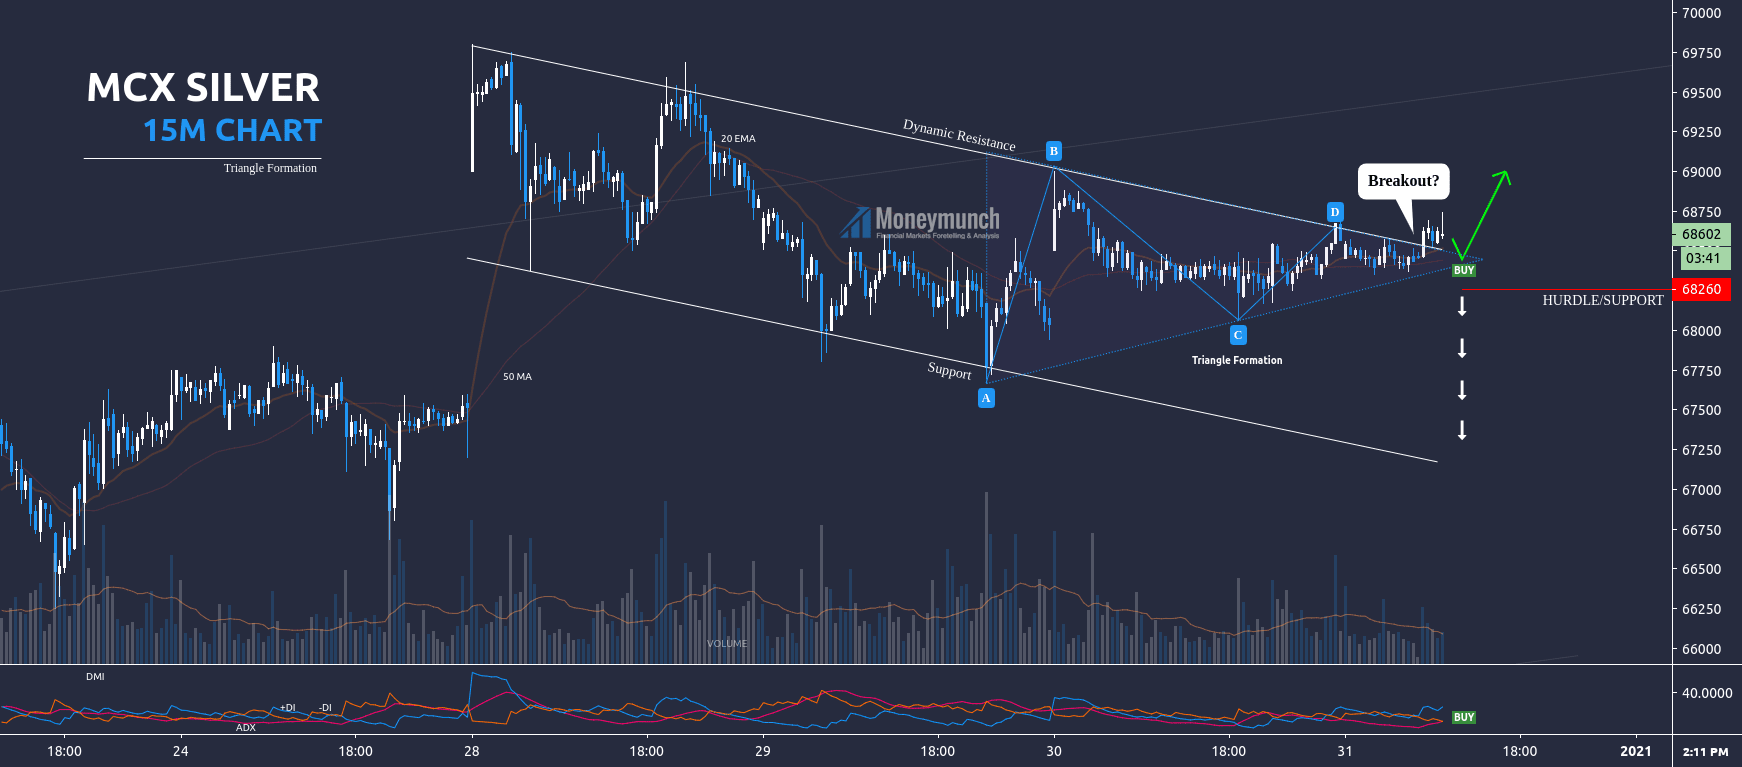
Silver has broken the dynamic resistance & triangle formation. According to MA, EMA, & DMI, silver will run to reach 68800 – 69000 levels.

It will start falling after breaking the hurdle/support line. How much? 68000 – 67600 below.

To become a subscriber, subscribe to our free newsletter services. Our service is free for all.
Continue reading