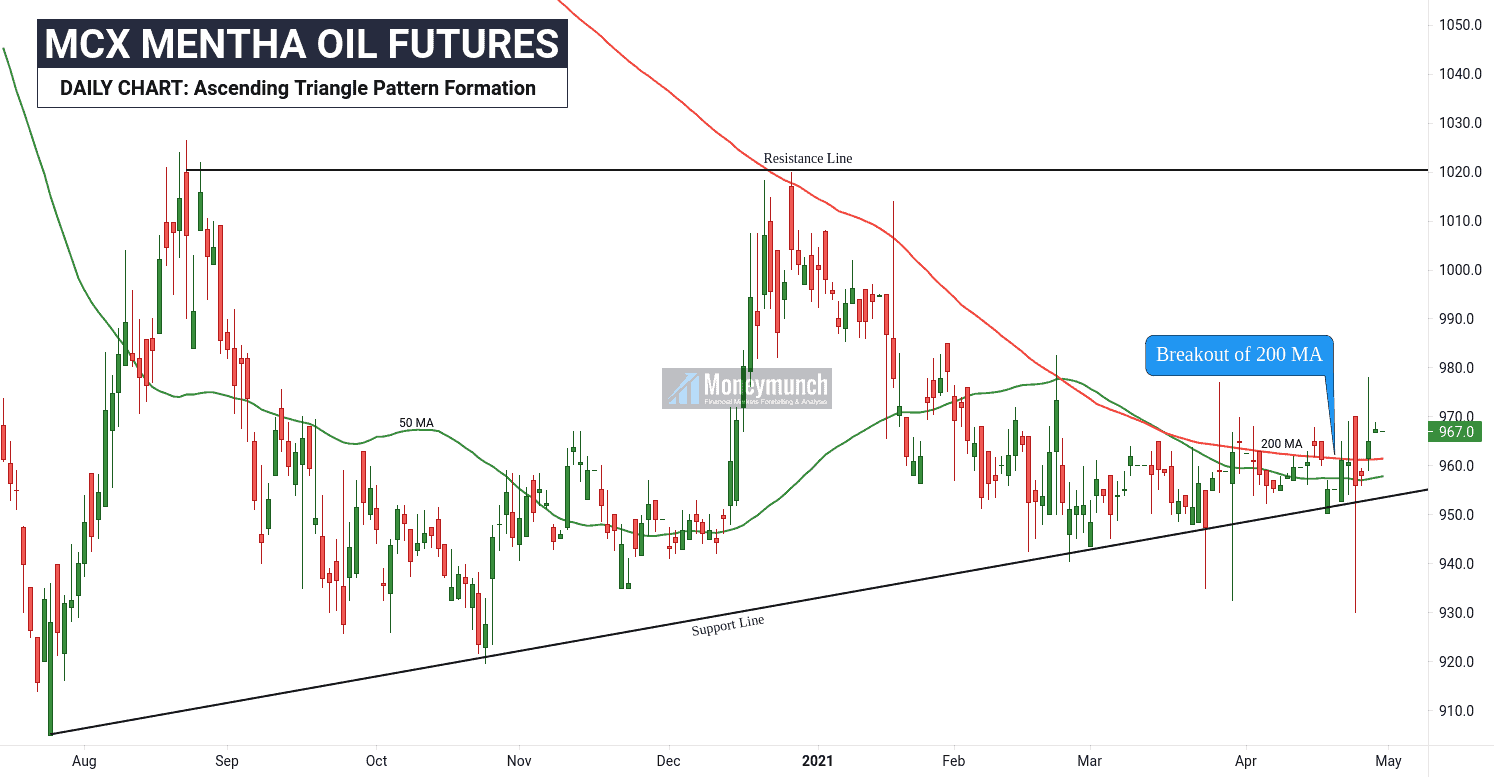
MCX Gold, Gold Guinea, & Copper Detailed Reports & Tips

free commodity copper tips chart

If You Own MCX Copper, Look Out Below

MCX Copper is playing under a parallel channel. Currently, it’s at the support trendline. Additionally, there’s a Fibonacci retracement value of 0.886.

The best trading strategy for the day traders is:
According to a moving average and parallel channel’s support trendline, copper is strongly bullish. It can show us an all-time new high before the end of this month. So, the day traders can buy for the levels of 536 – 540 – 556+.

Important – Due to the election of the USA.
From where it starts collapsing?
You can sell the copper at/below parallel channel or Fib retracement value 0.886 for the targets of 516 – 506.

free mcx gold guinea calls chart

MCX Gold Guinea price setting up for a big rally

U.S election results will come soon. Today, we have chances to see solid movements in MCX’s bullion sector commodities. And Gold Guinea crossed 50 MA upper side.

Intraday & short-term traders can buy using this strategy to make some money. Targets: 41800 – 42200 – 43000+

If it closes below 50 MA, then don’t hold your position in loss. I prefer to exit after it.

Do you want to know about MCX Gold?
Gold has touched the first two intraday targets: Click Here to Read Now

To become a subscriber, subscribe to our free newsletter services. Our service is free for all.

Continue reading

MCX Gold & Crude Oil Trading Tips & Analysis

free commodity gold tips & chart

MCX Gold Measured Moves

Gold has made a Doji in the weekly chart. It’s a direct sign of a reversal. And wherein ADX is less than 25 but +DI above the -DI. Additionally, the 20 MA line is trying to stay downside.

In short, DMI & MA is throwing a strong upward signal. Moreover, its volume is increasing. This week, we have chances to see gold prices above the 51860 levels. The day traders can follow the following targets:
51000 – 51360 – 51860+

And short-term investors can hold for 52000 – 53000 – 53560+ levels.

All you need to do is watch out for a dynamic support trendline. It should remain above it. Else, it will start falling. And that downfall for the levels of 50000 – 49600 – 49360.

Significant releases or events that may affect the movement of gold & crude oil:
Monday, Nov 02, 2020

  • 11:00 – Gold Index

Tuesday, Nov 03, 2020

  • 05:30 – U.S. Presidential Election

Wednesday, Nov 04, 2020

  • 02:00 – U.S. API Weekly Crude Stock
  • 21:00 – U.S. Crude Oil Inventories

free MCX crude oil calls chart

Crude Oil Price Setting Up For A Downside Price Rotation

First, let’s talk about the previous update of crude oil . There, I have drawn the symmetrical triangle bearish pattern on the hourly chart of MCX’s crude oil.

free commodity crude oil chart tips

I had written for the day traders, “…the last expected stop is at E. So, we may see crude oil at/below 2840 – 2820 level”.

THESE TARGETS HAS REACHED.

And for the short-term traders, I had written in bold words, “this symmetrical triangle base range is 378 points. So, the game will begin whenever crude oil will break out the triangle pattern . Downward breakout’s targets: 2610 – 2500 – 2460“.

Crude oil has touched the first target (2610) by making a low of 2606 level on 29 Oct ’20. Now let’s come to the point, will crude hit the second & last target or not?

CRUDE OIL DOWNSIDE BREAKOUT ALERT!
If crude oil prices break out the 2600 level, we will see 2540 – 2500 – 2460 levels before the weekend.

Please note that don’t sell it above the 2600 level.

To become a subscriber, subscribe to our free newsletter services. Our service is free for all.

Continue reading

MCX Cotton rising by global demand – Target 20000+

free commodity cotton tips daily chart

According to fundamental research, MCX (NCDEX) cotton seems strongly bullish ahead. The short-term investors can start buying cotton nearby highlighted area for the targets of 19860 – 20000 – 20260+.

To become a subscriber, subscribe to our free newsletter services. Our service is free for all.

Continue reading

MCX Natural Gas Long-Term Outlook – Target 300+

free mcx naturalgas calls chart

According to this chart, MCX Natural gas is further advance. We may see the following levels after a reversal.

Targets: 234.6 – 263.9 – 305.6

Intraday traders can run with 20 & 50 MA crossover. And long-term traders should stick with 200 MA to maximize profits.

Significant releases or events that may affect the movement of natural gas on Wednesday, Oct 28, 2020:

  • 02:00: U.S. API Weekly Crude Stock
  • 20:00: U.S. Crude Oil Inventories
  • 20:00: EIA Weekly Refinery Crude Runs
  • 20:00: U.S. Crude Oil Imports
  • 20:00: U.S. Cushing Crude Oil Inventories
  • 20:00: U.S. Gasoline Production
  • 20:00: U.S. Heating Oil Stockpiles
  • 20:00: U.S. Gasoline Inventories
Continue reading

MCX Gold Price Trend Analysis & Tips

free commodity gold calls chart

Gold is performing in the parallel channel from 22 Sep. Recently, the moving average has tried to crossover but failed. And volume spike is a direct sign of an uptrend. It’s sharply moving forward.

free commodity mcx & cfd gold spot daily chart & signalsAs I updated on Oct 19, gold is trying to climb upward after hitting the parallel channel. And if it remains in the parallel channel, we may see 51000 – 51500+ levels… And for the day traders, 51000 – 51130 – 51260+ levels.

Please note parallel channel breakdown is not the best place for a short. A better place for shorts is the hurdle line.

Here I have used ADX to identify the trend strength. Gold’s ADX < 25 means the uptrend is weak.

What will happen after a breakout of a parallel channel and hurdles? I will update it in my next update of Gold.

To become a subscriber, subscribe to our free newsletter services. Our service is free for all.

Continue reading

MCX Gold & Zinc – Tips & Updates

free commodity mcx & cfd gold spot daily chart & signalsHave you bought Gold? If not, I have updated a free call on gold three days back.
Read Now: Gold Spot vs. MCX Gold – Weekly Reports & Tips

I had written in bold words, “according to this chart, gold is trying to climb upward after hitting the PC (Parallel Channel). And if it remains into the PC, we may see 51000 – 51500+ levels before the weekend”.

Gold has reached the first target (51000) and made a high of 51454 yesterday. Will it touch the next target or not?

Min. Profit Per Lot: Rs.30,000

free mcx zinc tips & chart

free commodity zinc chart callsI have updated a free Zinc trading call on 15 Oct 2020. First, visit here to read that article: MCX Zinc Ready For Another Rally Attempt

I had written clearly, “The day traders can keep buying above 0.886 value of retracement for the target of 194.6 – 196 and above. Breakout of 199.4 means boom! It can fly from there for 203 – 206 levels”.

Zinc has touched all day trading targets, and it has also touched the positional target of 203. Will it touch the last target 206 level before the weekend?

Min. Profit Per Lot: Rs.61,000
What else you want in a free subscription? To become a subscriber, subscribe to our free newsletter services. Our service is free for all.

Continue reading