
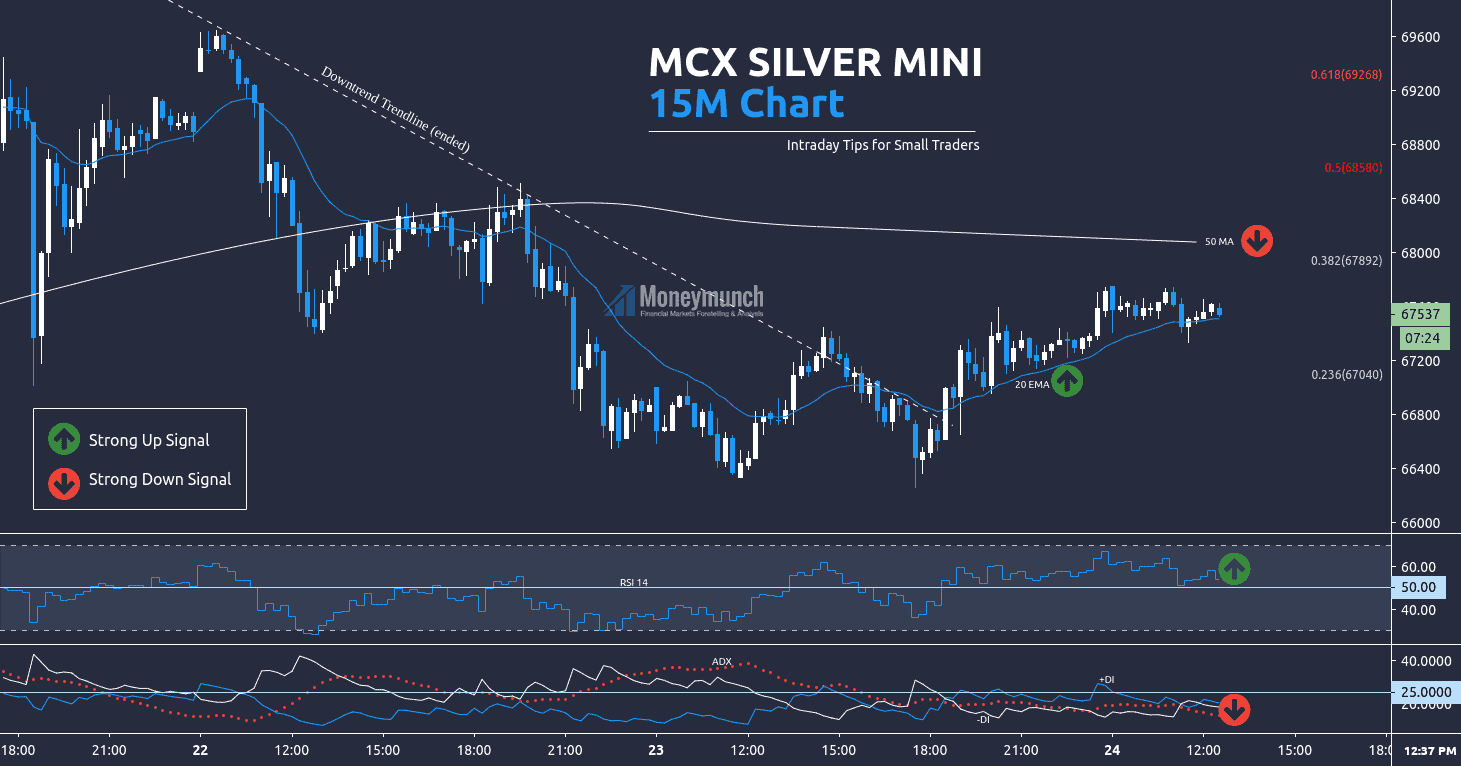
This is MCX Silver mini 15 minutes chart. I have used here moving average, Fibonacci, DMI, and RSI.
Fib Levels: T 71496 and B 65664
Silver will try to touch 0.382 (67892) from here. It will act as resistance. Moreover, there is a 50 MA. If silver breaks both, it will fly from there and touch, 68580 levels. Intraday traders can play between it.
But if it takes a U-turn from 50 MA and breaks the 20 EMA, be ready for the following targets: 67060 – 66600.
To become a subscriber, subscribe to our free newsletter services. Our service is free for all.
Get free MCX ideas, chart setups, and analysis for the upcoming session: Commodity Tips →
Have you any questions/feedback about this article? Please leave your queries in the comment box for answers.
Disclaimer: The information provided on this website, including but not limited to stock, commodity, and forex trading tips, technical analysis, and research reports, is solely for educational and informational purposes. It should not be considered as financial advice or a recommendation to engage in any trading activity. Trading in stocks, commodities, and forex involves substantial risks, and you should carefully consider your financial situation and consult with a professional advisor before making any trading decisions. Moneymunch.com and its authors do not guarantee the accuracy, completeness, or reliability of the information provided, and shall not be held responsible for any losses or damages incurred as a result of using or relying on such information. Trading in the financial markets is subject to market risks, and past performance is not indicative of future results. By accessing and using this website, you acknowledge and agree to the terms of this disclaimer.
It’s amazing……your analysis is so perfect
sir i made payment for three years by cash deposit. how can i share receipt. please whatsapp me (982XXXXXXX). thanks
gold me kya lagta h apko? view dijiye
– Kanchipuram
Gowrishankara
I saw this today’s article it’s eye catchy. So I go through the all charts and I am very impressed with the ideas and I was looking for something like this in trading. I am gonna subscribe today for sure. This chart is so clear and easy to understand.