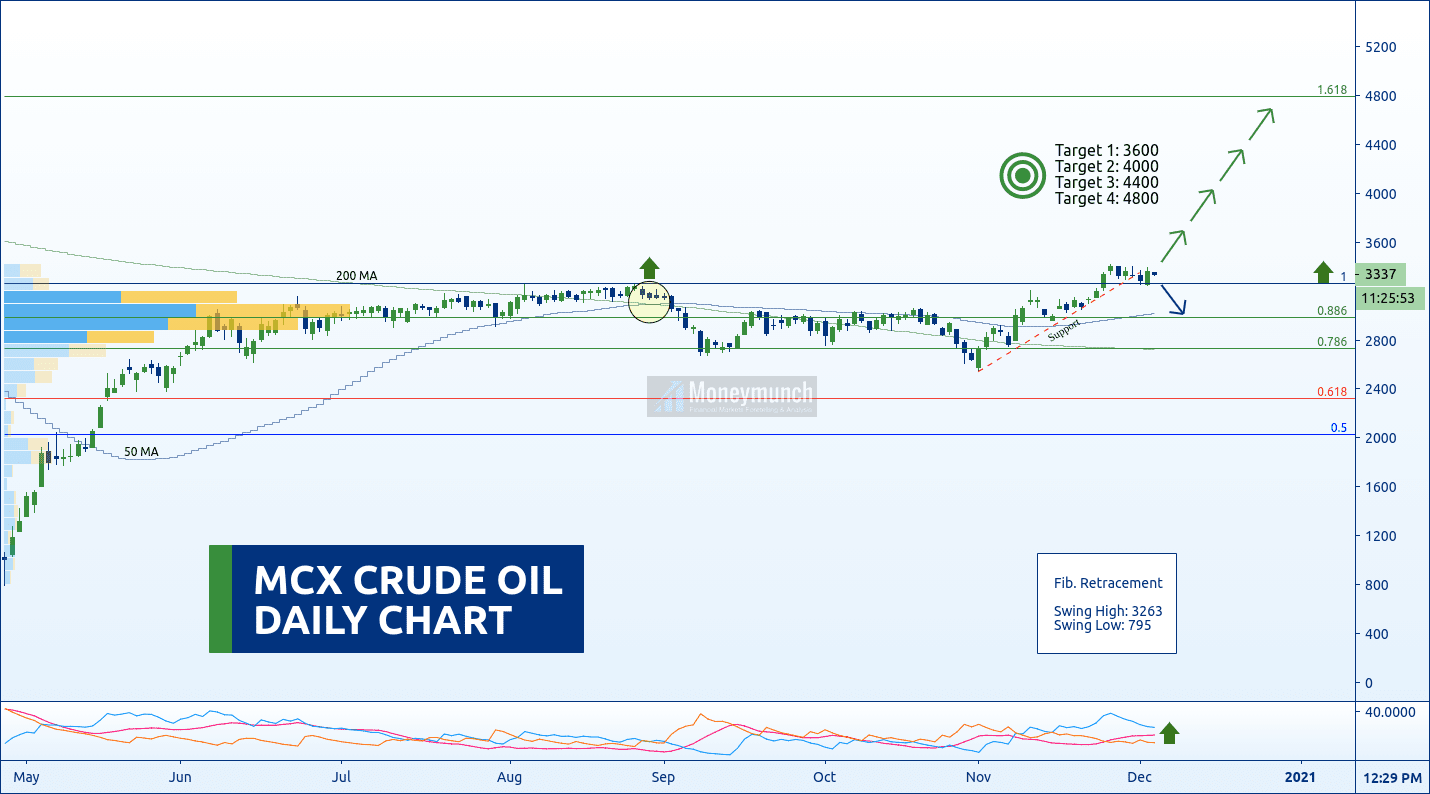
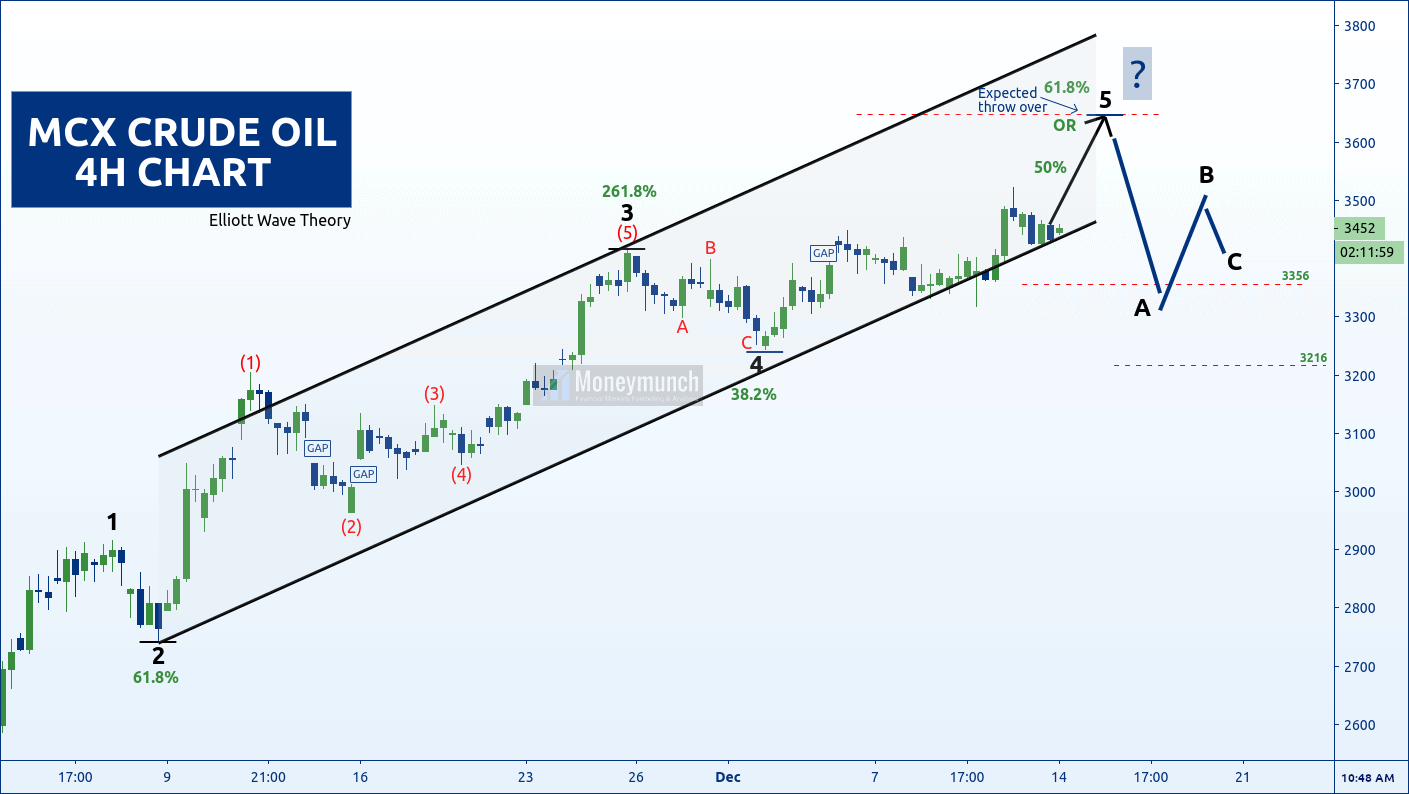
Gold Long-term Trend Analysis, Tips, & Chart

free commodity gold chart calls

As per the chart above, gold is trying to take a U-Turn. It can slip for 47460 – 46760 – 46260 levels.

As per the S-RSI, it will start running upside soon for the dynamic resistance level of 53900. Hence, targets: 49560 – 50000 – 52000 – 53000+

Don’t forget to keep your eyes on downtrend level 46260.

To become a subscriber, subscribe to our free newsletter services. Our service is free for all.

Continue reading

Zinc Trading Strategy & Tips with Hourly Chart

free commodity zinc tips chart

As per the above chart, the parallel channel’s uptrend line can use as a stop loss.

Hurdle: 162.6

Based on the current trend:
Uptrend targets: 165 – 170+

Based on Fib. Retracement:
Downtrend targets: 158.2 – 152.2 – 149.2

To become a subscriber, subscribe to our free newsletter services. Our service is free for all.

Continue reading

Gold & Aluminium Intraday Chart & Tips

free commodity gold chart calls

Gold’s Next Big Move

Gold has made a new high as per the last update based on Elliott wave theory. You can check the last updated chart: This GOLD Elliott Wave Will Confirm The Next Move

For intraday traders:
If that is a right shoulder, C (T1) and C (T2) are the next targets. S RSI is confirming the downtrend by crossover.

For the long-term investor (Hurdle Breakout):
T1: 47560
T2: 47260
T3: 47000

Invalid: Above 48400 OR Head.

free mcx aluminium tips

Aluminium Are Presenting A New Opportunity

To become a subscriber, subscribe to our free newsletter services. Our service is free for all.

Continue reading