NYMEX Brent Oil Futures – Simple Trading Strategy
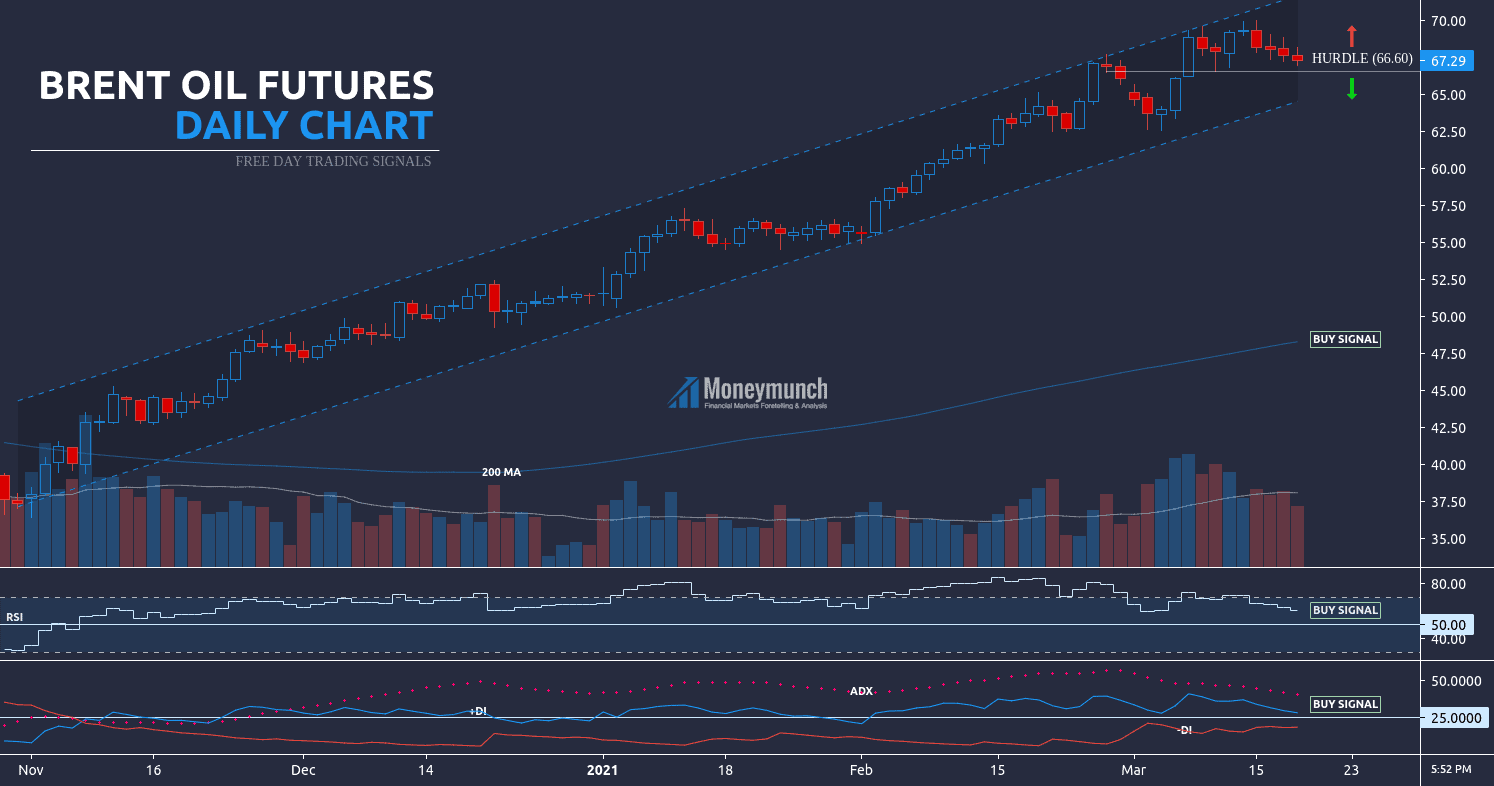
Here, I have used MA, RSI, VOL, & DMI to identify the next move of Brent Oil. According to these indicators, it seems bullish ahead. We may see the following targets soon: $68.8 – $69.8 – $71+
But, if brent oil breaks the hurdle ($66.60) and shows a closing price below it, we will see a heavy downfall. Targets: $64.6 – $62.8 and below
What about MCX Crude oil? It looks downward for a short period. Look at the below chart:
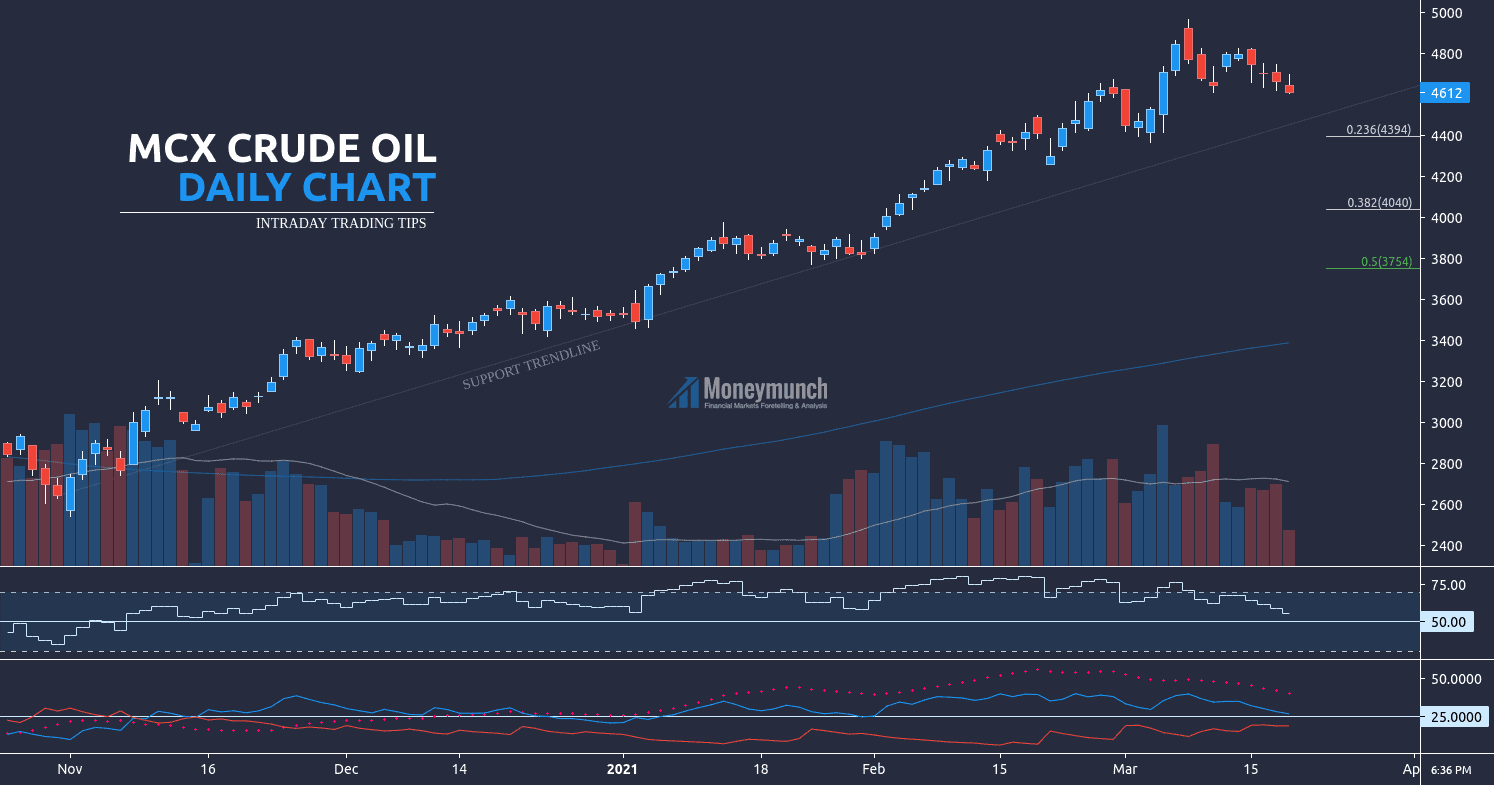
MCX Crude oil can go down for a retracement value of 0.236 in the upcoming days. So, intraday traders can set the following targets to make some money: 4560 – 4500 – 4460 – 4400
But, if brent oil breaks $66.60 upside, then change your position for the following targets: 4800 – 4880+ To become a subscriber, subscribe to our free newsletter services. Our service is free for all.