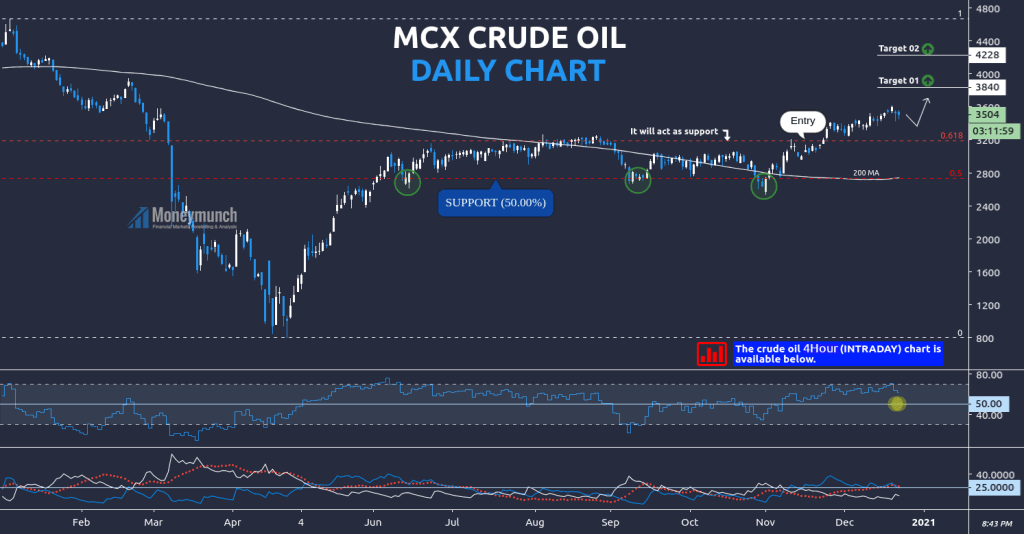
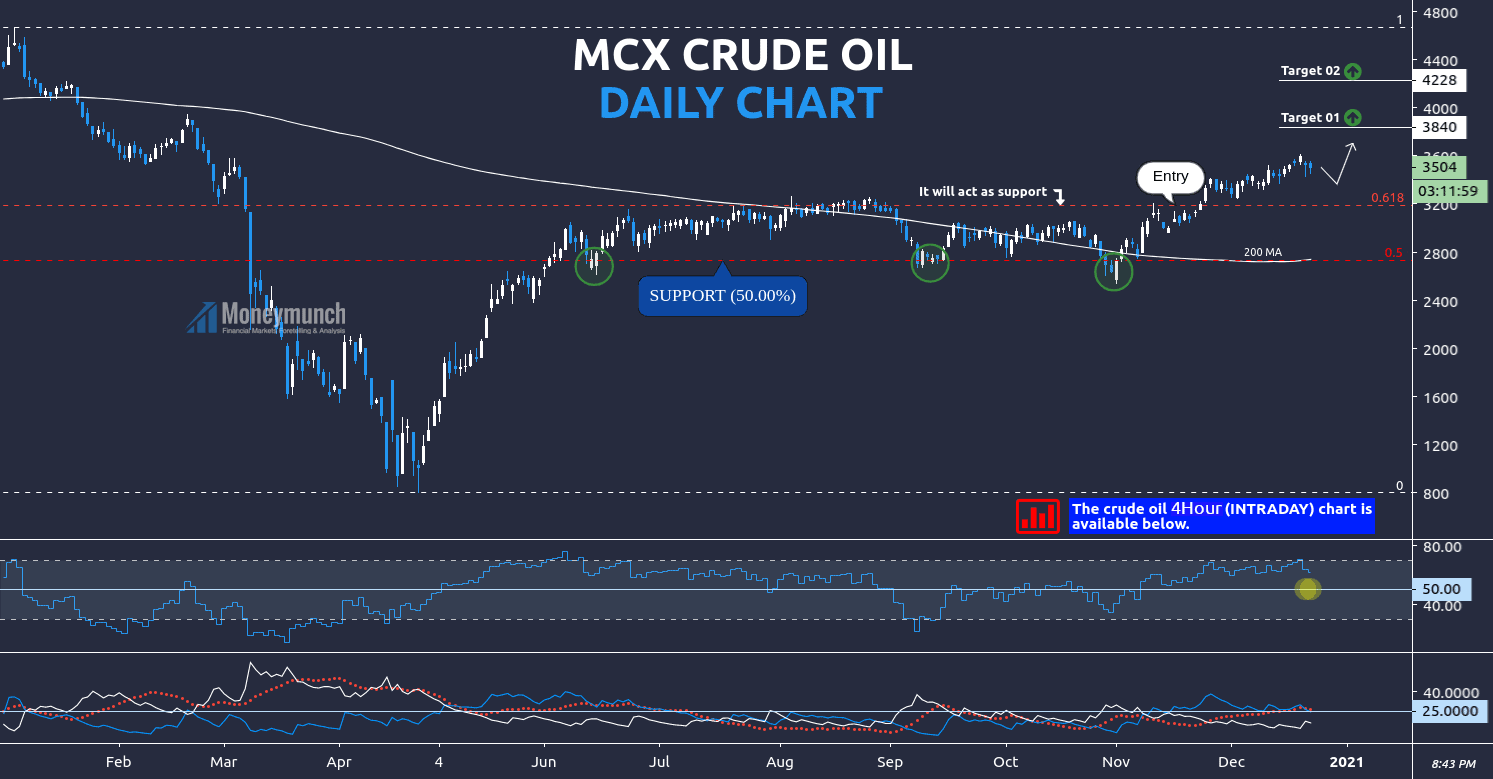
According to the daily chart of MCX crude oil, it is further advance for short-term investors. The retracement level of 0.618 is a perfect entry-level.
In the previous update of crude oil, we have recommended buying many times.
As per RSI & MA, it seems bullish . We will see soon target 1 and target 2 price after a short reversal.
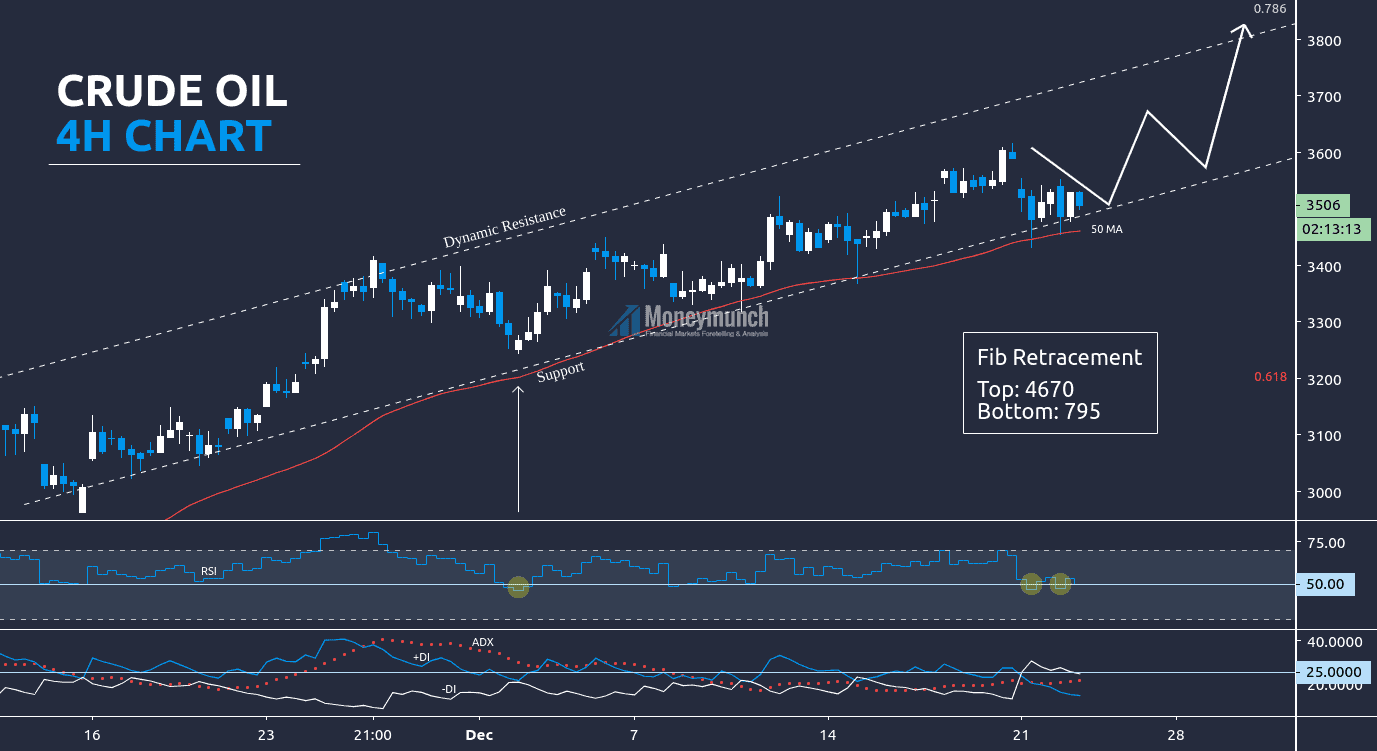
But if you want to see a clear trend, we’d see it in a 4 hours chart:
According to the 4H chart of MCX crude oil, it’s sharply moving upward. It’s safe for intraday & short-term traders to take a position nearby the support trendline or 50 MA for the targets of 3600 – 3660 – 3700 – 3800.
But what if it breaks the support trendline? DMI is indicating collapse ahead. How much crude oil can come down after breaking out the support trendline? To become a subscriber, subscribe to our free newsletter services. Our service is free for all.
Get free MCX ideas, chart setups, and analysis for the upcoming session: Commodity Tips →
Have you any questions/feedback about this article? Please leave your queries in the comment box for answers.


 Lock
Lock
I’m reading your articles for more than a year. I still remember you recommended to buy crude oil in March 2020 for 3260 – 3700 – 4000 levels. I have bought 10 lots and still holding them. Hats off to you sir
sir i paid 24500.
name: XXXXXXX XXXXXXXXXX
email [email protected]
mobile XXXXXXXXXX
start service. thanks
Your premium plan has been activated. Please check your mailbox.
Kindly use the Moneymunch mobile app to get instant support.