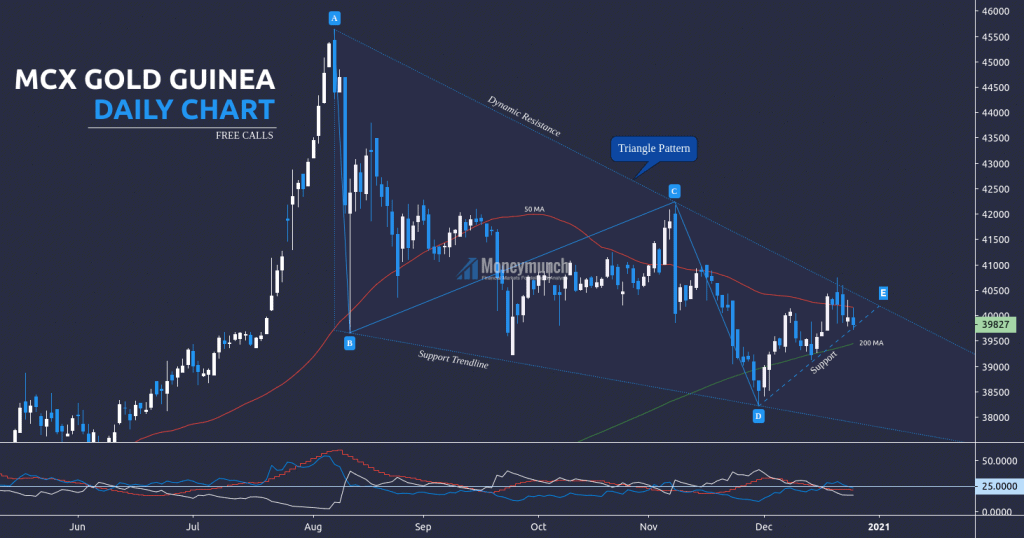
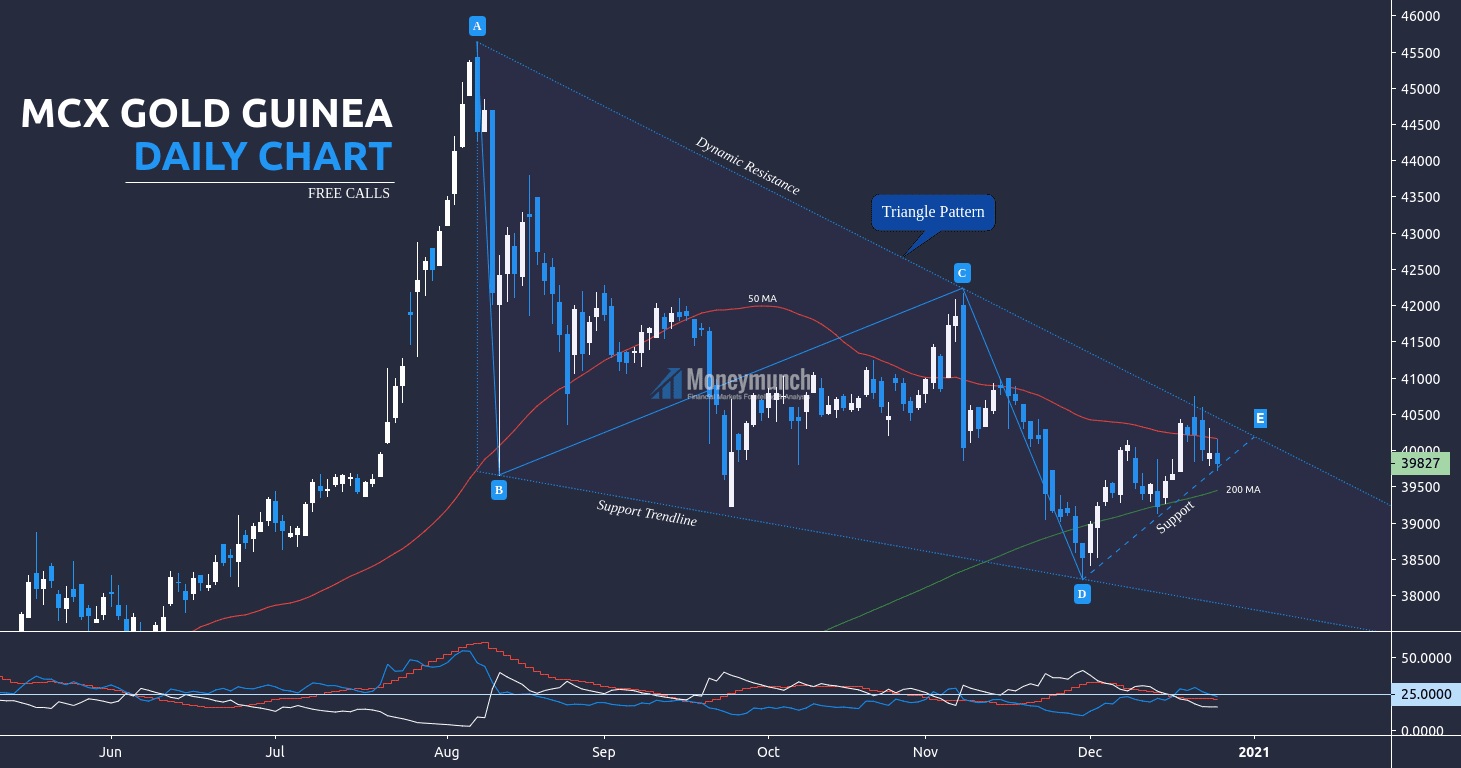
MCX Gold Guinea is making a triangle pattern. As per the ADX, the trend is weak and, +DI is above the -DI. That indicates an uptrend ahead. Additionally, 200 MA isn’t broken.
According to DMI & MA, we have chances to see 40260 – 40500+ levels.
But, if you look at the triangle pattern, it seems bearish. We have more chances to see downward (huge selling pressure) if it breaks the support line (dashed). And 50 MA is indicating the same.
Hence, once it breaks the support line, intraday traders can sell for the following targets: 39460 – 39260
To become a subscriber, subscribe to our free newsletter services. Our service is free for all.
Get free MCX ideas, chart setups, and analysis for the upcoming session: Commodity Tips →
Have you any questions/feedback about this article? Please leave your queries in the comment box for answers.


Excellent Prediction.
Hello, there your analysis is superb !!
Hi can u tell me should I buy Crude Oil
Pls tell me I am waiting for a reply