
When Will MCX Gold explode?

free commodity gold chart tips

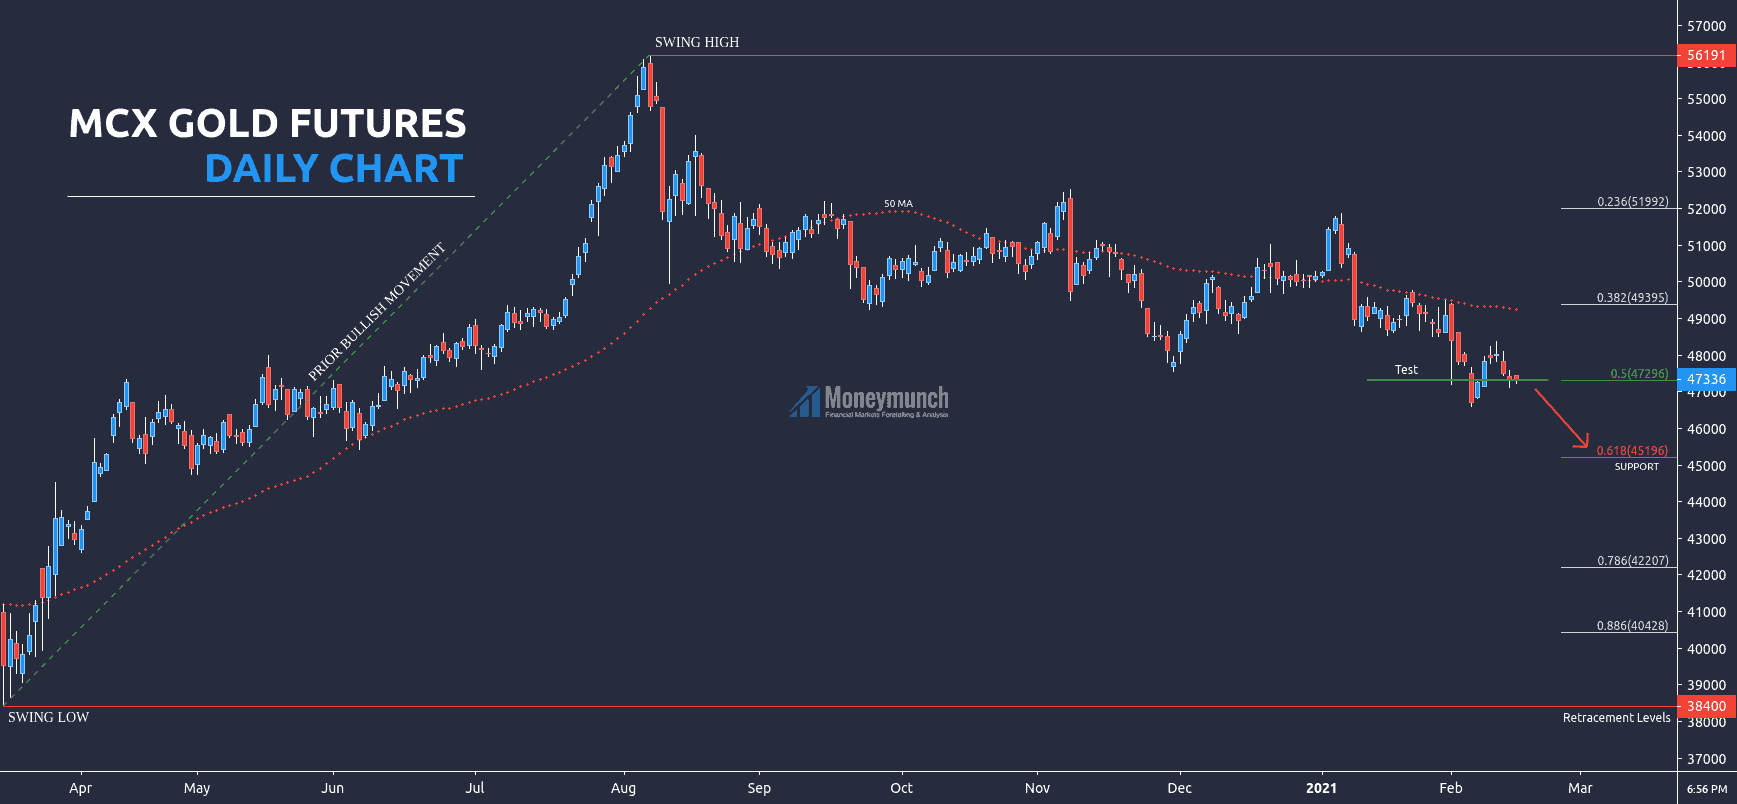
Main scenario: If gold remains below 47296 levels, it will come down to 0.618 value of Fib retracement.

Targets: 46860 – 46600 – 46000 – 45660 – 45200

Alternative scenario: If gold remains above 0.5, it may try to hit 0.382 (TP: 48260 – 49000+).

So, here hurdle is 47296 for the short-term traders. Intraday traders can play both sides.

And we may see a strong uptrend after hitting the support.

To become a subscriber, subscribe to our free newsletter services. Our service is free for all.

Continue reading
MCX CPO – Fifth Wave Rally Is Starting

free commodity cpo chart tips

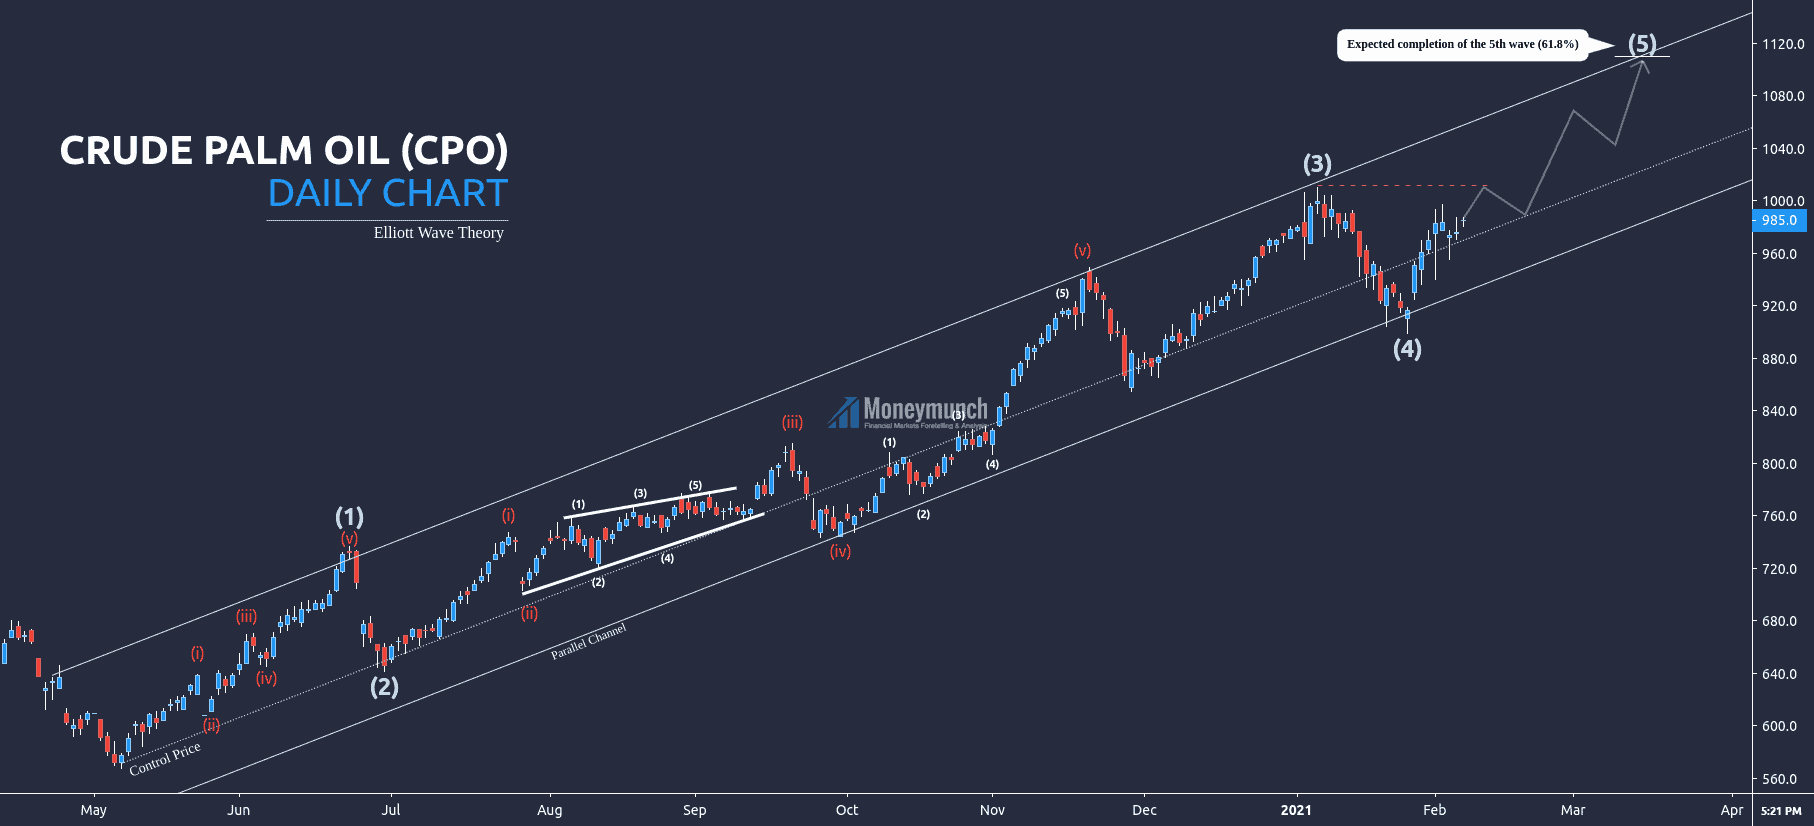
Main scenario: consider long positions from the control price or support trendline for the target level of 1000 – 1040 – 1080 – 1100 – 1110.

Analysis: Daily time frame – presumably, the crude palm oil has started an Elliott wave and made the 4th wave, and now it’s making a fifth wave. According to EWT, the fifth wave will be completed at 61.8% or 50% of Fib retracement 1+3.

Alternative scenario: breakout and consolidation below the support trendline will allow the CPO to continue declining to the levels of 880 – 760.

To become a subscriber, subscribe to our free newsletter services. Our service is free for all.

Continue reading
MCX Nickel – Parabolic Curve Pattern & Tips

free commodity nickel weekly chart tips

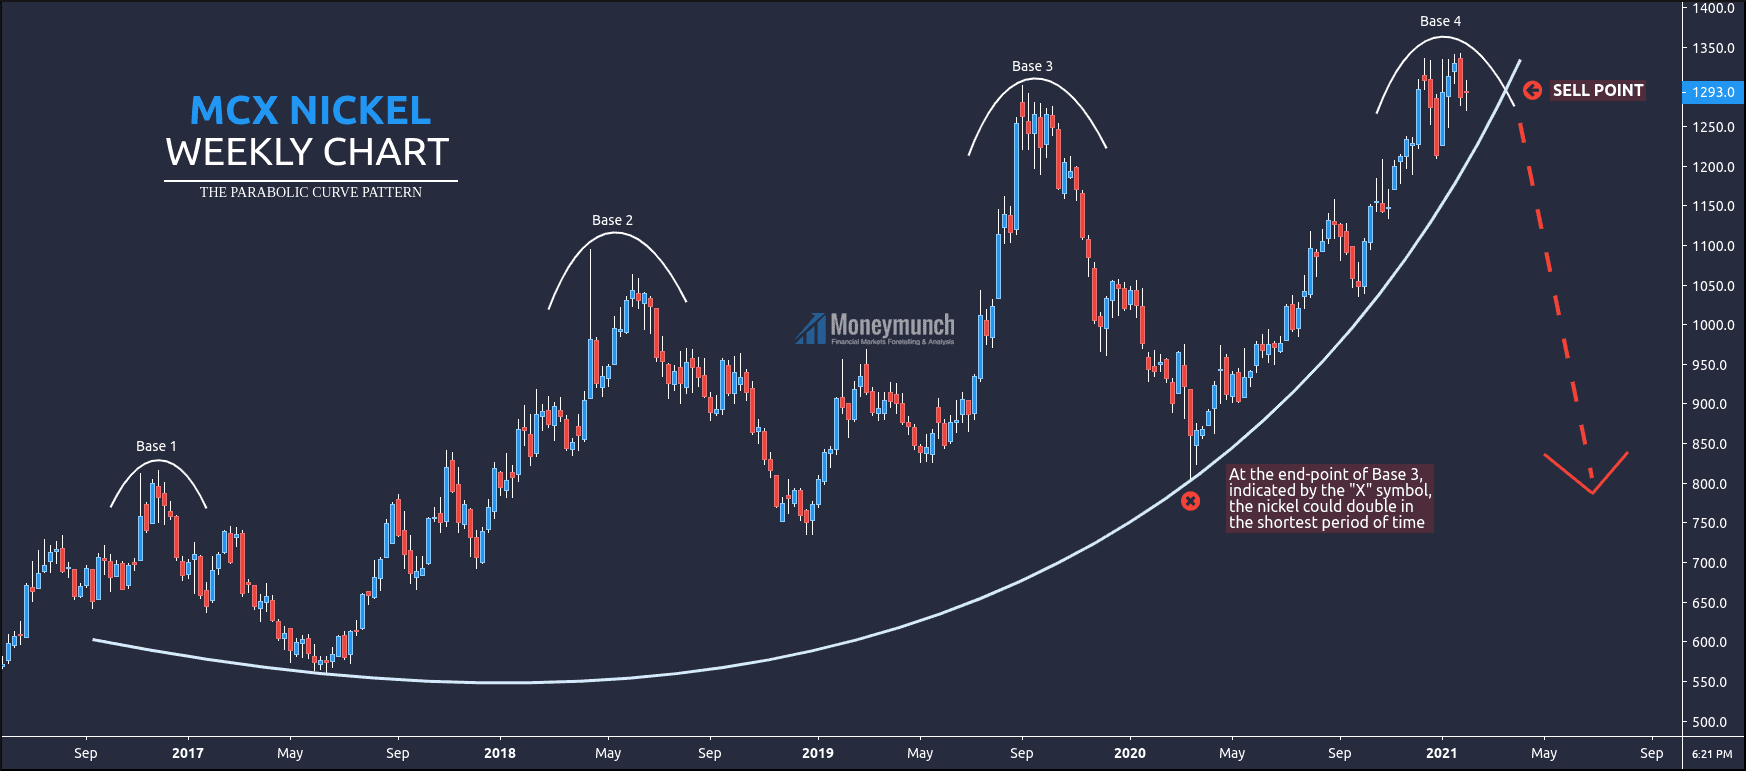
This is MCX Nickel weekly chart. Price projection is based on Parabolic Curve & Fib Retracement.

As mentioned in the chart, At the end-point of Base 3, indicated by the “X” symbol, the nickel could double in the shortest period of time. Targets: 1426 – 1632 – 1778 – 1854 – 1962 (2.618Based on Fib Retracement).

If nickel breaks the curve line, it can collapse up to “X” or base 3 deep. Hence, we can see the following targets from the selling point: 1130 – 1050 – 960 – 850 and below.

Remember, trade with the direction of the breakout. And stop-loss above/below breakout level.

To become a subscriber, subscribe to our free newsletter services. Our service is free for all.

Continue reading
Silver Price 2021 Roadmap

free commodity silver daily chart tips

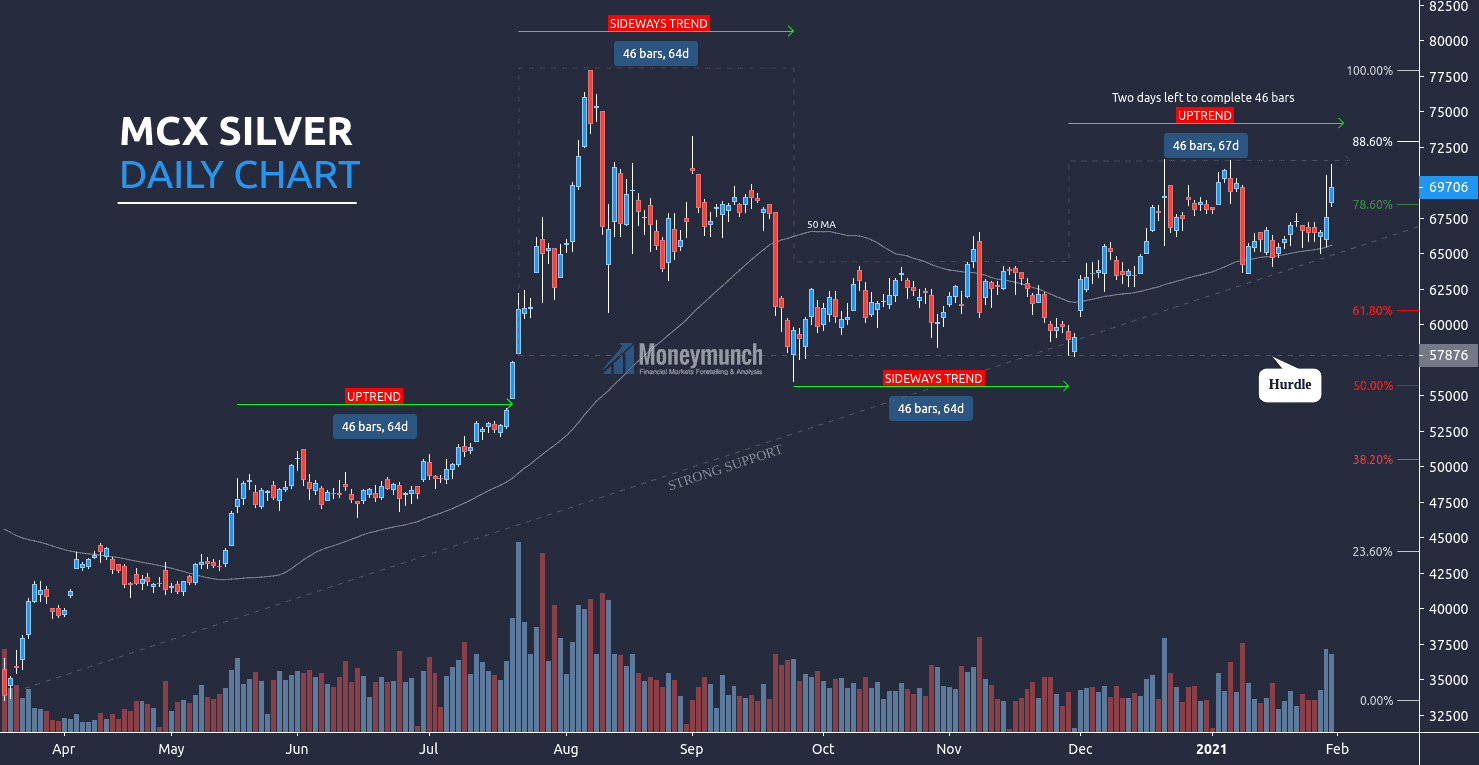
According to the date range on MCX Silver daily chart, it’s changing the trend after every 46 bars.

If silver does not crossover 88.60% of fib retracement before completing 46 bars, we may expect a downtrend ahead. It can collapse up to 61000 to 55765. Here, targets for intraday traders: 67500 – 65600 – 63660

Or if it breaks the 88.60%, then silver will make a new high. And it will start raising & hit the following levels: 75000 – 77000 – 80000+

To become a subscriber, subscribe to our free newsletter services. Our service is free for all.

Continue reading

Crude oil is bearish near-term – Elliott wave analysis

free commodity crudeoil chart tips

The crude oil started the bullish Elliott wave on the 4-hour timeframe. A new low, followed by a three-wave recovery to roughly 3760 – 3660 – 3470 can be expected before the uptrend resumes.

If there will be the upside breakout of wave 5 (Protective Stop: 3980), then it’s a failure of the Elliott wave pattern. What happens if it breaks wave 5? I will update it in my next post.

To become a subscriber, subscribe to our free newsletter services. Our service is free for all.

Continue reading
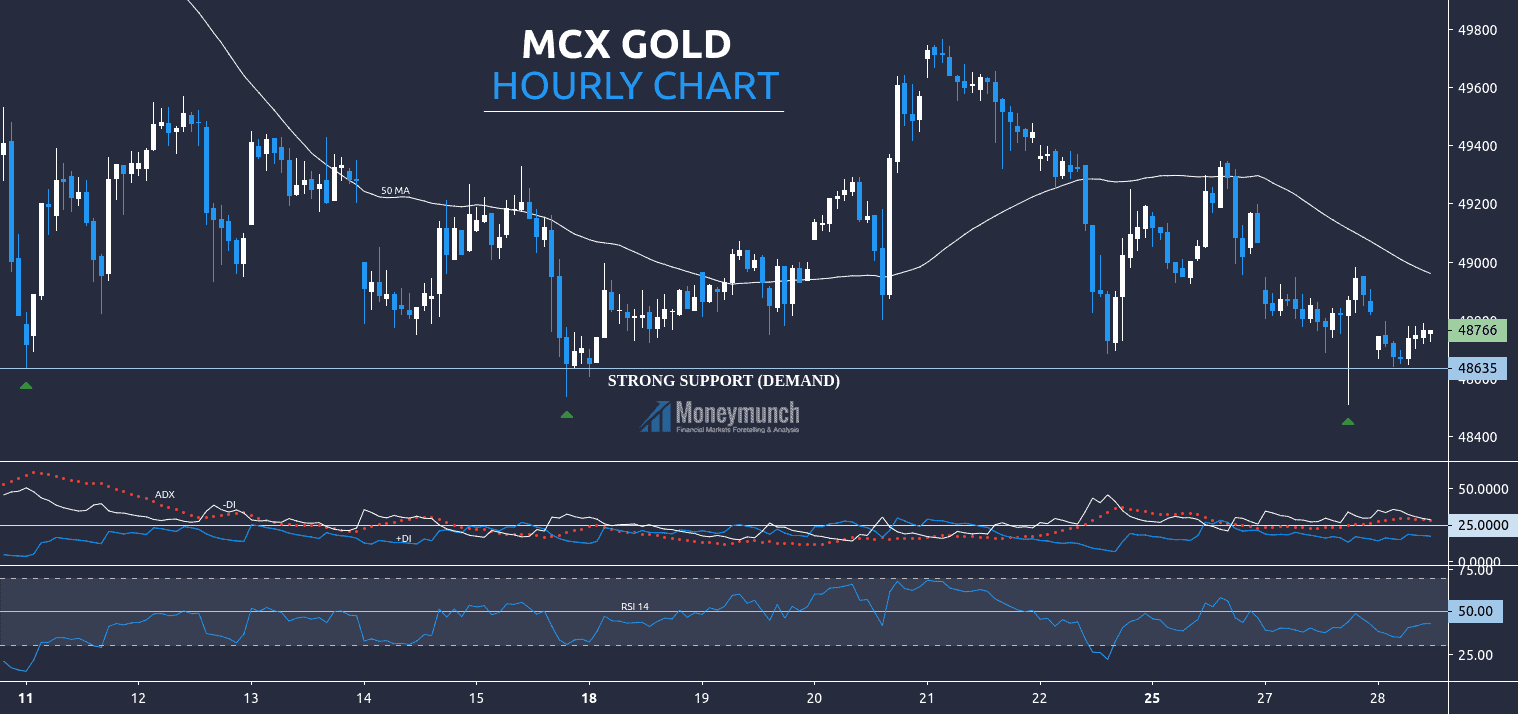
MCX Gold Trading Strategy for Intraday Traders

free commodity gold tips chart

Gold is taking reversal from the strong support (SS) level (48635). And at present, it’s very close to the SS. Can we see a reversal again?

If gold remains above SS, then it can touch the following levels: 49000 – 49200 – 49400

But according to RSI, MA, & DMI, it seems in a downtrend. So, if MCX gold breaks the support level, we may see the following targets: 48460 – 48260 – 48000

To become a subscriber, subscribe to our free newsletter services. Our service is free for all.

Continue reading