
Technical Outlook
- Bajaj Finance is approaching an important Fibonacci resistance zone. A breakout may extend the recovery, while rejection could trigger the next corrective decline.
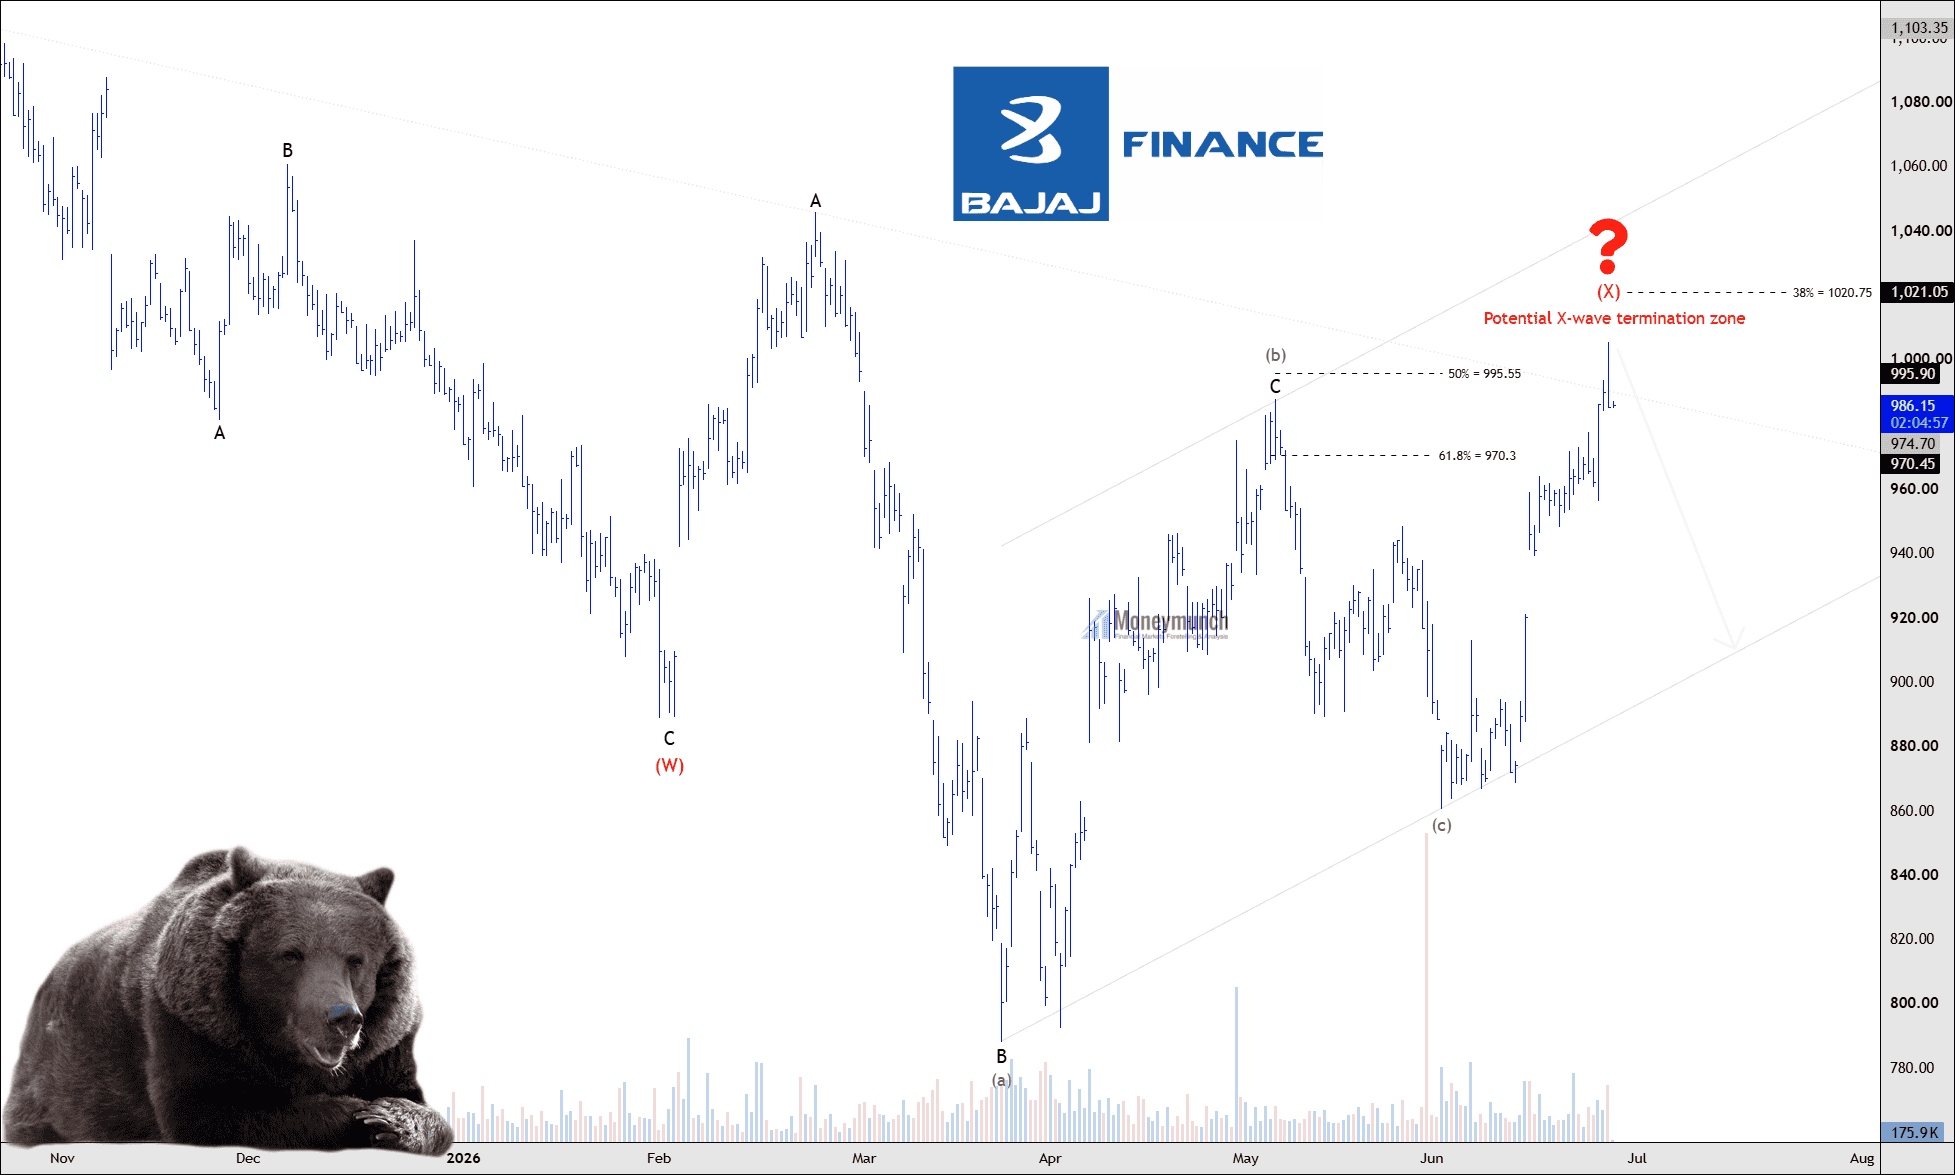
Bajaj Finance has shown a strong recovery after finding support near the March-April lows. The stock has continued to trade above its recent swing low and is making higher highs and higher lows on the 4-hour chart, indicating that short-term buying momentum remains positive.
According to the current Elliott Wave structure, the previous decline appears to have completed a corrective Wave (W). Since then, the stock has been developing another corrective recovery, which is likely forming a connecting X-wave. This suggests that the current upward move may still have some room before the next major directional move begins.
The recent breakout above the 61.8% Fibonacci retracement level has strengthened the short-term bullish momentum. Buyers are currently attempting to push prices towards the next important resistance zone.
Trading Strategy
 Unlock This Article
Further updates on Bajaj Finance, including detailed price levels and trading strategies, are shared above for Premium Subscribers. To receive timely trading alerts and market updates during trading hours, subscribe to our Premium service
Get free important share market ideas on stocks & nifty tips chart setups, analysis for the upcoming session, and more by joining the below link: Stock Tips
Have you any questions/feedback about this article? Please leave your queries in the comment box for answers.
Someone give me the trading strategy access password
I will join 😃
Is it making a new X?
Yes, Forming a new (X).
I have been following your blogs for over three years. First of all, hats off to your hard work. Can I pay plan fees through SBI Yono UPI?
Yes, you can make the payment using it. Further information has been sent to your mailbox. And thank you for your feedback!