Discover our category for free expert commodity trading tips and insights on Indian MCX, NCDEX, and COMEX markets. Expand your knowledge with our collection of educational articles and research reports to enhance your trading skills.
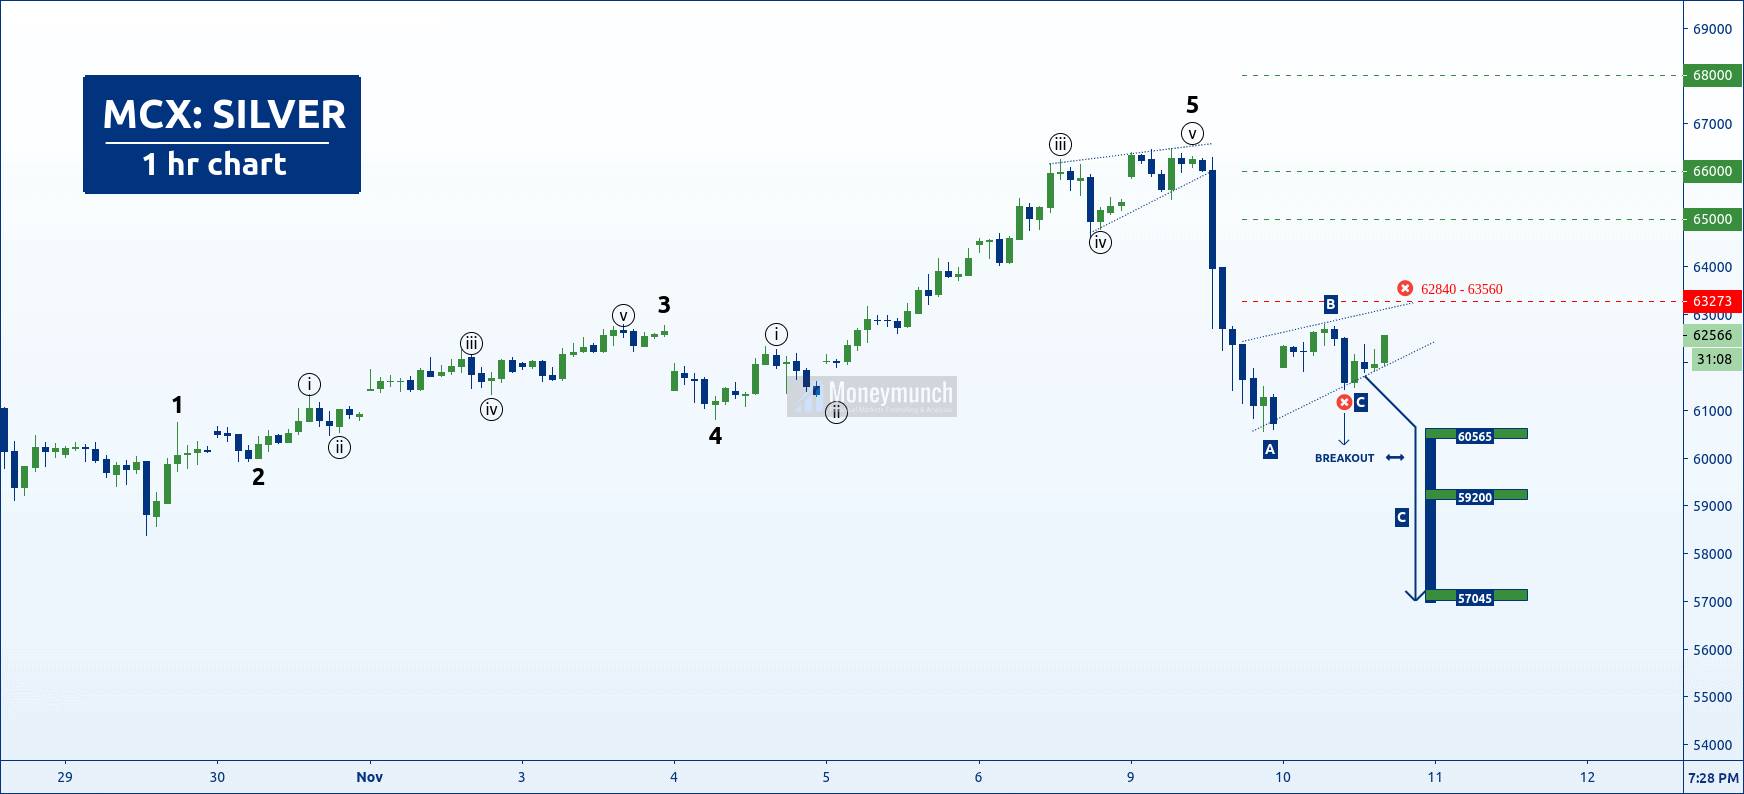
Silver made a bullish Elliott wave. The fifth wave is including a diagonal. After the fifth wave, there is an ABC correction. Silver can move upside to 62840 – 63560 levels.
Expected C range: 60565 – 59200 – 57045
The correction will over at 63560 to change the current trend. And upside rally will resume for the levels of 65000 – 66000 – 68000+. To become a subscriber, subscribe to our free newsletter services. Our service is free for all.
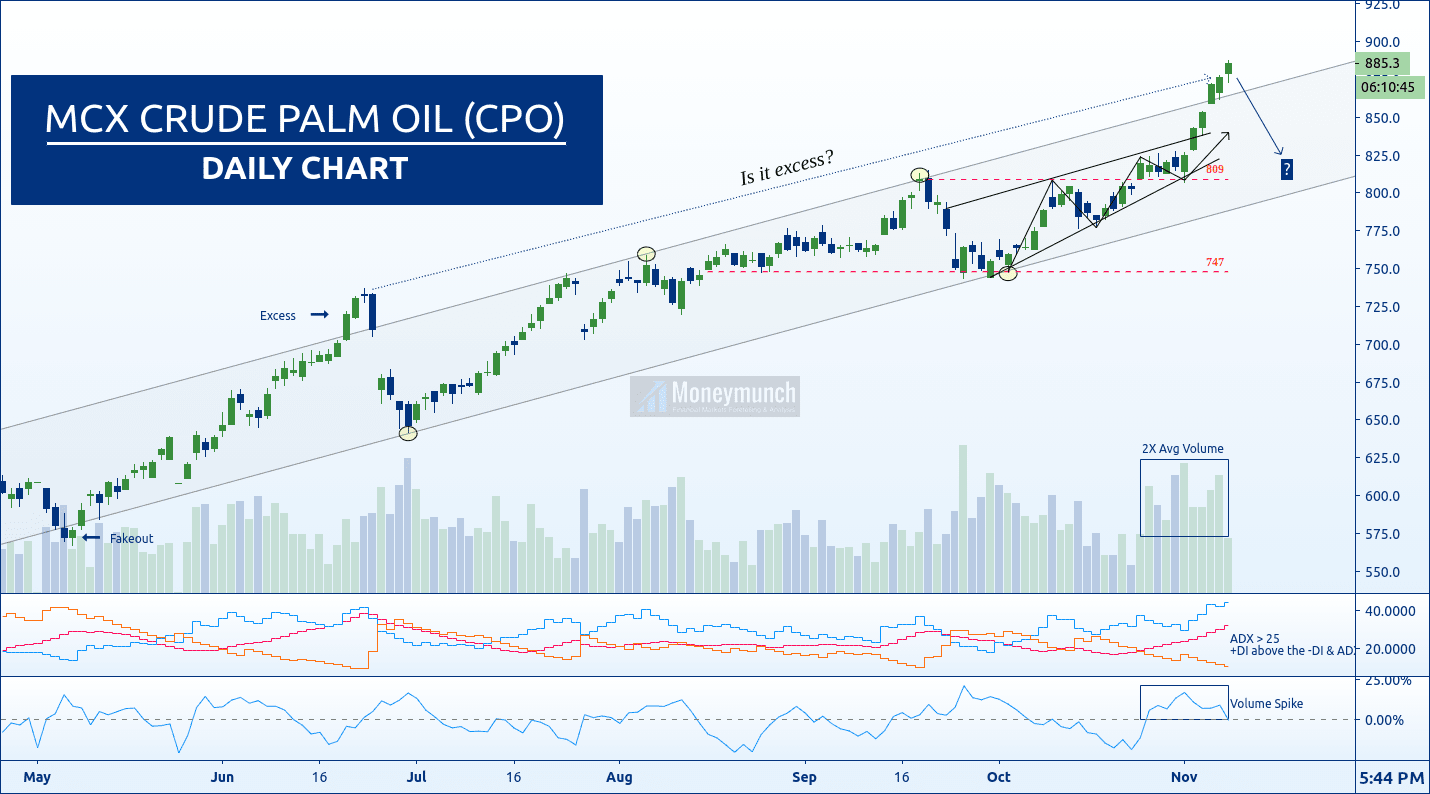
Currently, MCX Crude Palm Oil (CPO) shows an uptrend. By following the ADX, we can say that the trend will rise because ADX is greater than 25 (ADX>25), and +DI is above the -DI. Let’s have a look at the volume. Volume spikes double of the average, so this also shows an uptrend, and it will go to the 900 – 920 – 960+.
Right now, the trend is crossing the parallel channel. If it is excess, then Crude Palm Oil will start to fall to the following targets 836 – 810. It can be said by following the parallel channel.
To become a subscriber, subscribe to our free newsletter services. Our service is free for all.
Gold has started rising from U.S. Presidential Election. I have said in the previous newsletters, bullion sector commodities are strongly bullish. How many of you bought Gold and Gold Guinea?
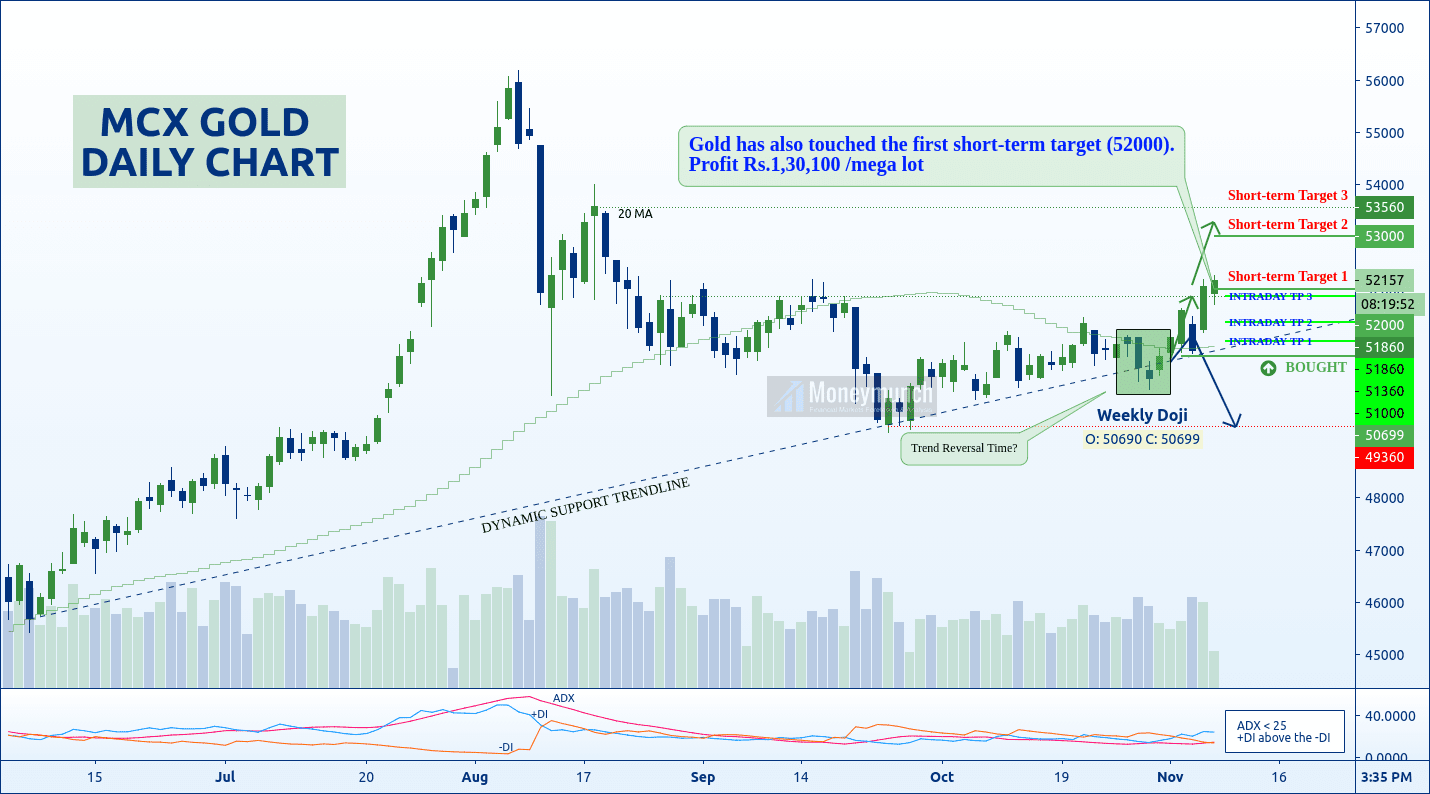
I had written for the intraday traders that, “…the day traders can follow the following targets: 51000 – 51360 – 51860+ And short-term investors can hold for 52000 – 53000 – 53560+ levels”.
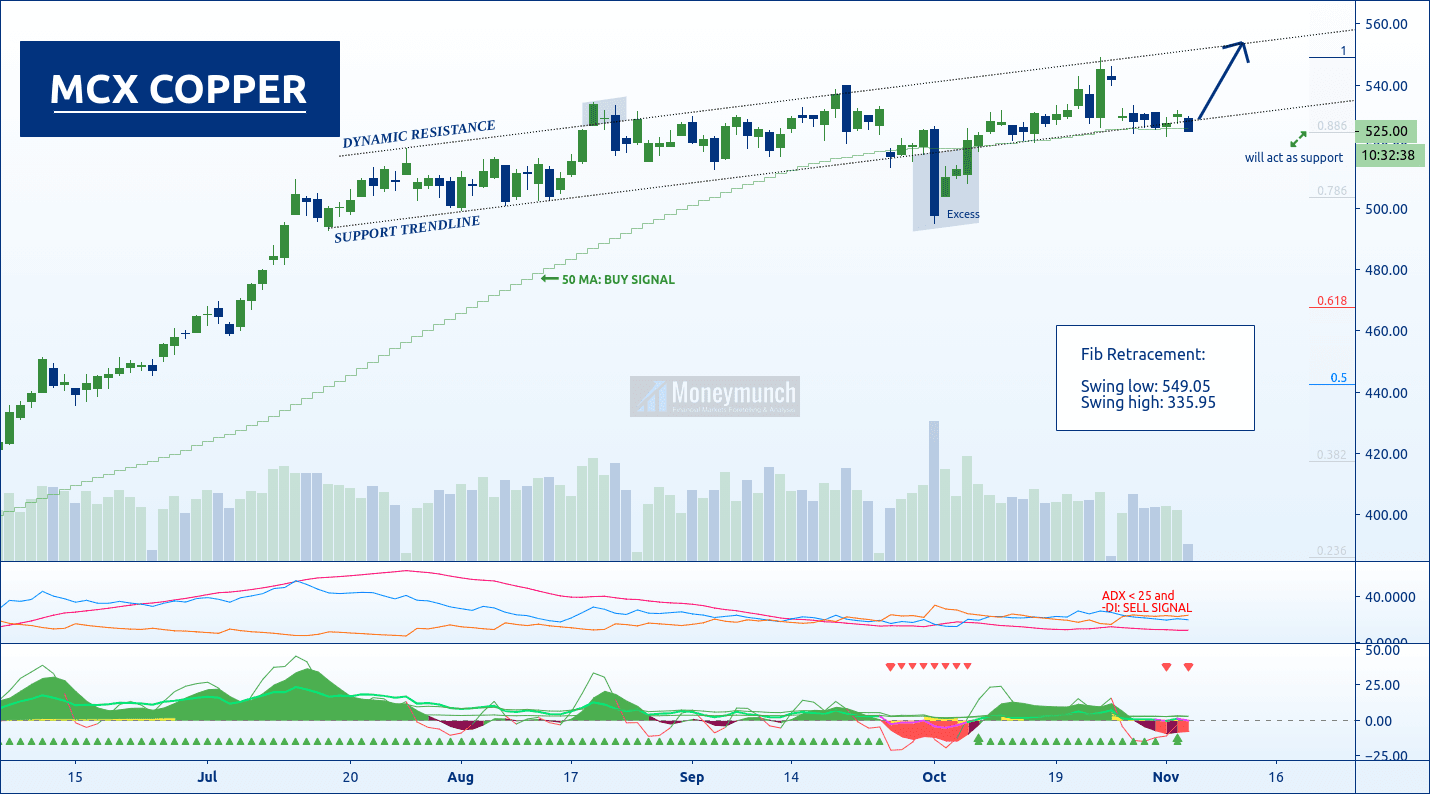
MCX Copper is playing under a parallel channel. Currently, it’s at the support trendline. Additionally, there’s a Fibonacci retracement value of 0.886.
The best trading strategy for the day traders is: According to a moving average and parallel channel’s support trendline, copper is strongly bullish. It can show us an all-time new high before the end of this month. So, the day traders can buy for the levels of 536 – 540 – 556+.
Important – Due to the election of the USA. From where it starts collapsing? You can sell the copper at/below parallel channel or Fib retracement value 0.886 for the targets of 516 – 506.
MCX Gold Guinea price setting up for a big rally
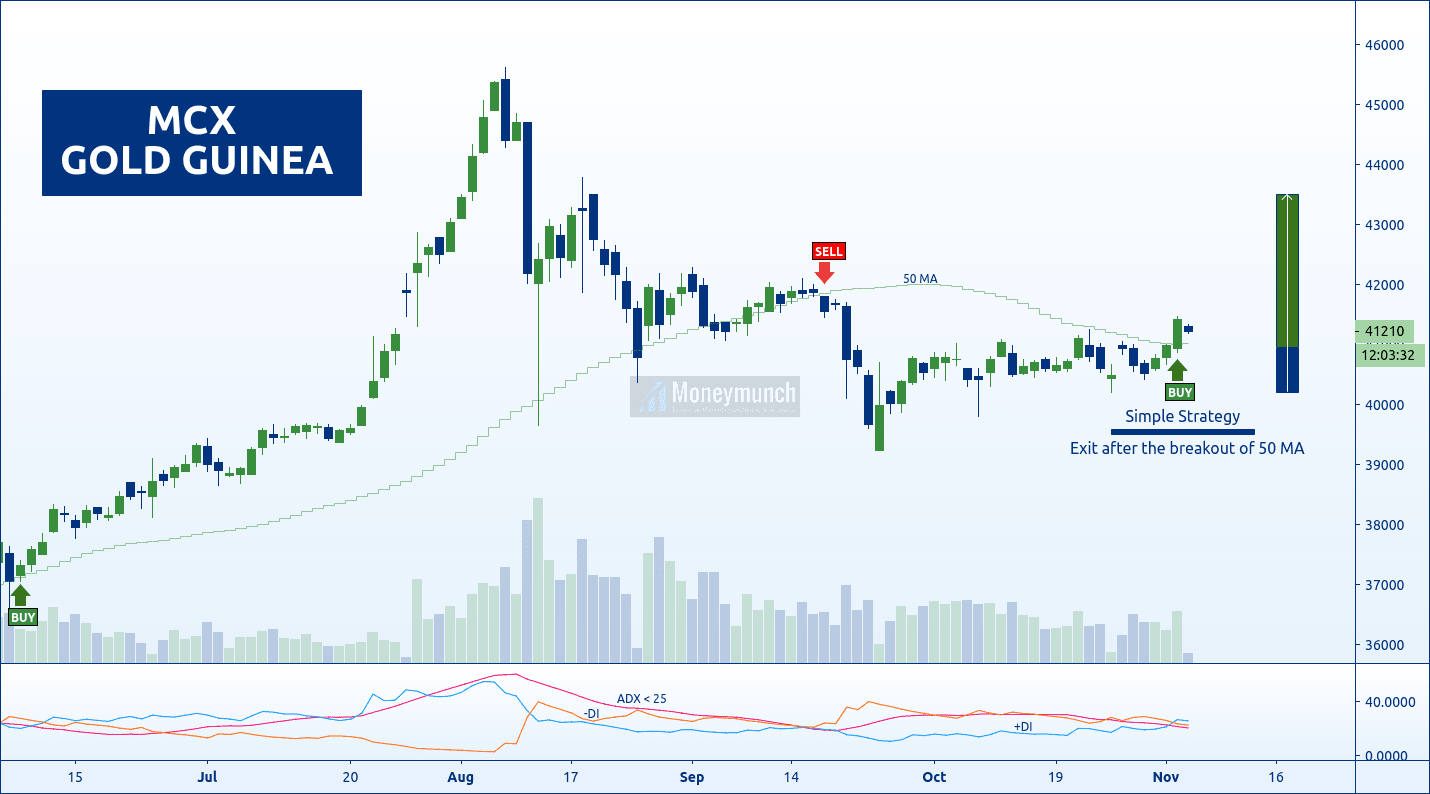
U.S election results will come soon. Today, we have chances to see solid movements in MCX’s bullion sector commodities. And Gold Guinea crossed 50 MA upper side.
Intraday & short-term traders can buy using this strategy to make some money. Targets: 41800 – 42200 – 43000+
If it closes below 50 MA, then don’t hold your position in loss. I prefer to exit after it.
Do you want to know about MCX Gold? Gold has touched the first two intraday targets:Click Here to Read Now
To become a subscriber, subscribe to our free newsletter services. Our service is free for all.
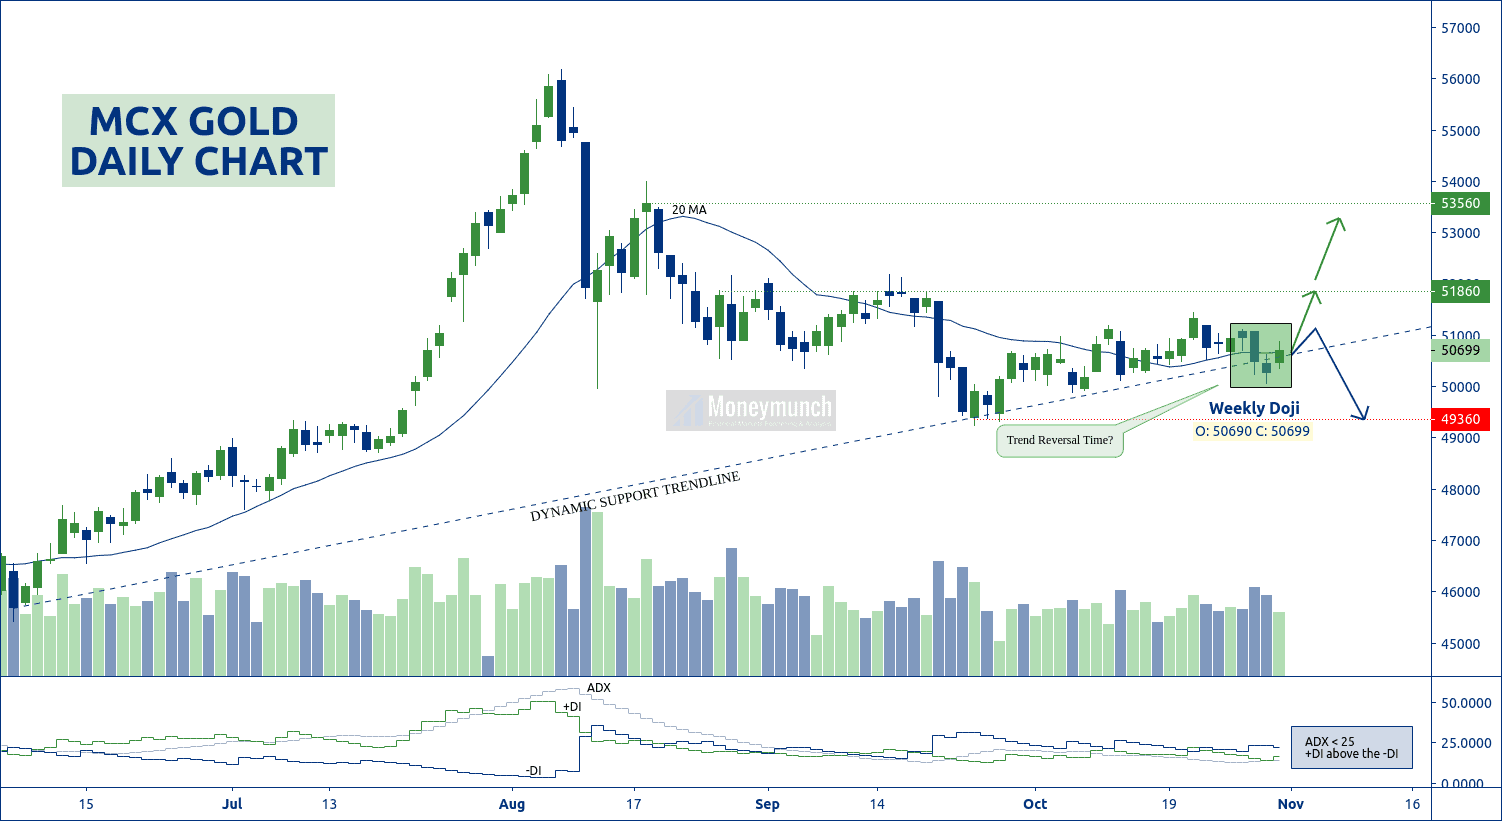
Gold has made a Doji in the weekly chart. It’s a direct sign of a reversal. And wherein ADX is less than 25 but +DI above the -DI. Additionally, the 20 MA line is trying to stay downside.
In short, DMI & MA is throwing a strong upward signal. Moreover, its volume is increasing. This week, we have chances to see gold prices above the 51860 levels. The day traders can follow the following targets: 51000 – 51360 – 51860+
And short-term investors can hold for 52000 – 53000 – 53560+ levels.
All you need to do is watch out for a dynamic support trendline. It should remain above it. Else, it will start falling. And that downfall for the levels of 50000 – 49600 – 49360.
Significant releases or events that may affect the movement of gold & crude oil: Monday, Nov 02, 2020
11:00 – Gold Index
Tuesday, Nov 03, 2020
05:30 – U.S. Presidential Election
Wednesday, Nov 04, 2020
02:00 – U.S. API Weekly Crude Stock
21:00 – U.S. Crude Oil Inventories
Crude Oil Price Setting Up For A Downside Price Rotation
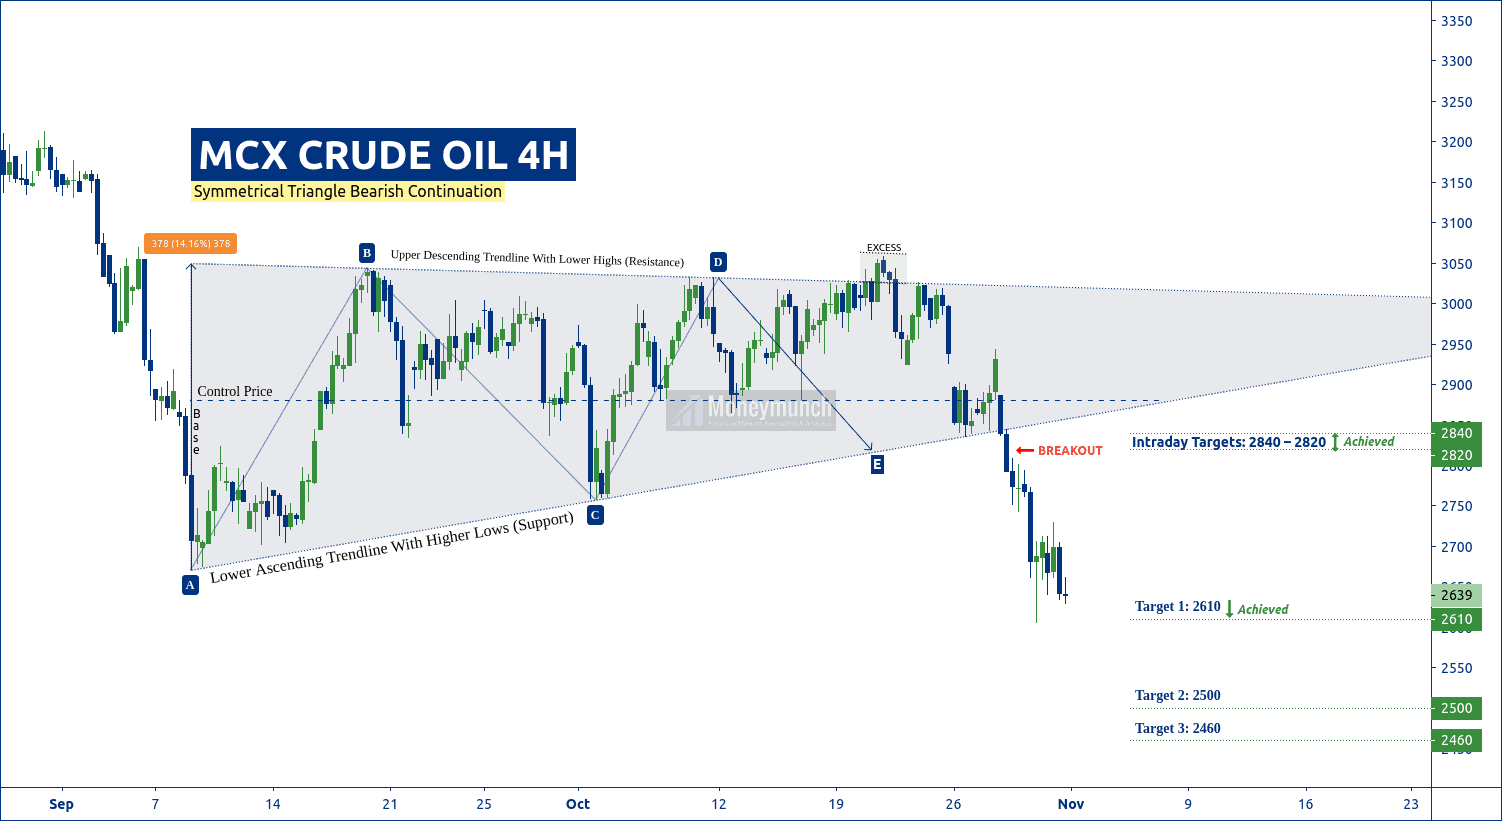
First, let’s talk about the previous update of crude oil . There, I have drawn the symmetrical triangle bearish pattern on the hourly chart of MCX’s crude oil.
I had written for the day traders, “…the last expected stop is at E. So, we may see crude oil at/below 2840 – 2820 level”.
THESE TARGETS HAS REACHED.
And for the short-term traders, I had written in bold words, “this symmetrical triangle base range is 378 points. So, the game will begin whenever crude oil will break out the triangle pattern . Downward breakout’s targets: 2610 – 2500 – 2460“.
Crude oil has touched the first target (2610) by making a low of 2606 level on 29 Oct ’20. Now let’s come to the point, will crude hit the second & last target or not?
CRUDE OIL DOWNSIDE BREAKOUT ALERT! If crude oil prices break out the 2600 level, we will see 2540 – 2500 – 2460 levels before the weekend.
Please note that don’t sell it above the 2600 level.
To become a subscriber, subscribe to our free newsletter services. Our service is free for all.
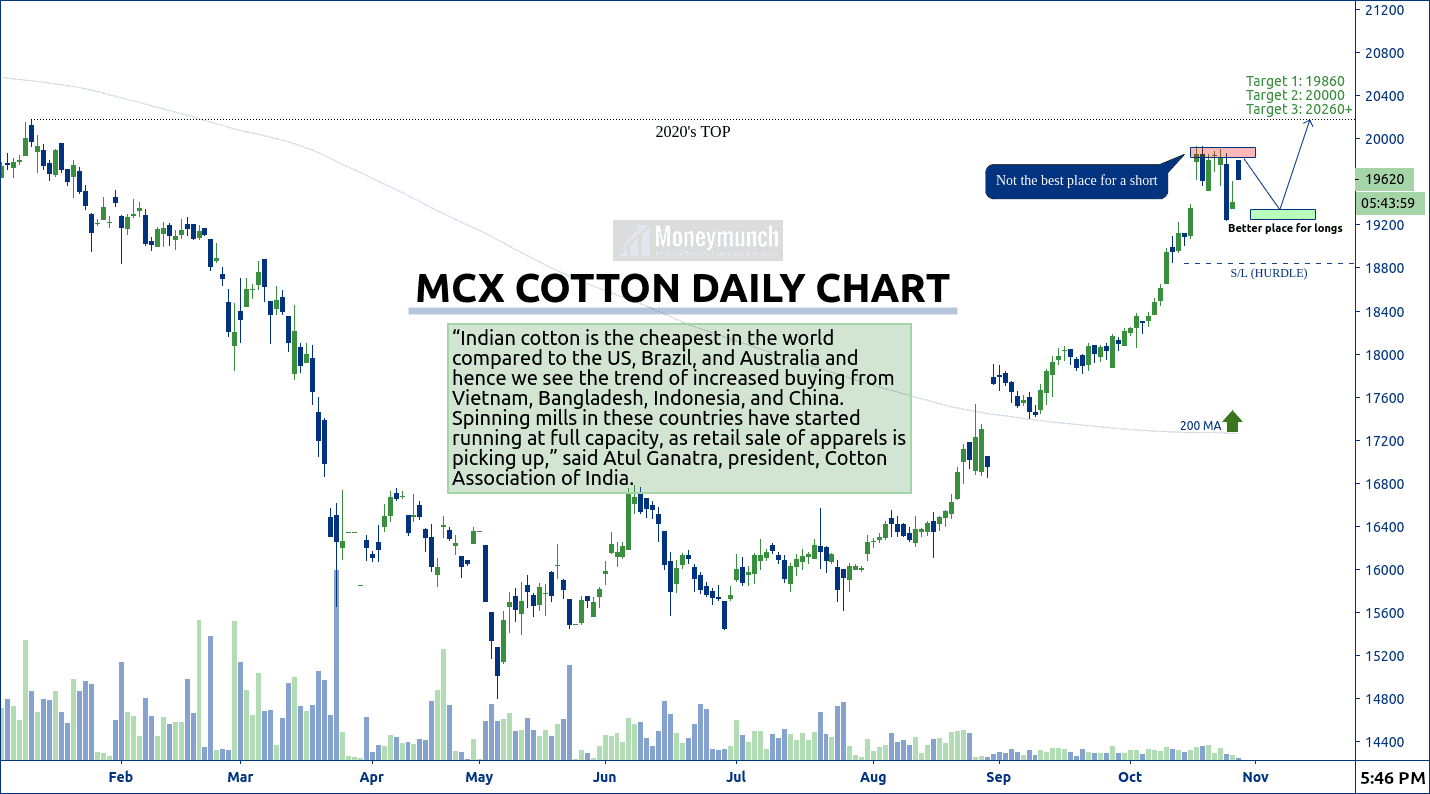
According to fundamental research, MCX (NCDEX) cotton seems strongly bullish ahead. The short-term investors can start buying cotton nearby highlighted area for the targets of 19860 – 20000 – 20260+.
To become a subscriber, subscribe to our free newsletter services. Our service is free for all.