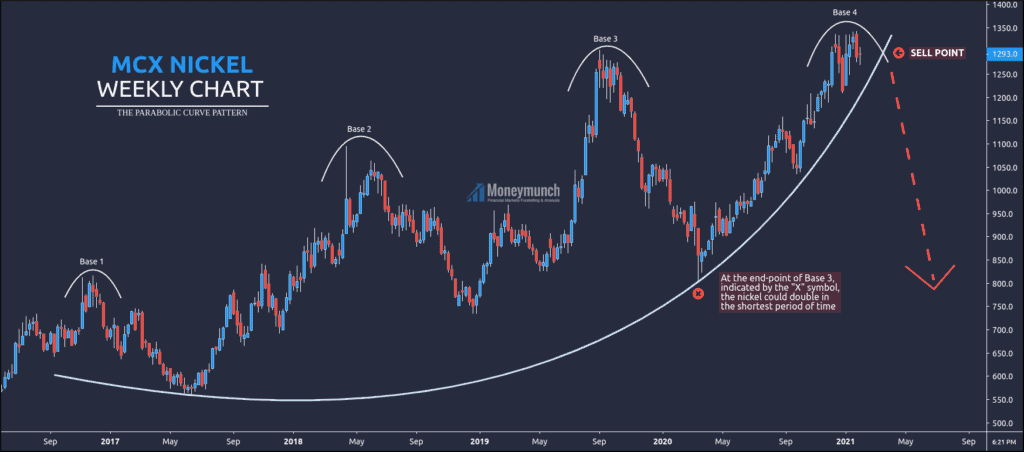
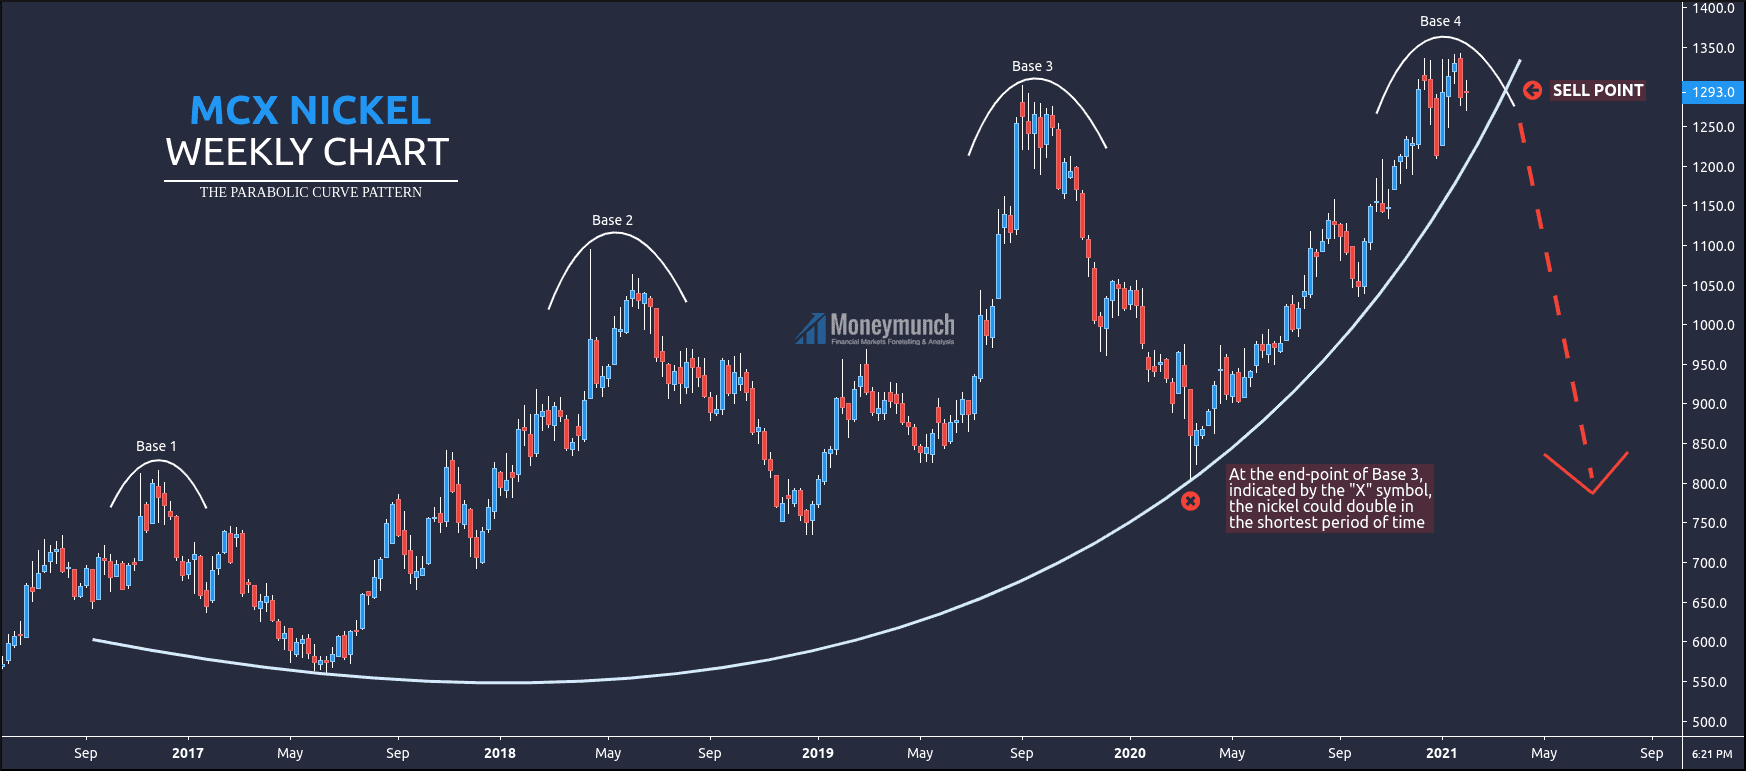
This is MCX Nickel weekly chart. Price projection is based on Parabolic Curve & Fib Retracement.
As mentioned in the chart, At the end-point of Base 3, indicated by the “X” symbol, the nickel could double in the shortest period of time. Targets: 1426 – 1632 – 1778 – 1854 – 1962 (2.618 – Based on Fib Retracement).
If nickel breaks the curve line, it can collapse up to “X” or base 3 deep. Hence, we can see the following targets from the selling point: 1130 – 1050 – 960 – 850 and below.
Remember, trade with the direction of the breakout. And stop-loss above/below breakout level.
To become a subscriber, subscribe to our free newsletter services. Our service is free for all.
Get free MCX ideas, chart setups, and analysis for the upcoming session: Commodity Tips →
Have you any questions/feedback about this article? Please leave your queries in the comment box for answers.