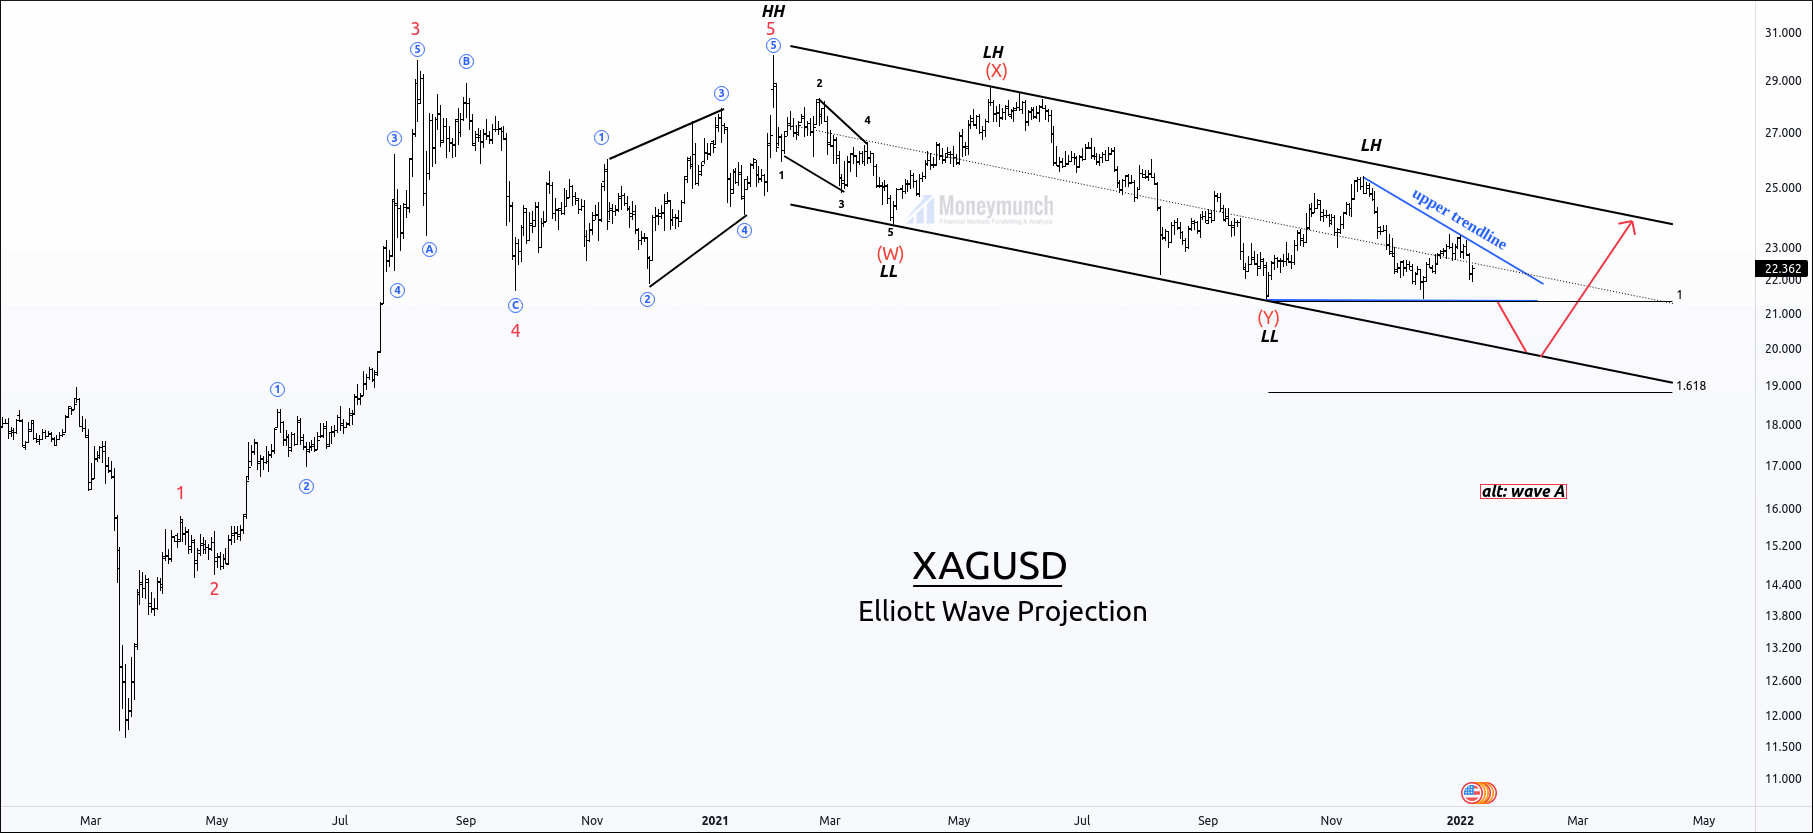
Is Natural Gas Ready to Complete a “Head and Shoulders”?

free commodity naturalgas chart tips

Natural gas started to make the head and shoulders pattern on the daily timeframe. First, let’s understand some basics about the head and shoulders pattern. Here, it’s a bearish head and shoulders pattern. In this pattern, the trend starts with the uptrend and makes the left shoulder, head, and the right shoulder. And after the completion of the right shoulder, it falls by breaking the neckline.

In this chart, the trend completed the left shoulder, and the head is almost there. And then it will create the right shoulder. It will fall up to the neckline to complete the formation of the head. And the targets to reach the neckline are as following, 180 – 175 – 168.

After hitting the neckline, the next step of natural gas will be the right shoulder. As per the rules, the right shoulder can be similar to the left shoulder or, it can be at a higher level than the left shoulder. Because the left shoulder is at 203, the trend will march again to 203 to make the right shoulder. To reach 203, natural gas will hit 180 – 190 – 200.

And then the trend will take reversal and fall by breaking the neckline.
Targets: 195 – 185 – 175.

To become a subscriber, subscribe to our free newsletter services. Our service is free for all.

Continue reading

MCX Gold 2021’s Supercycle

free commodity gold daily chart tips

MCX Gold is collapsing after making the all-time high of 56191 (swing high). It has created a parallel channel in December. Gold prices are rising here. If gold breaks the dynamic resistance without fakeout, it can touch 51000 – 52000 – 52384 levels at the beginning of 2021.

And if gold breaks the parallel channel and retracement value of 0.618, it will become unstoppable and hit the following levels: 48800 – 47800 – 47296 – 46000 – 45196

To become a subscriber, subscribe to our free newsletter services. Our service is free for all.

Continue reading

MCX SILVER – MA, EMA, & DMI [Buy Now]

free commodity silver 15m chart tips

Silver has broken the dynamic resistance & triangle formation. According to MA, EMA, & DMI, silver will run to reach 68800 – 69000 levels.

It will start falling after breaking the hurdle/support line. How much? 68000 – 67600 below.

To become a subscriber, subscribe to our free newsletter services. Our service is free for all.

Continue reading

Should you sell Gold now?

free gold 15m chart calls

This is MCX Gold 15 minutes chart (Heikin Ashi). It is bouncing from the hurdle (support). And if we look at the Gold Spot, the RSI is bullish and calls for further upside. Hence, MCX traders can buy for the following targets: 50060 – 50120 – 50200.

According to MA, EMA, and DMI, it’s bearish. If it remains below to hurdle, intraday traders must sell it for the targets of 49860 – 49800.

To become a subscriber, subscribe to our free newsletter services. Our service is free for all.

Continue reading

MCX Zinc & Lead Tips & Elliott Wave View

free commodity lead chart tips

MCX Lead Short-term Cycle Shows Big Trend

It’s the daily chart of the lead. Here, it has made the bullish Elliott pattern, and the ABC correction was completed on the 24th of December 2020. And right now, it started to move upside as per the rules of the bullish Elliott wave pattern. And it will move upwards till 158.6 – 162.

free mcx zinc tips chart

MCX Zinc Will Touch 240 by EWT

Here’s the daily chart of the MCX zinc. It has made two Elliott waves. The first one is bearish, and the second one is bullish. The bearish was started from the 11th of April 2019 and ended on the 19th of March 2020. The bullish one started on the 19th of March 2020, and the fifth wave of this Elliott wave is remaining. In the Elliott wave theory, each wave has five sub-waves.

Short-term investors can see the following levels soon: 228 – 234 – 240.

To become a subscriber, subscribe to our free newsletter services. Our service is free for all.

Continue reading

What’s Next for MCX Gold Guinea Price Trend Forecast

free commodity goldguinea daily tips chart

MCX Gold Guinea is making a triangle pattern. As per the ADX, the trend is weak and, +DI is above the -DI. That indicates an uptrend ahead. Additionally, 200 MA isn’t broken.

According to DMI & MA, we have chances to see 40260 – 40500+ levels.

But, if you look at the triangle pattern, it seems bearish. We have more chances to see downward (huge selling pressure) if it breaks the support line (dashed). And 50 MA is indicating the same.

Hence, once it breaks the support line, intraday traders can sell for the following targets: 39460 – 39260

To become a subscriber, subscribe to our free newsletter services. Our service is free for all.

Do you want to know where MCX Gold will go? Read Here →

Continue reading