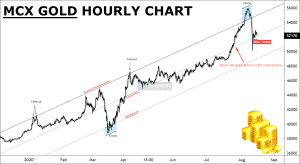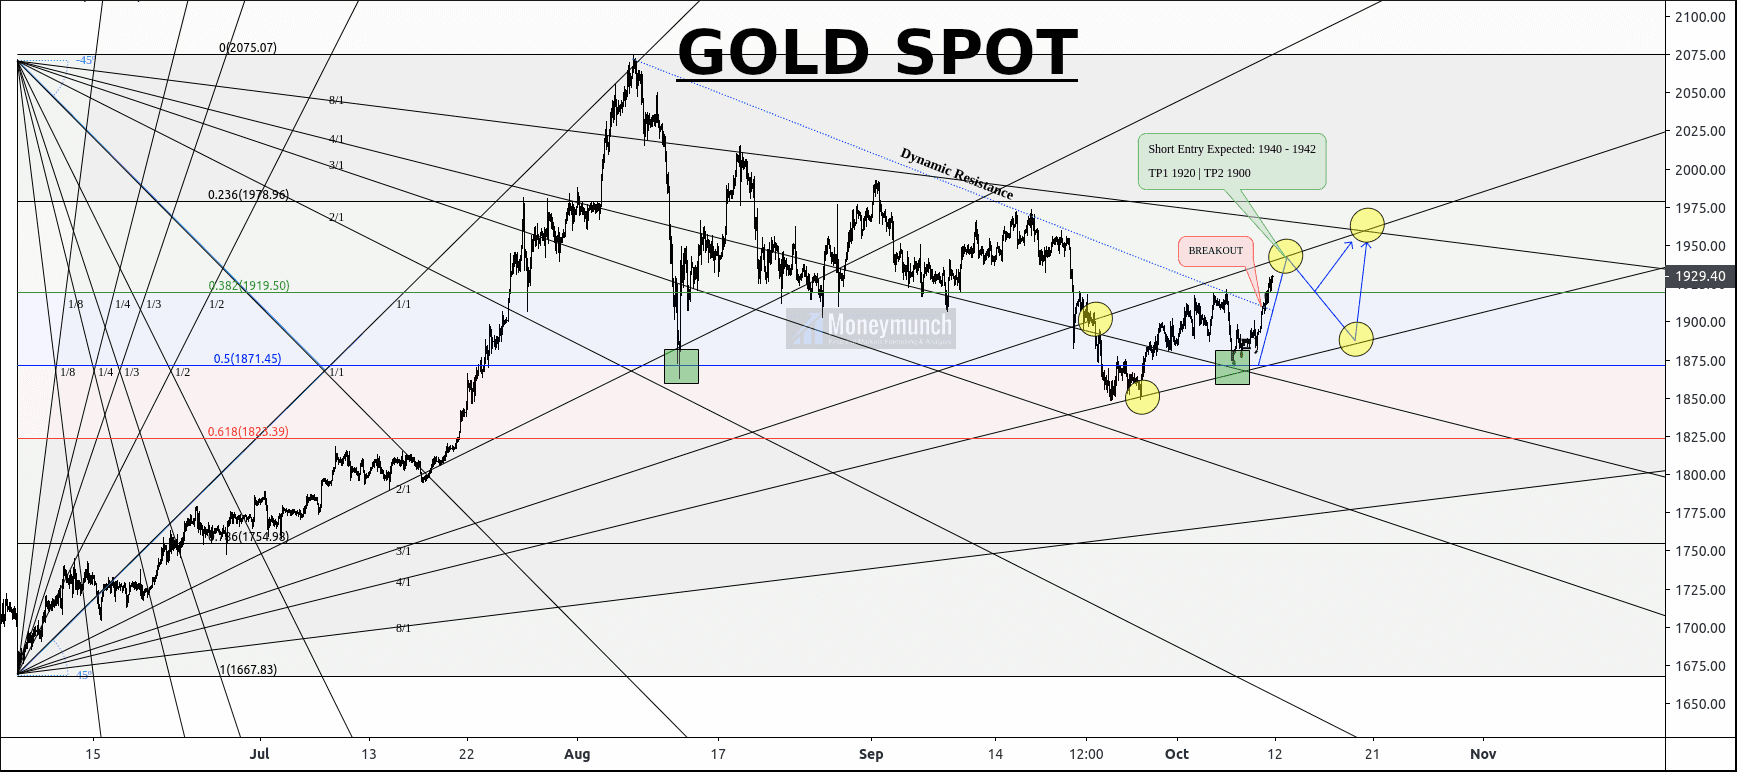
GOLD SPOT See What These Gann Gan & Fibonacci Retracement Value Say About Trend
Here, I have used Gann Fan & Fibonacci Retracement to identify the next move of Gold Spot. Wherein, it is taking reversal from the 0.5 retracement value (highlighted by green square). And now it’s running under 3/1 & 4/1 Gann Fan value.
According to this chart, gold will keep drilling upward up to $1940. After that, it can fall for 0.382 value of retracement. And a breakdown of this retracement means $1900 waiting ahead.
Overall we can see a bullish trend. That can be for $1960 – $1976 levels before Nov end.
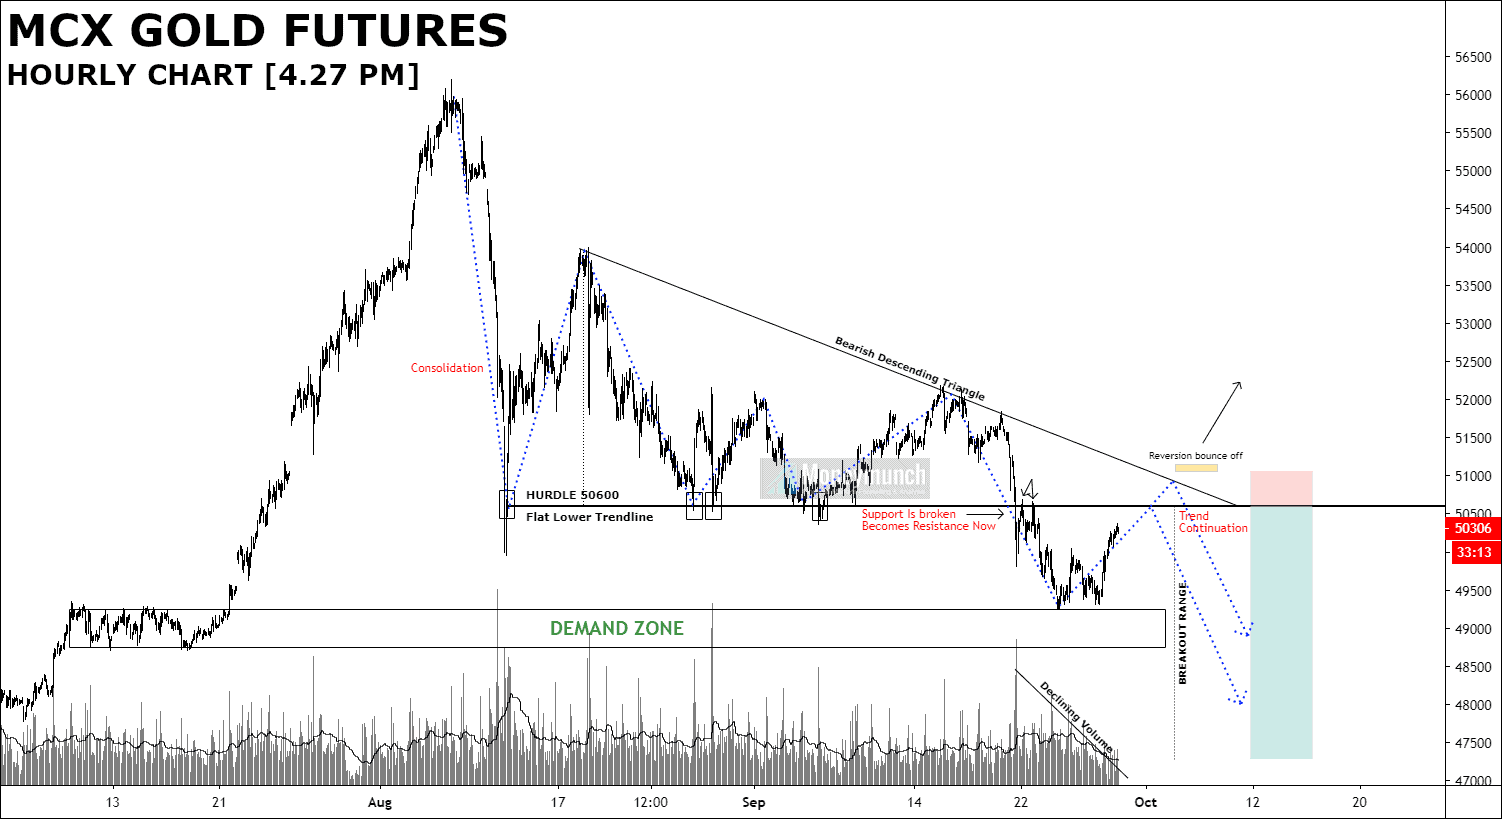
MCX Gold Report: Intraday Pullback Before Acceleration Lower
Gold in Correction Mode..?To become a subscriber, subscribe to our free newsletter services. Our service is free for all.
 Unlock This Article
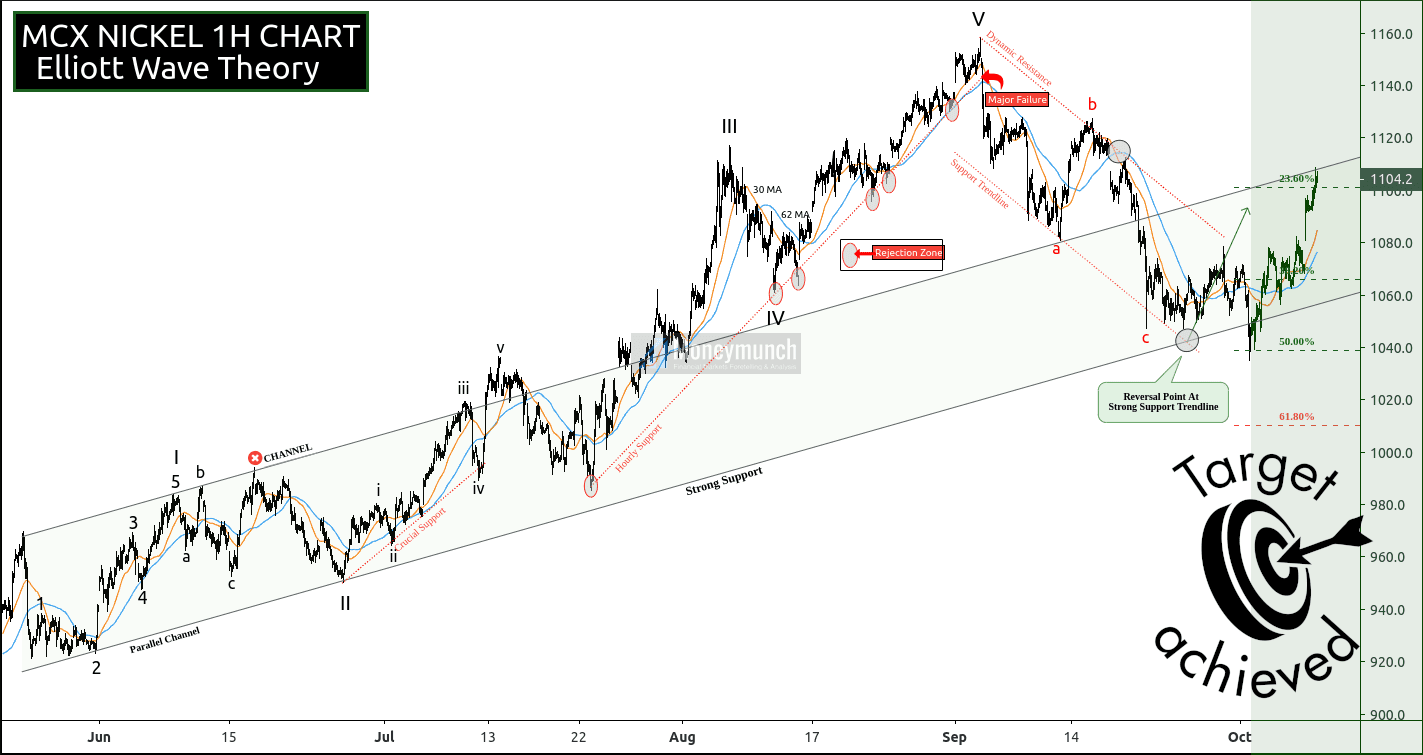
Nickel Trading Calls Updates
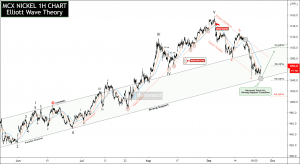 How many of you bought Nickel? If not, read this article: MCX Nickel Detailed Trend Forecast & Tips
I have written in bold words, “…nickel will start raising for 1076 – 1090 – 1100 level. Dynamic resistance breakout will lead the prices for a 23.60% retracement level”.
In the last trading session, MCX Nickel has reached all targets (see below). What else you want!?