Special Report: Gold, Silver, Crude oil, & Nickel Intraday Calls

free gold calls chart

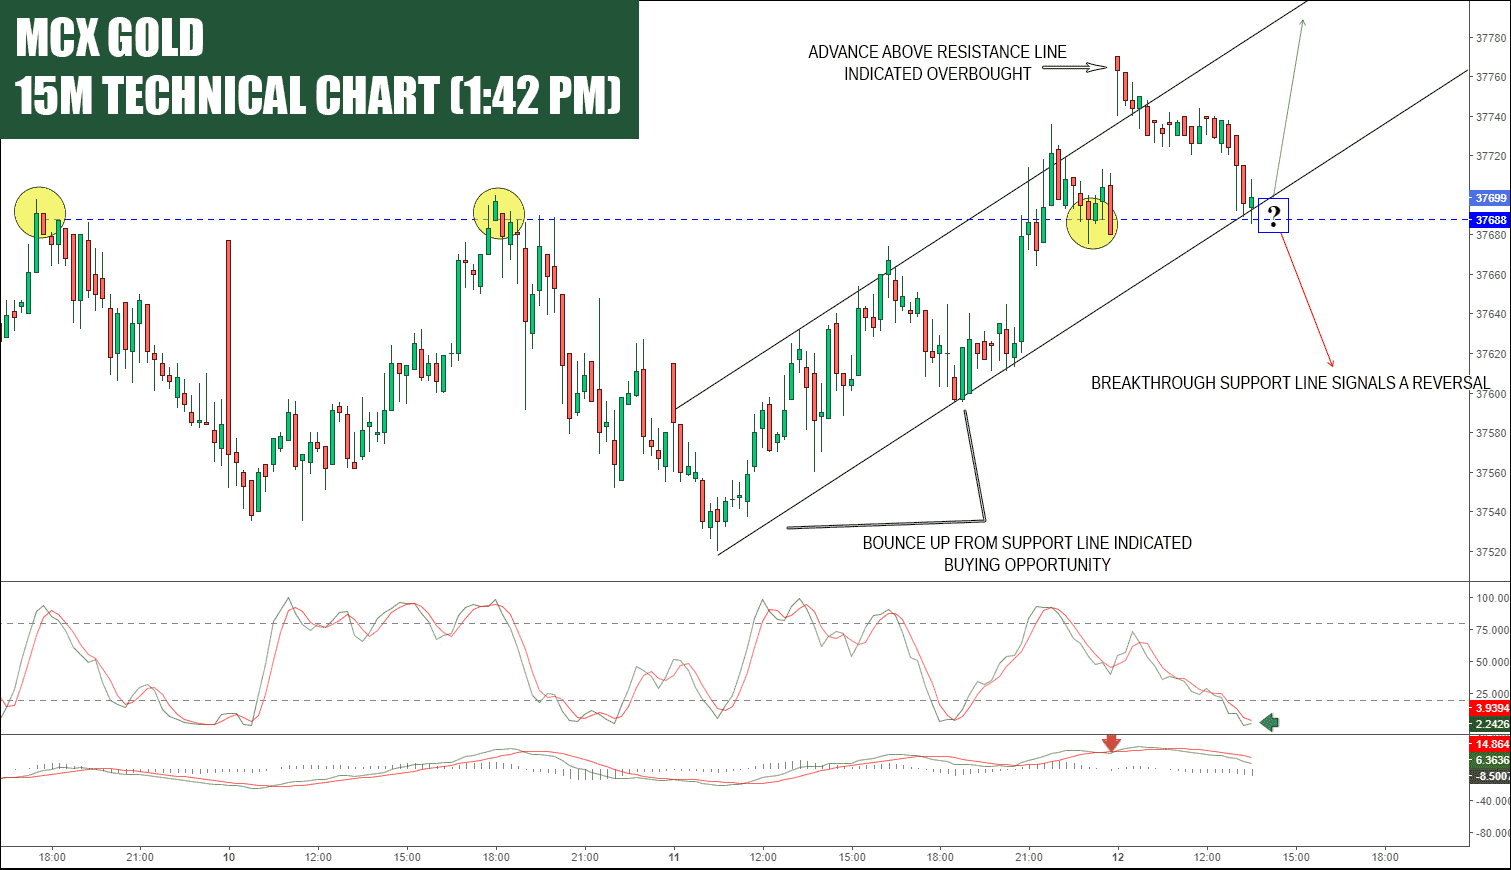
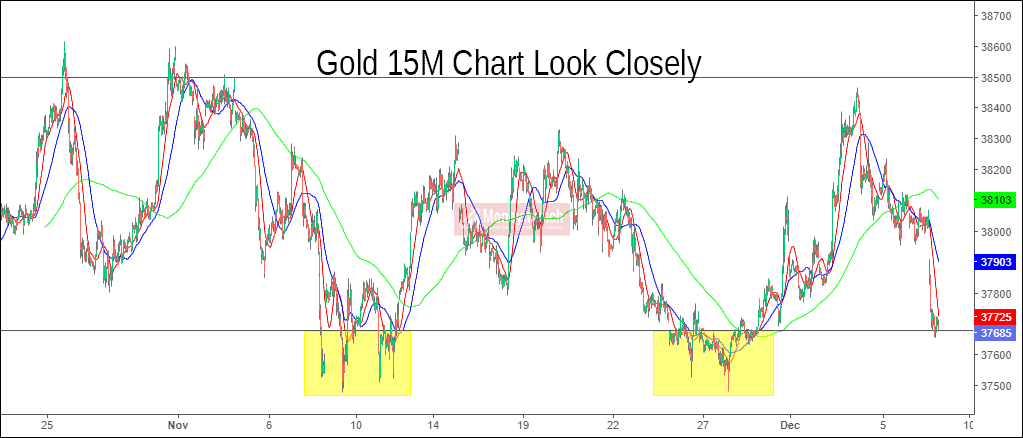
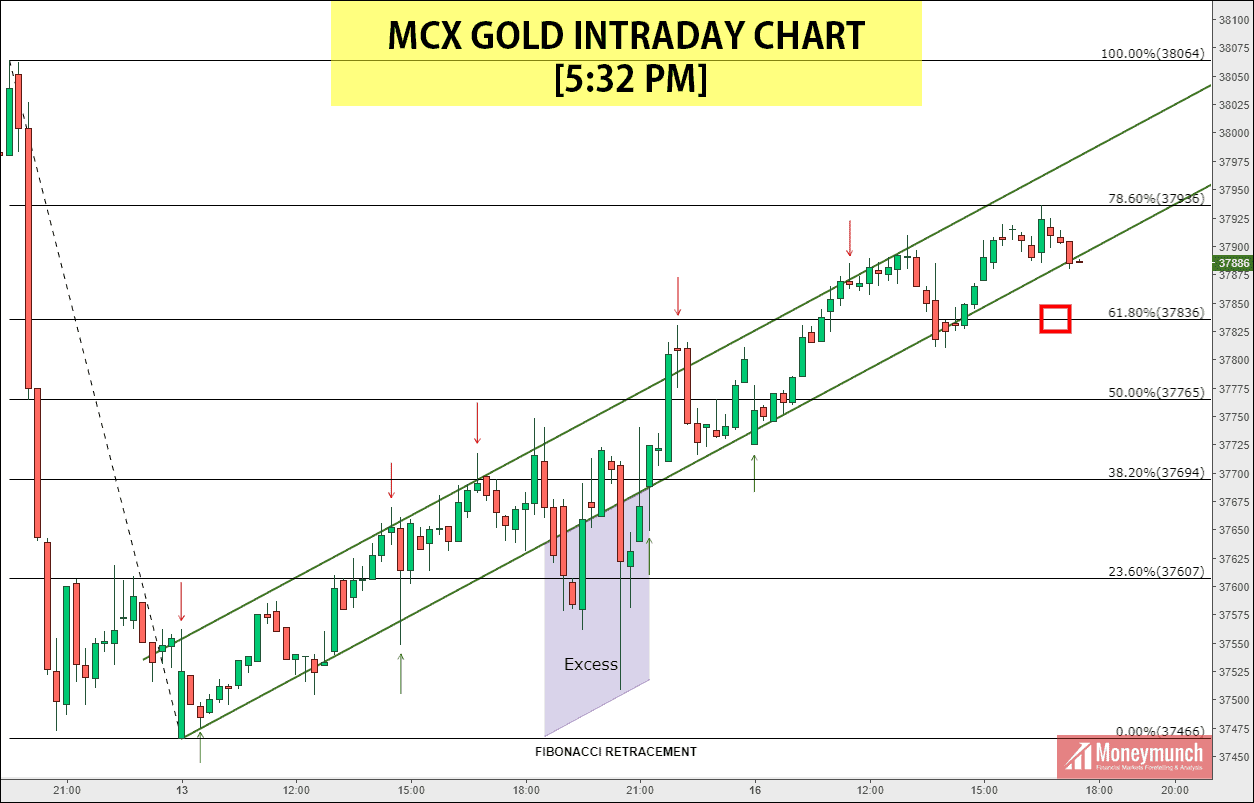
Will Gold Breakout OR Breakdown Next?

Fib Ret 61.8% will work as a trend changer point.
Above this point TG: 80% – 90%
Below TG: 50% – 40%
Key: Lower Trendline

Accurate levels: available for subscribers only! To become a subscriber, subscribe to our free newsletter services. Our service is free for all.

free silver chart calls

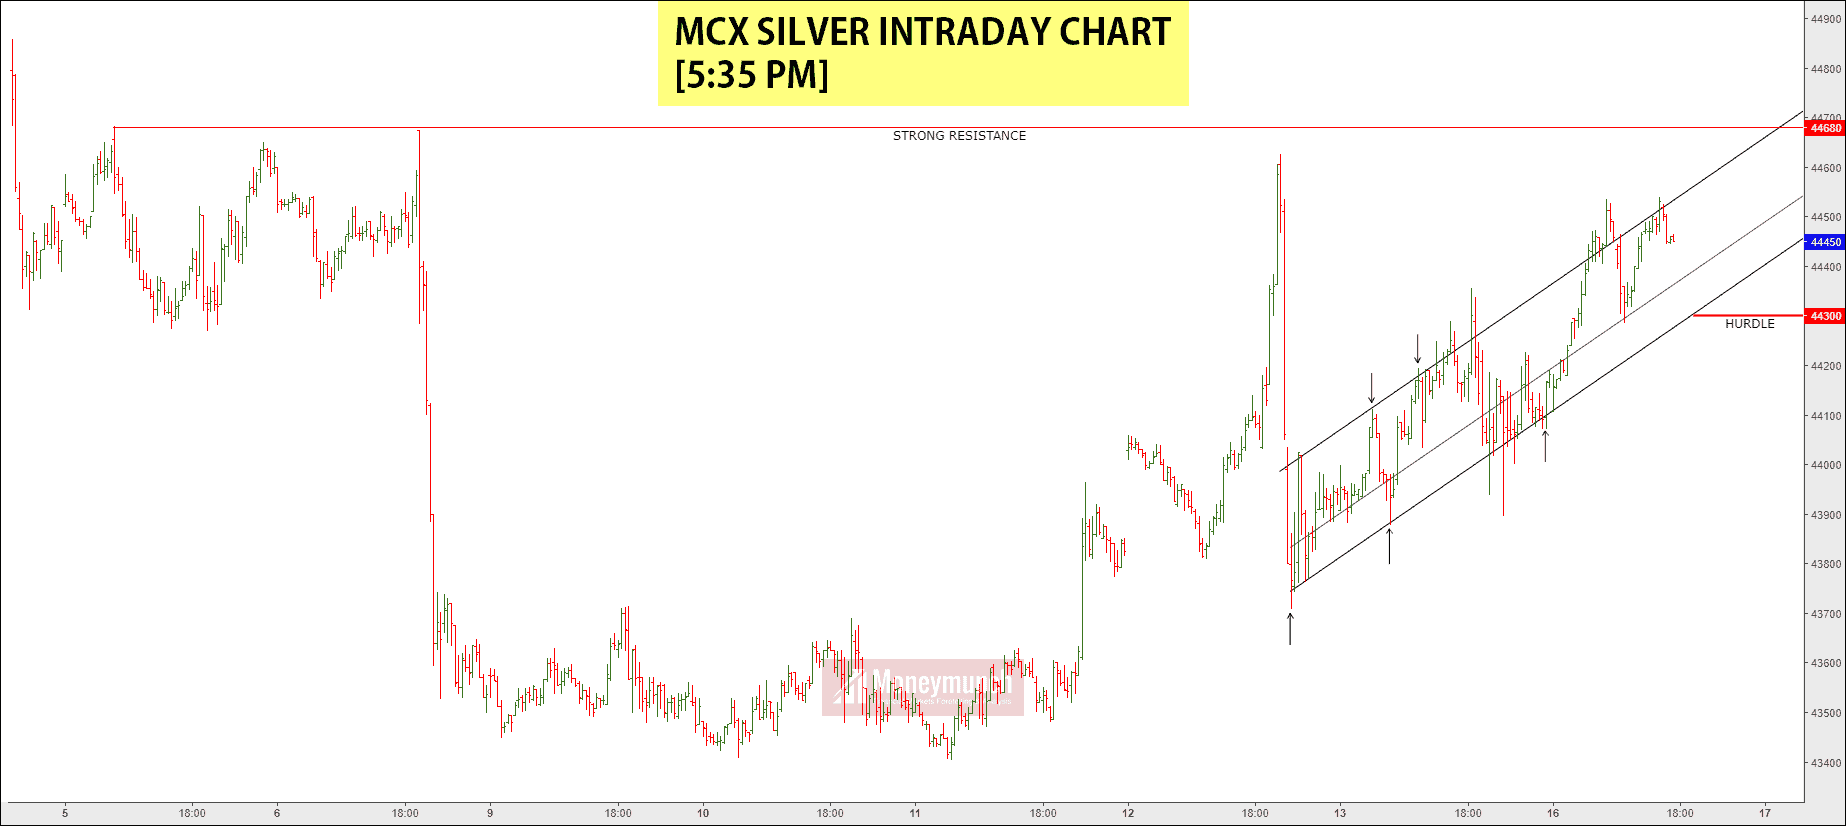
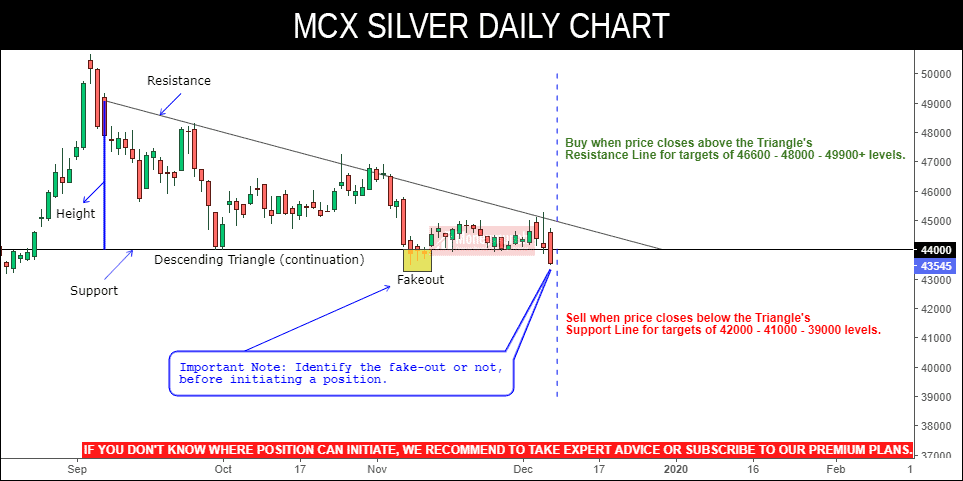
Silver Technical Perspective – Why So Bullish?

A new position can initiate on the trendline up to 44680.
Hurdle: 44300

Make a new position at trendline touch. Hurdle breakout will confirm the downtrend.

Now intraday traders know what to do next!

free crude oil chart tips

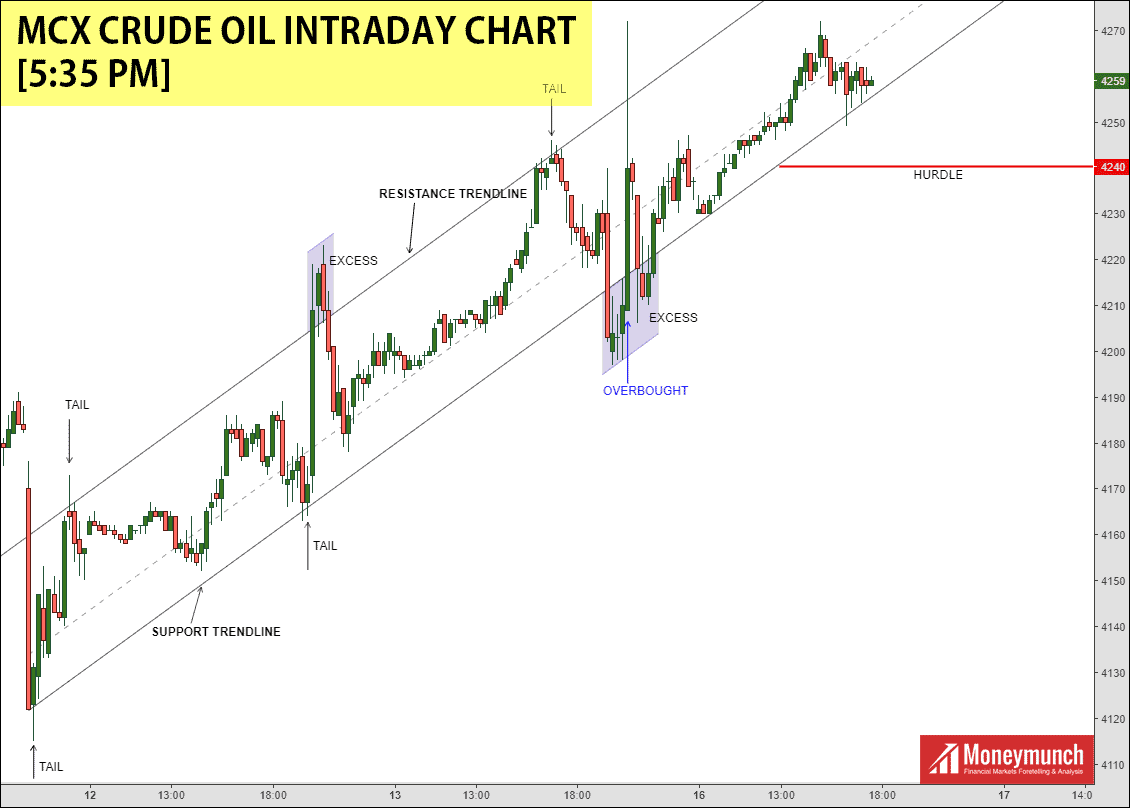
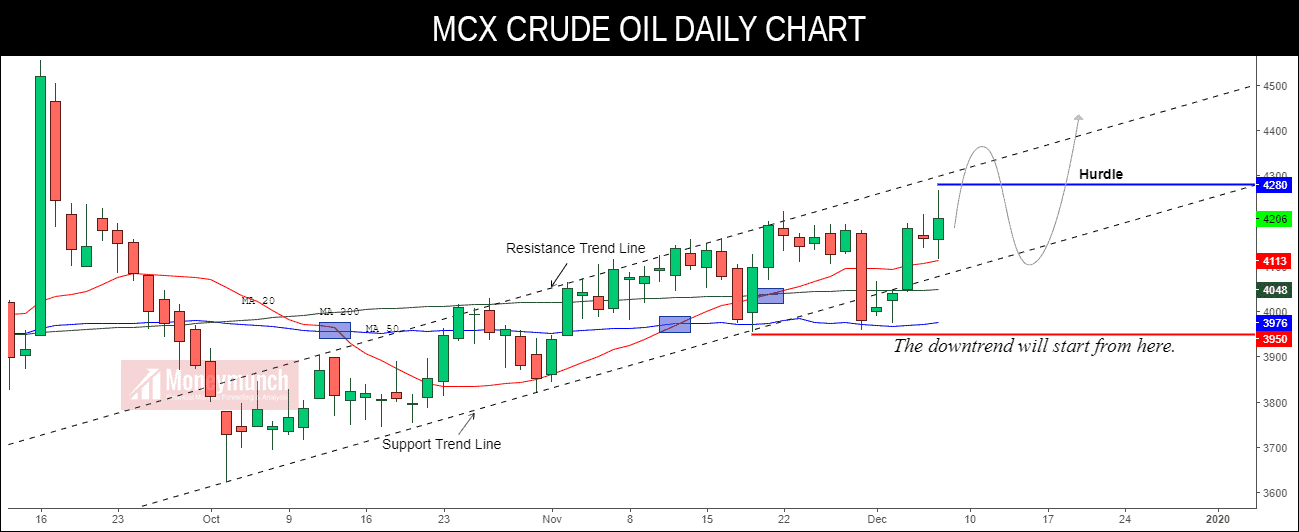
Will the Momentum in Crude oil Continue?

Above yesterday’s high and 4290 closing price, a massive upward rally will start for 4330 – 4390 – 4430 levels.

Keep your eyes on the hurdle.

Hurdle breakout: 4210 – 4200 below

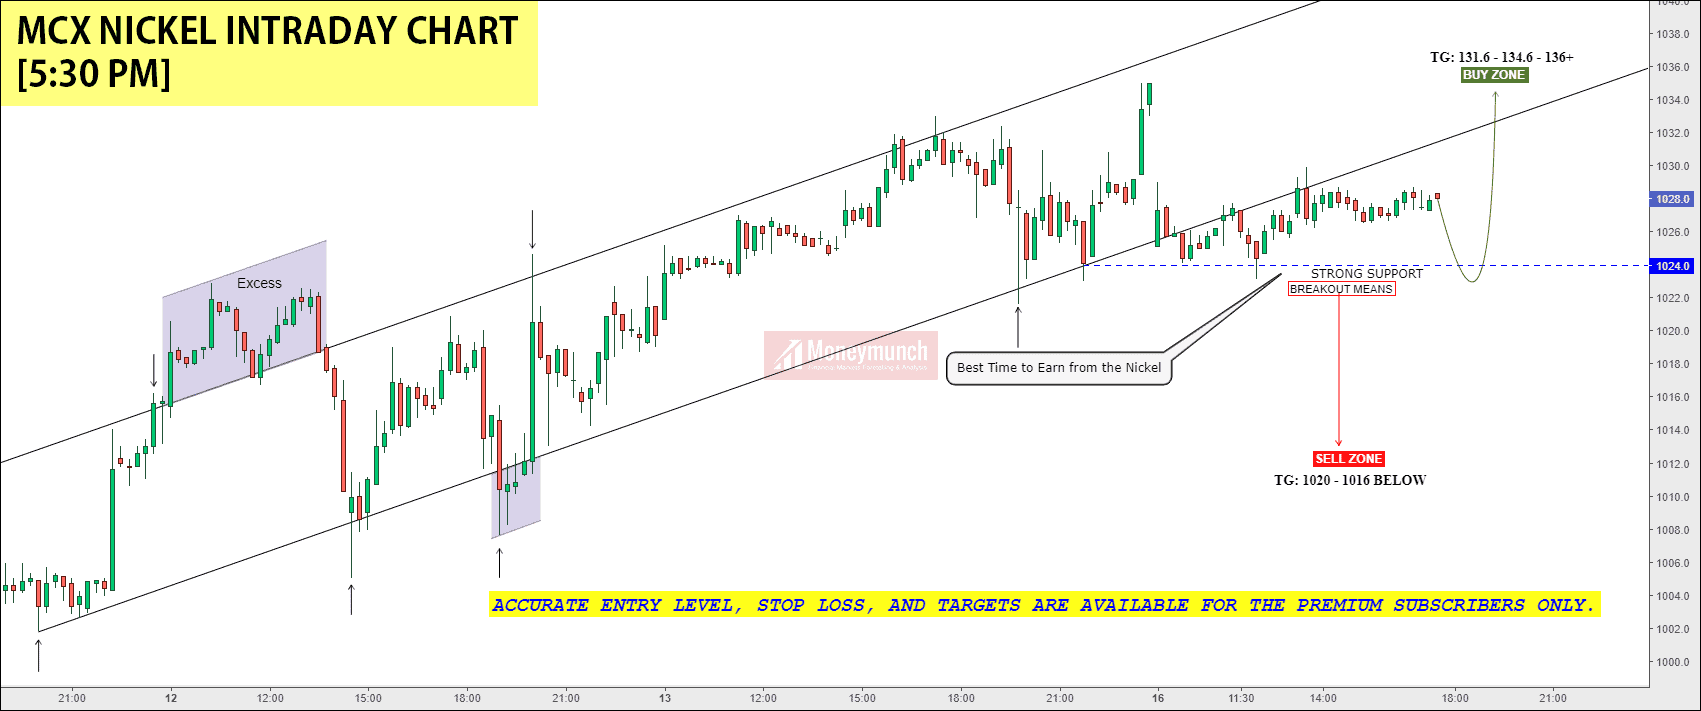
Nickel Reloads For Another Price Rally

free nickel tips chart

CLICK HERE TO UPGRADE YOUR FREE SUBSCRIPTION

DECEMBER OFFERS50% OFF
TAKE ADVANTAGE OF OUR LOWEST PRICE OF THE YEAR. FOR LIMITED TIME ONLY!
JOIN NOW!

Continue reading

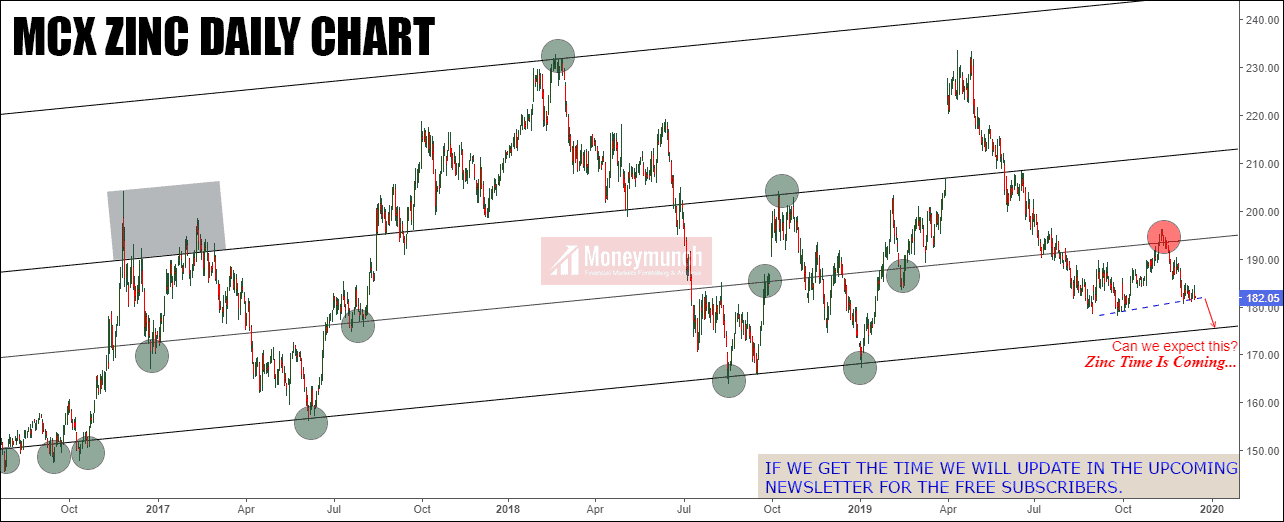
MCX Gold, Silver, Crude oil, & Zinc Tips & Updates

Gold, Silver, and Crude oil Tips & Updates

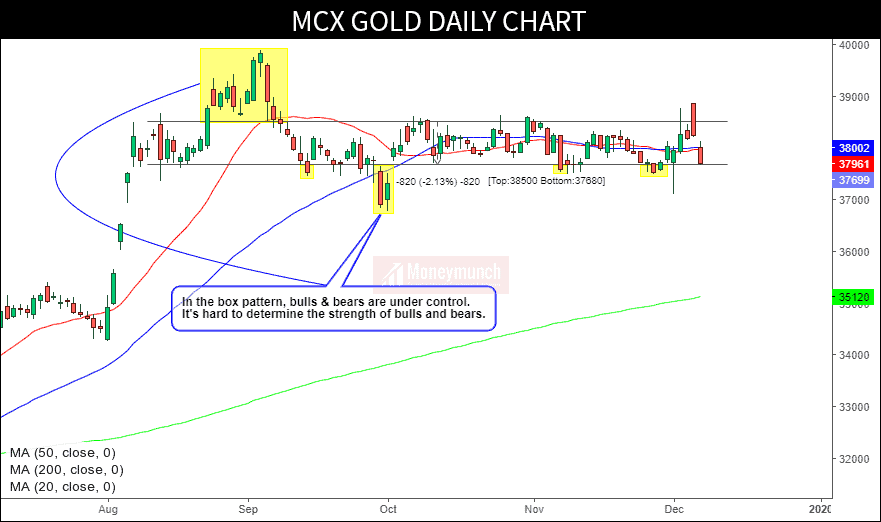
The gold is still trying to stay in the box. Check out my 8 Dec newsletter: ‘Tips & Charts: Gold, Silver, & Crude oil Special Report

But the silver is under my radar now. A big blast is coming soon.

And if you’re looking for crude oil, read that same newsletter. It’s also following the 8 Dec chart direction.

In short, gold, silver, and crude oil short-term & long-term trading calls & reports are available in the above link.

To become a subscriber, subscribe to our free newsletter services. Our service is free for all.

commodity zinc tips chart
Continue reading

Tips & Charts: Gold, Silver, & Crude oil Special Report

free gold chart tips

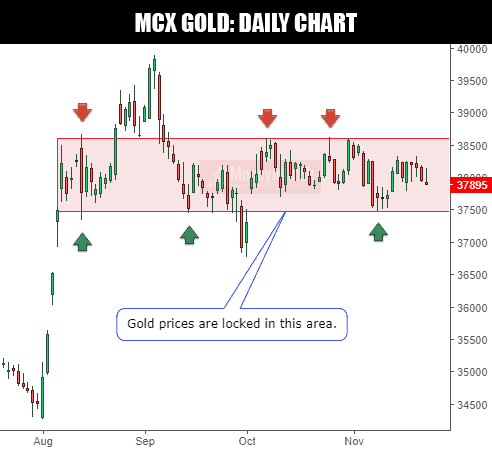
MCX Gold at Support: the Upcoming Move

The last weekend moves had down. When the gold brake below the box, the bears can win this battle.
Output: 36800 – 36000 – 35360 levels (Beware of fake out)

If the gold breaks the box upside in the future, then these areas will be support areas that can keep the gold from falling. And the result will come out with the following levels: 39000 – 39600 – 40000+

For Intraday Traders:

gold intraday chart calls

Silver Price Setting Up For A Downside Price Rotation?

free silver calls chart
free crude oil chart calls

What If Crude Oil Is NOT In A New Bull Market?

Support trend line breakout is a clear sign for STOP BUYING. Crude oil selling will start right after redline. I will tell you in the next update what happens if it breaks that line.

Keep buying at/above the support trend line for 4280 – 4356 – 4400 levels.

Remember, this strategy works for intraday and short-term investors only. To become a subscriber, subscribe to our free newsletter services. Our service is free for all.

Continue reading

Counter-trend Rally: MCX Gold, Silver, Crude oil & Jeera

free gold calls chart

Gold & Silver: Decision Time

Gold prices stuck in the range of 37500 – 38600 levels. What will happen next? The full Gold report will be updated soon for the subscribers only. To become a subscriber, subscribe to our free newsletter services. Our service is free for all.

Silver’s traders can read our last report. It’s very close to our levels: MCX Silver Intraday Trend Analysis & Tips

free crude oil tips chart

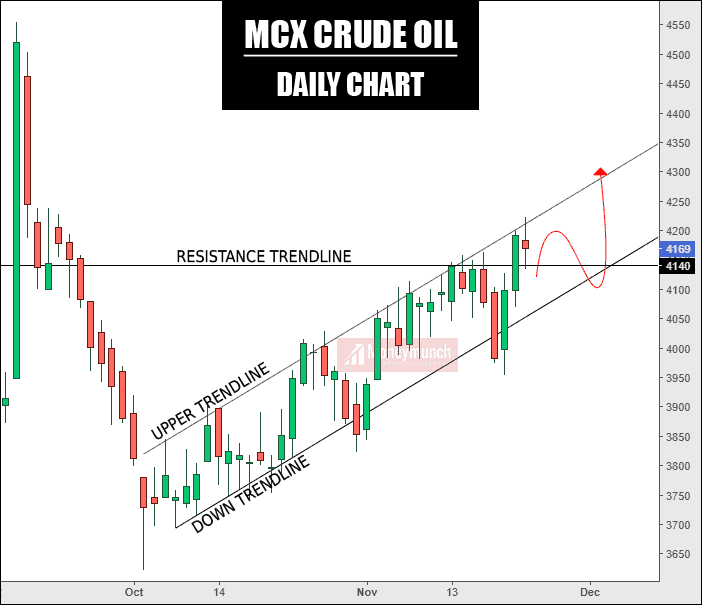
Crude oil Golden Long-Term Opportunity

As per the chart, the resistance trendline is crucial here. You can take the 4140 levels as a trend changer. Above resistance trendline, looks for further upside with 4240 – 4360 – 4440+.

But in the week beginning, 4100 – 4060 expected levels.

ncdex jeera calls & charts

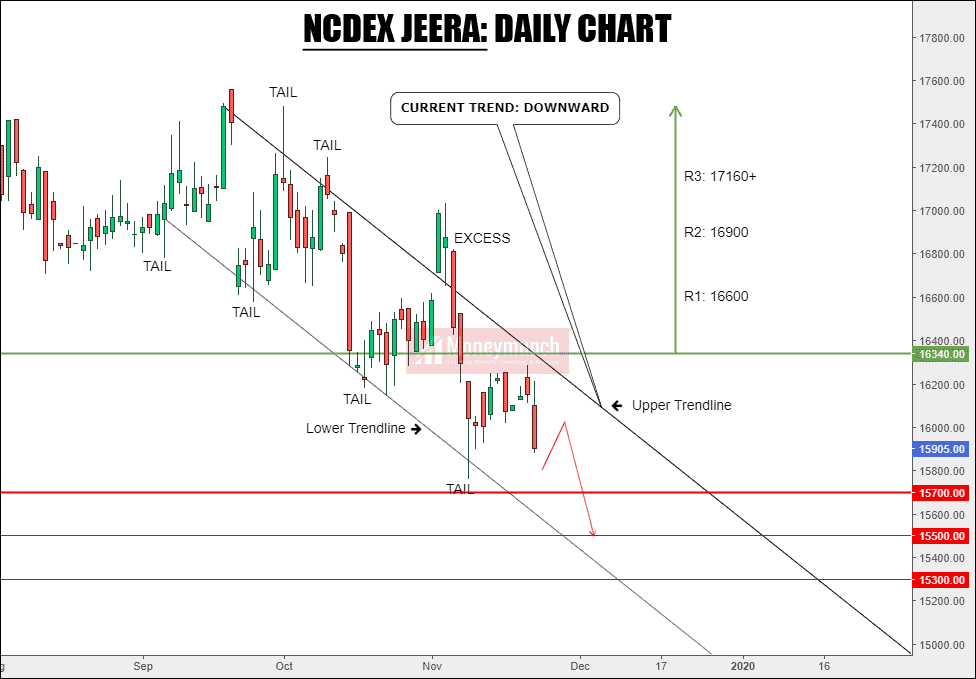
Jeera – What Next?

Jeera’s next support level is 15700 level. After the breakout of support, we can expect 15500 – 15300 levels as targets.
Above 16340 (or upper trendline breakout) looks for further upside with 16600 – 16900 – 17160+ as targets.

Continue reading