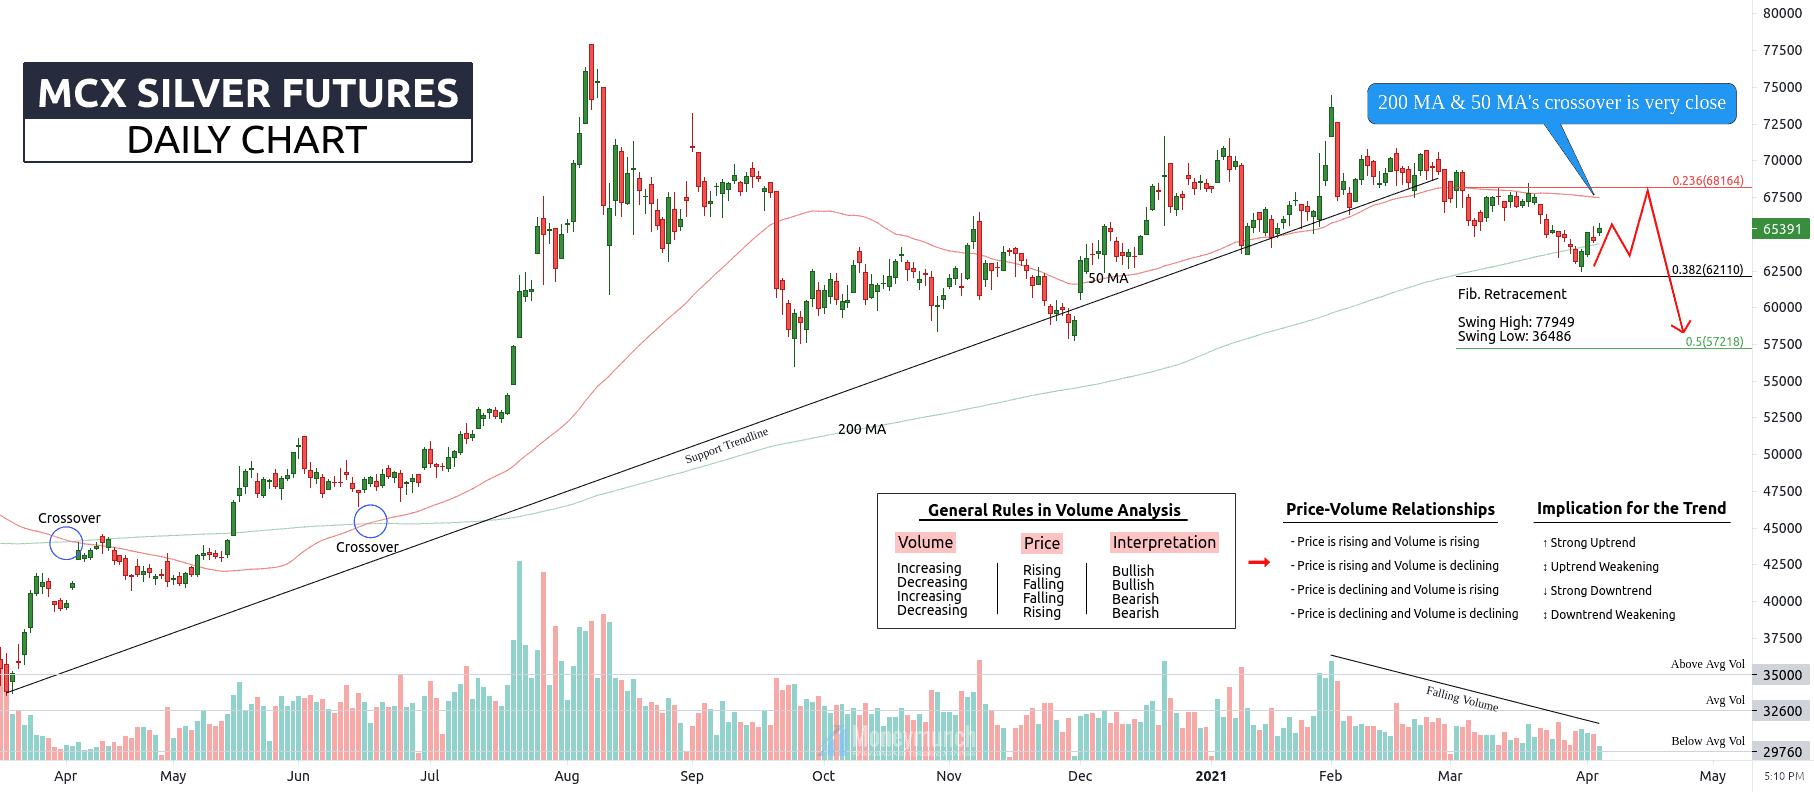
MCX Silver Will Touch 68000?
Volume accumulation is confirming a downtrend. Here, the price is in a downtrend. But if you look for the short-term, silver price has started rising nearby the retracement value of 0.382. We may see a bullish reversal from the 0.236 value for 0.382 to 0.5.
MCX silver futures prices may hike to the levels of 66000 – 66600 – 67000 – 68000.
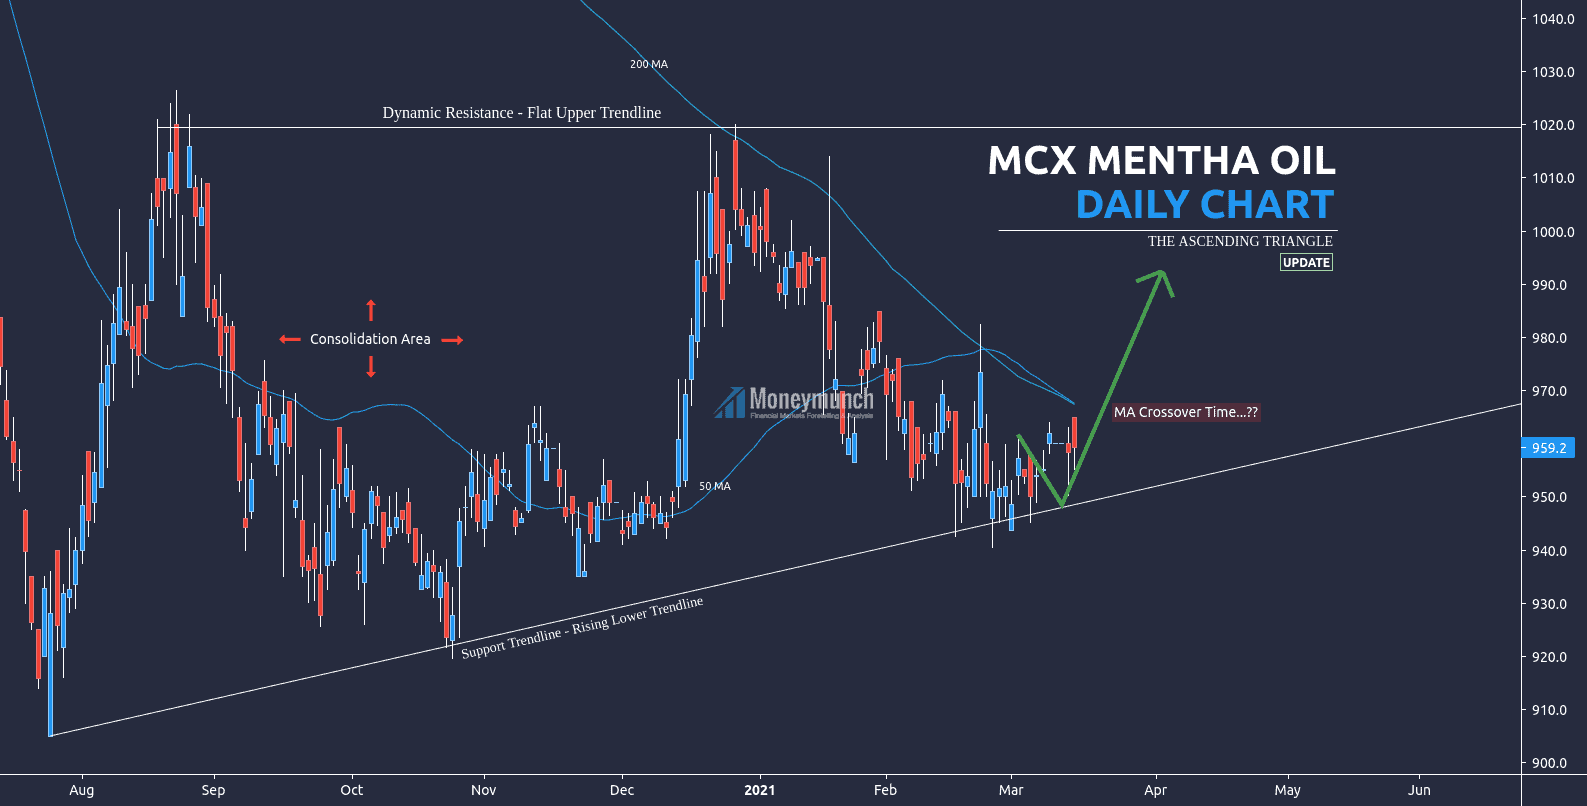
Overall, a clear trend will identify after moving averages crossover.
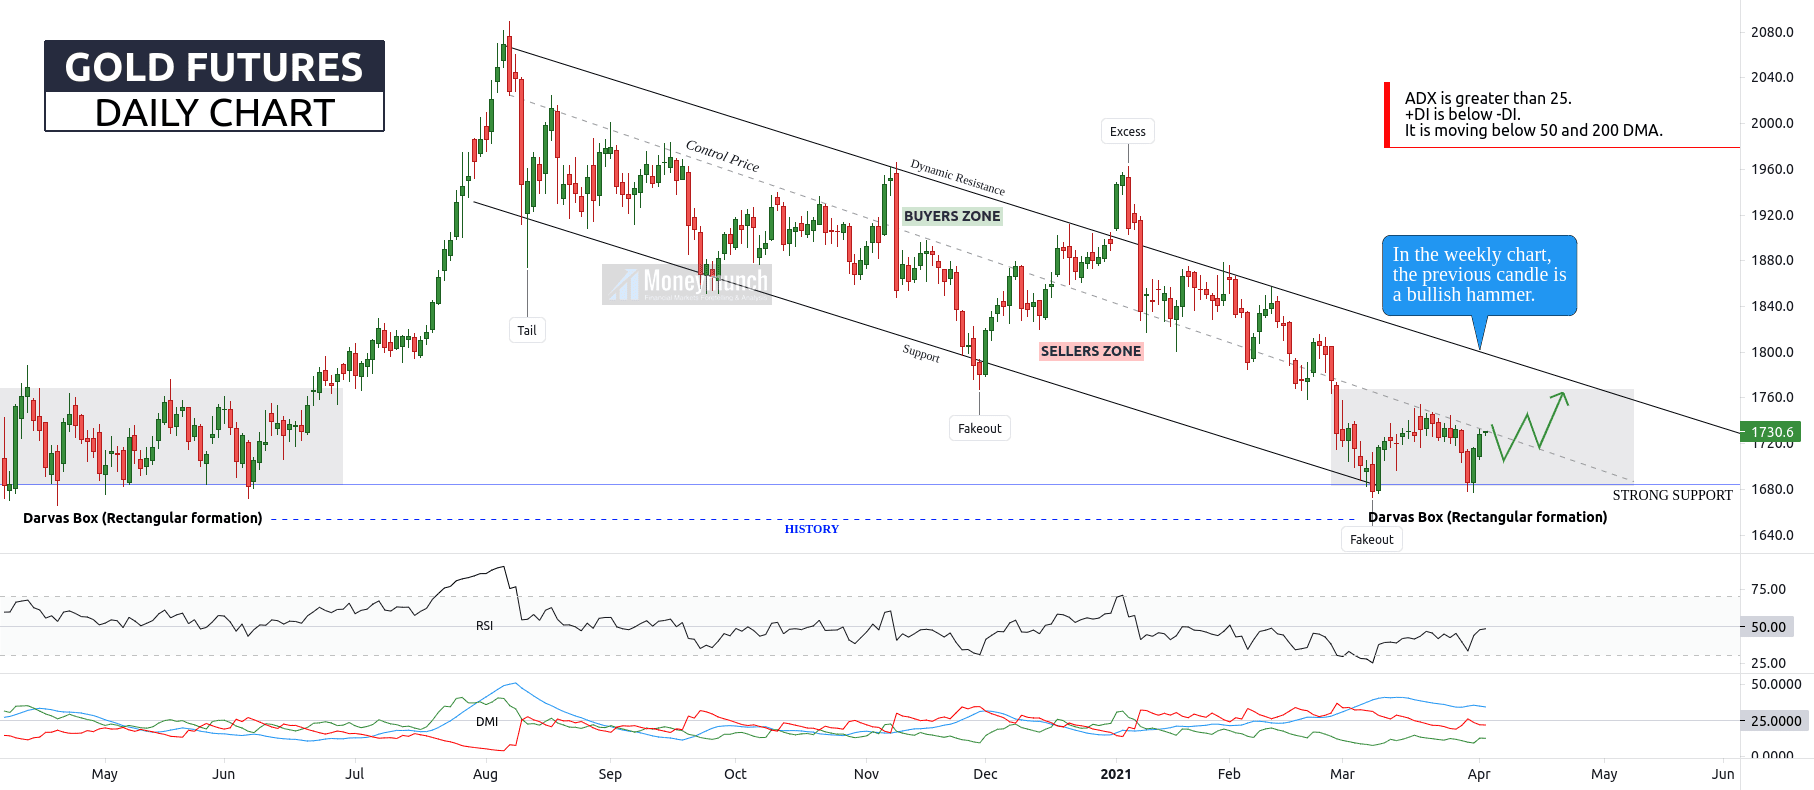
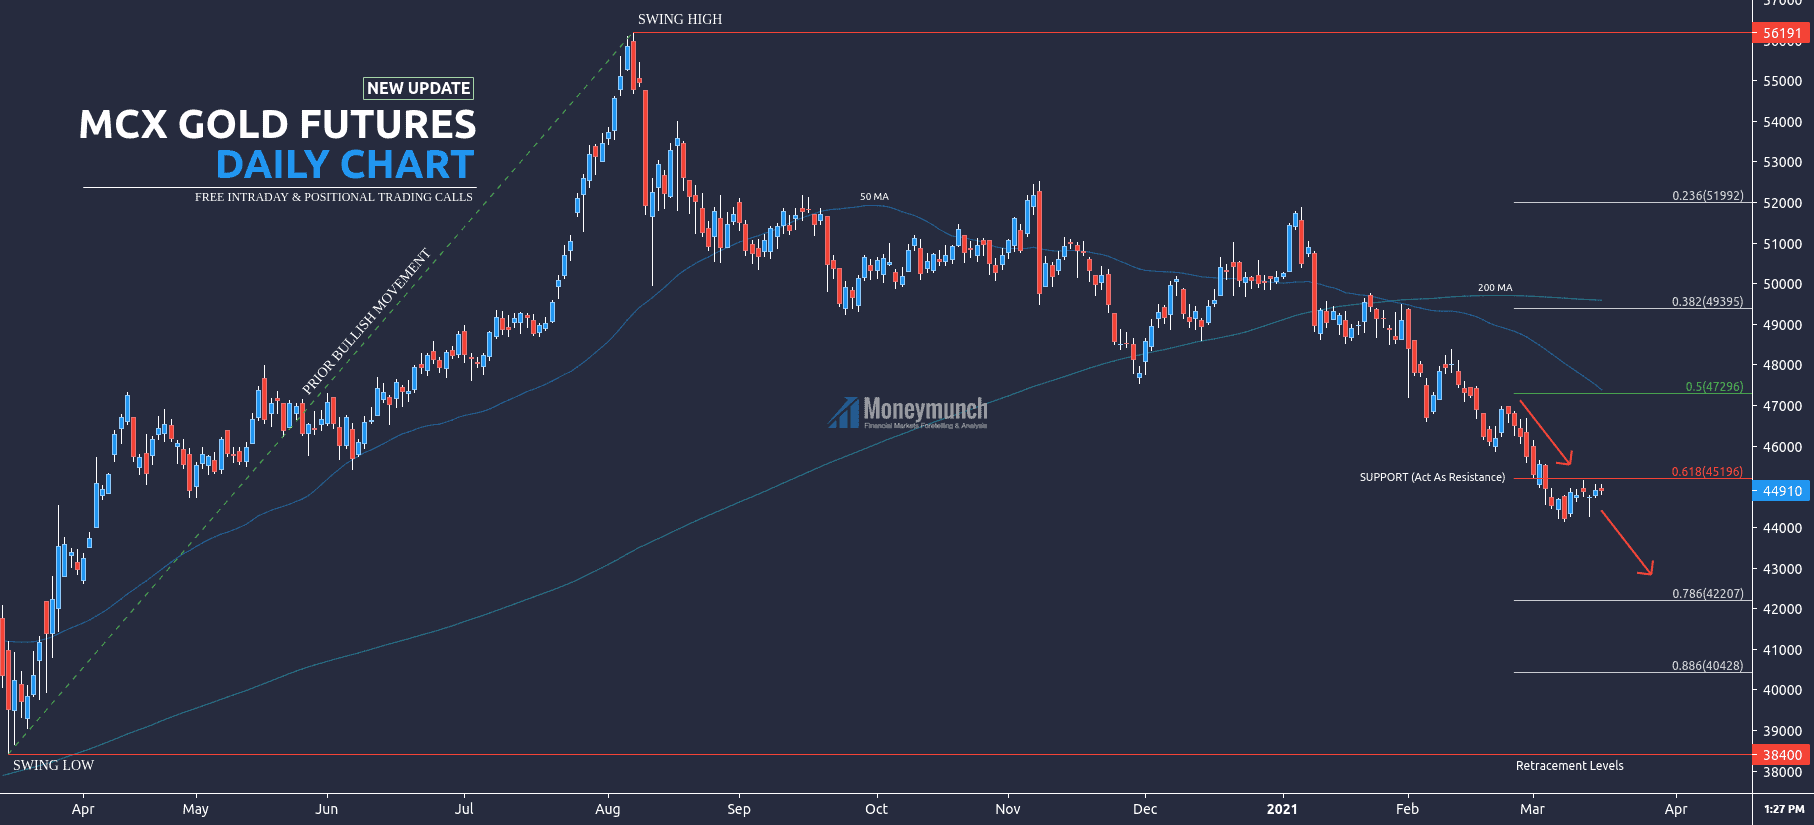
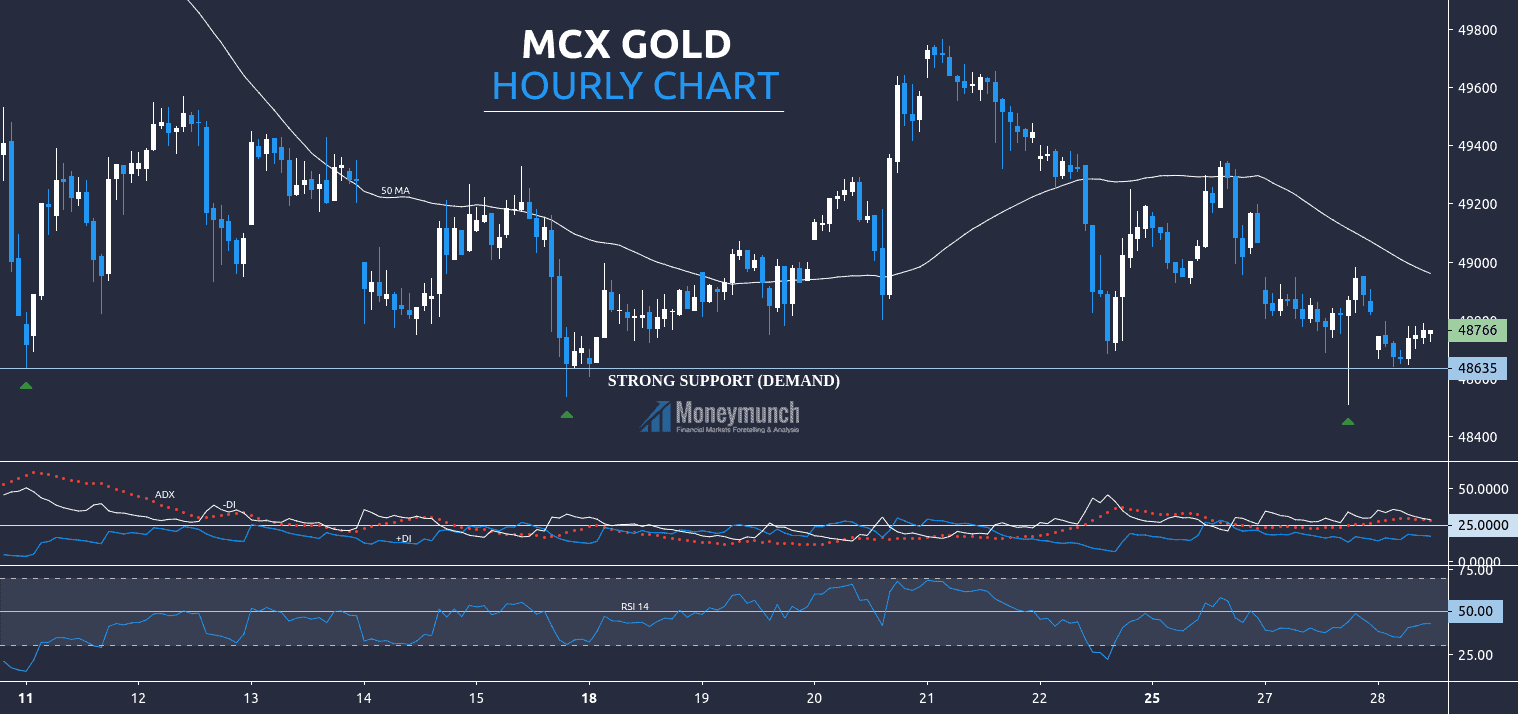
Gold: Profit Booking Time
How many of you bought gold?
Article: MCX Gold & Gold Spot Price Ready For Another Rally Attempt (1 Day Ago)
I have written in clear words, “MCX gold will move upward gently this week. Hence, intraday traders can jump between the range of 45200 – 45300. Targets: 45560 – 45680“.
Gold has made a high of 45680 today at 5:24 PM and touched all targets.
Approx. profit: Rs.38,000 per lot
To become a subscriber, subscribe to our free newsletter services. Our service is free for all.

 Unlock This Article