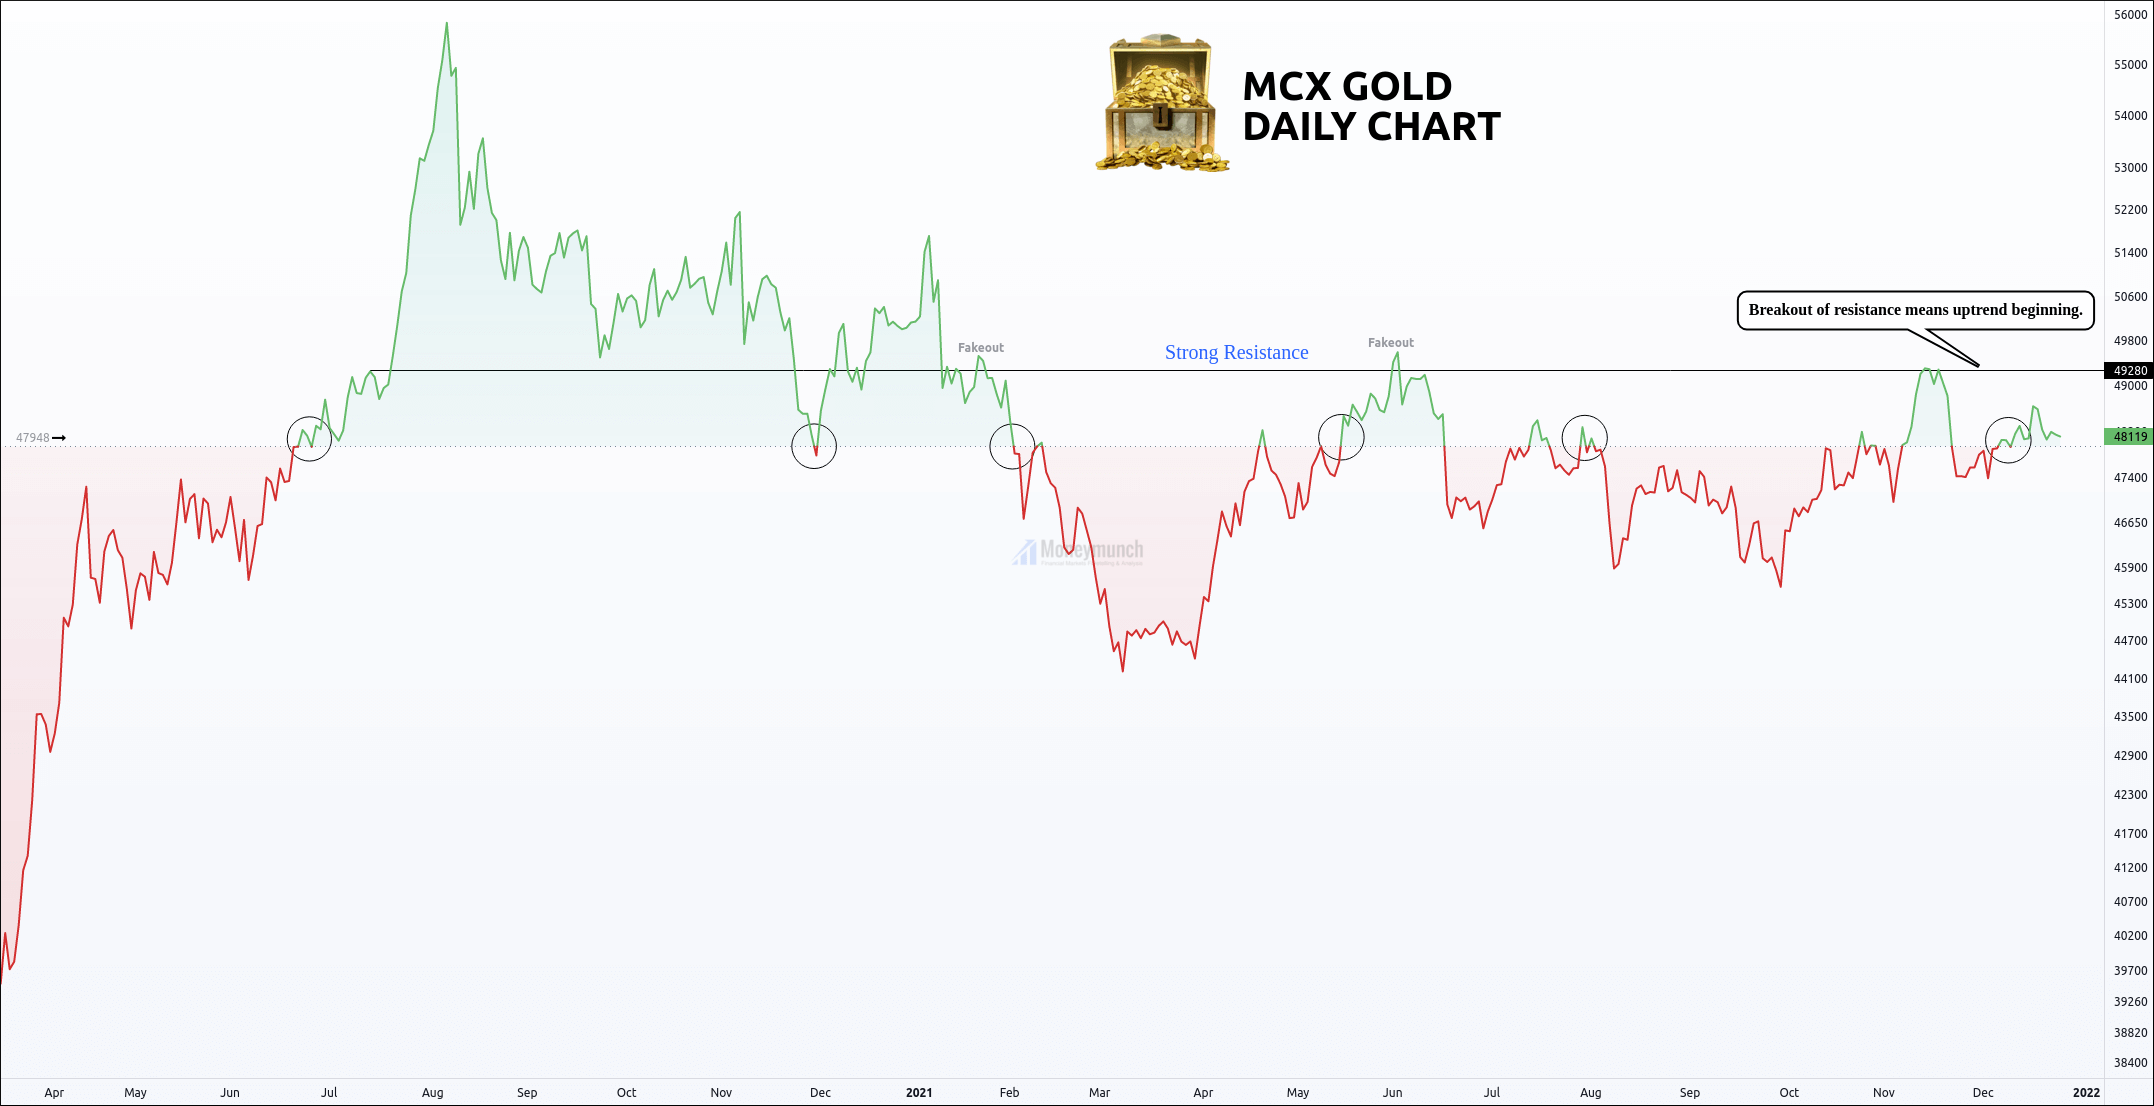
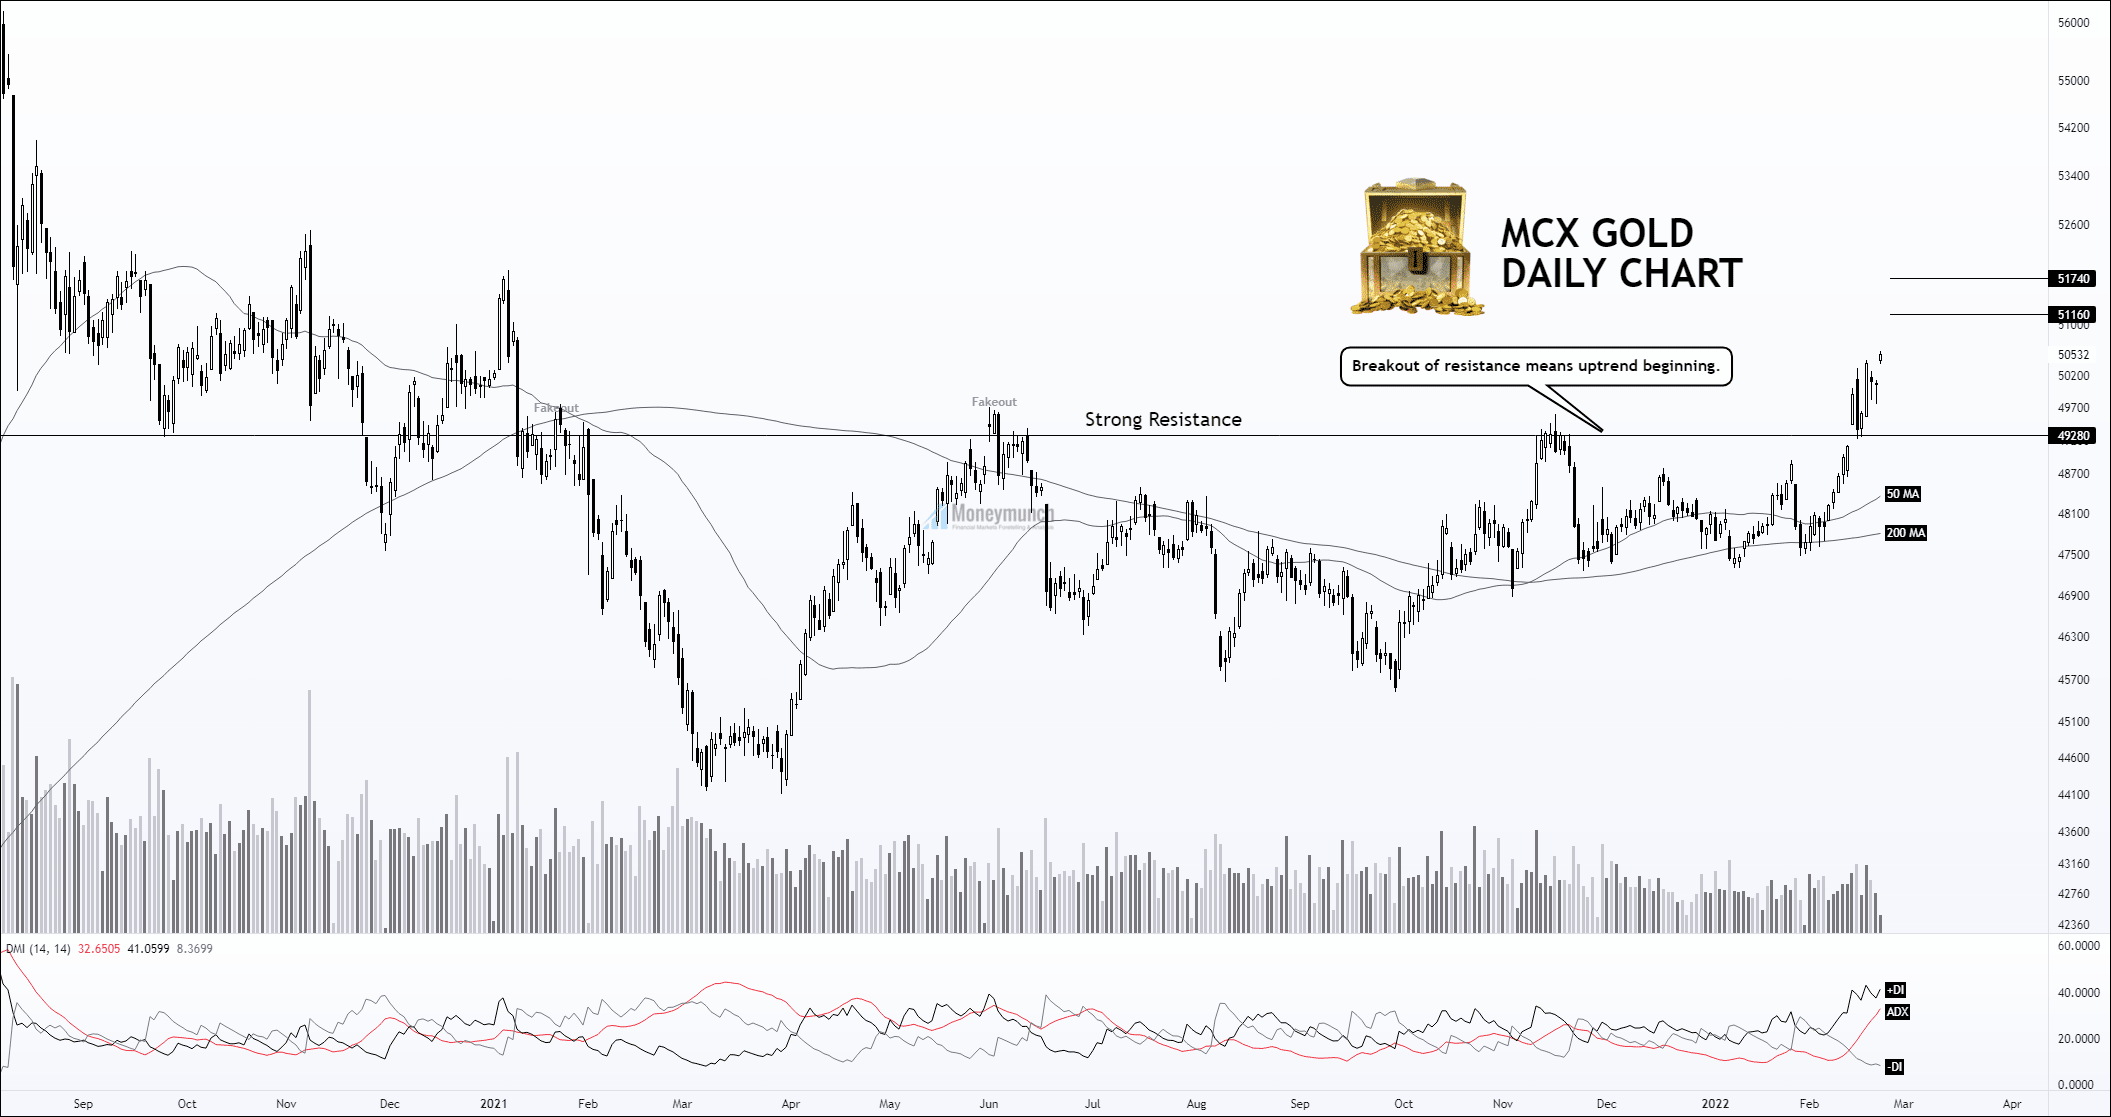
Key levels: 47948 – 49290
Gold is rejecting uptrend and downtrend at the level of 47948. And we don’t see a powerful movement in the 2021 year, wherein it throwout the level of 49280 successfully.
Here, you will have a strong support level, wherein we may decide about buying or selling. And it is the level of 47948. Intraday traders can keep buying the gold for targets of 48360 – 48640 – 48890 – 49280 until it remains above the level of 47948.
But, if you see a breakout of the first ‘key’ level, then sell it for the targets of 47480 – 47060 below.
Buyers must be aware these days. Why?
The gold prices may push down with power compared to an uptrend because of Coronavirus (Omicron).
For advance traders, watch significant releases or events that may affect the movement of gold, silver, crude oil & natural gas:
Tuesday, Dec 28, 2021
20:30 CB Consumer Confidence (Dec) – High Impact
Wednesday, Dec 29, 2021
03:00 API Weekly Crude Oil Stock – Medium Impact
21:00 Crude Oil Inventories – High Impact
Thursday, Dec 30, 2021
19:00 Initial Jobless Claims – High Impact
21:00 Natural Gas Storage – Low Impact
To become a subscriber, subscribe to our free newsletter services. Our service is free for all.
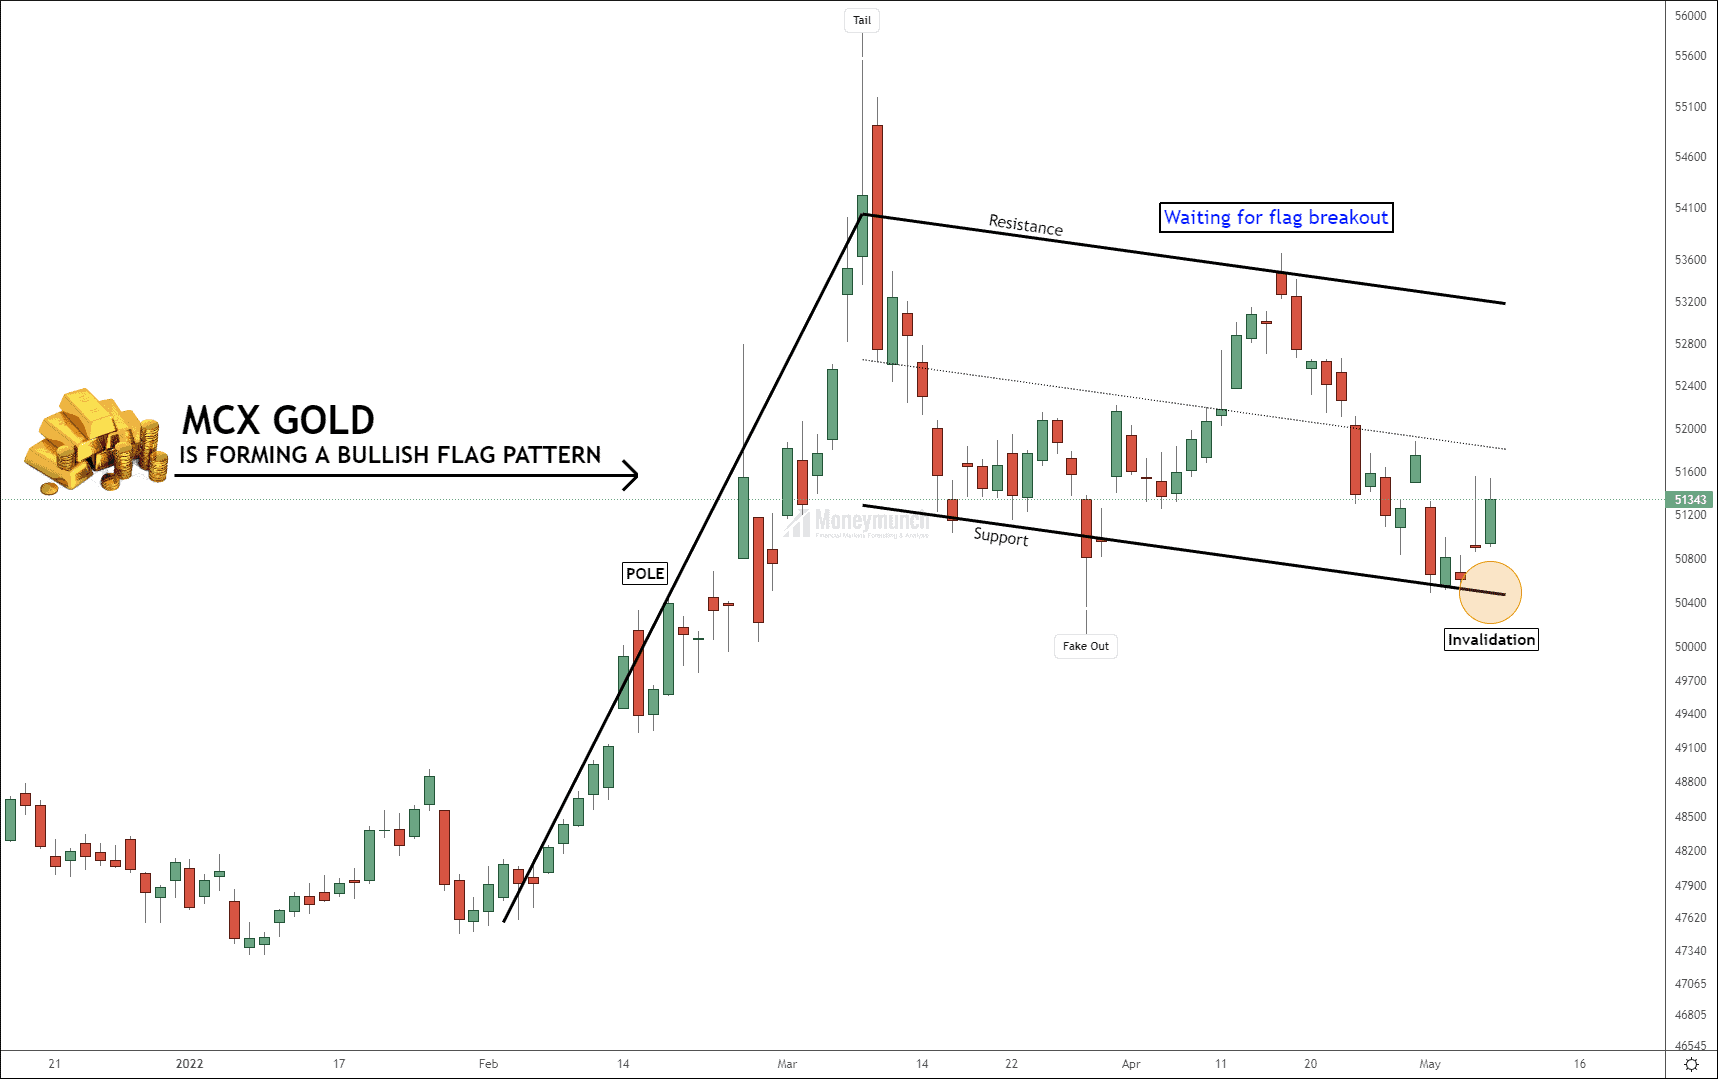 According to the above chart, Gold is forming a bullish flag pattern. And we’re waiting for a breakout of the flag pattern. This breakout will skyrocket the gold price, and we can see 6400+ points of bullish movement here. Long-term target for gold 58000 – 60000.
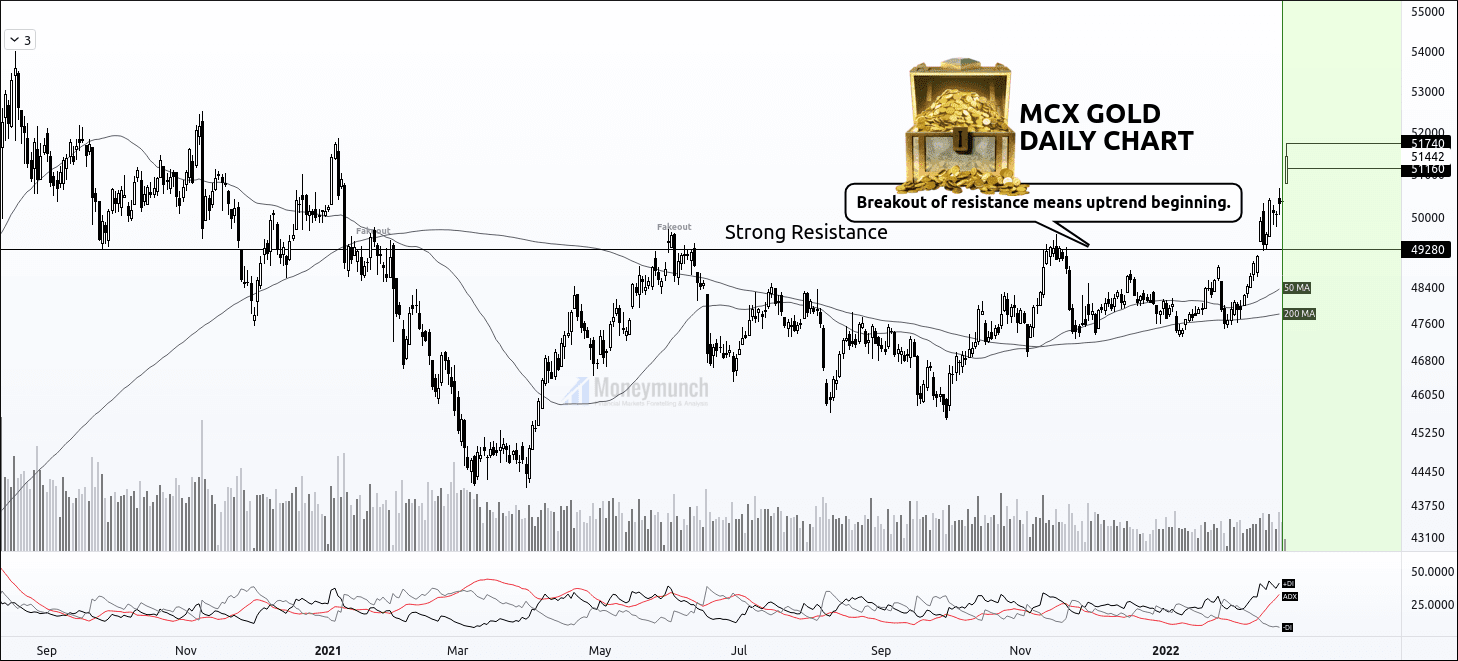
 Unlock This Article