 Unlock This Article
Only subscribers can read the full article. Please login to read the entire article.
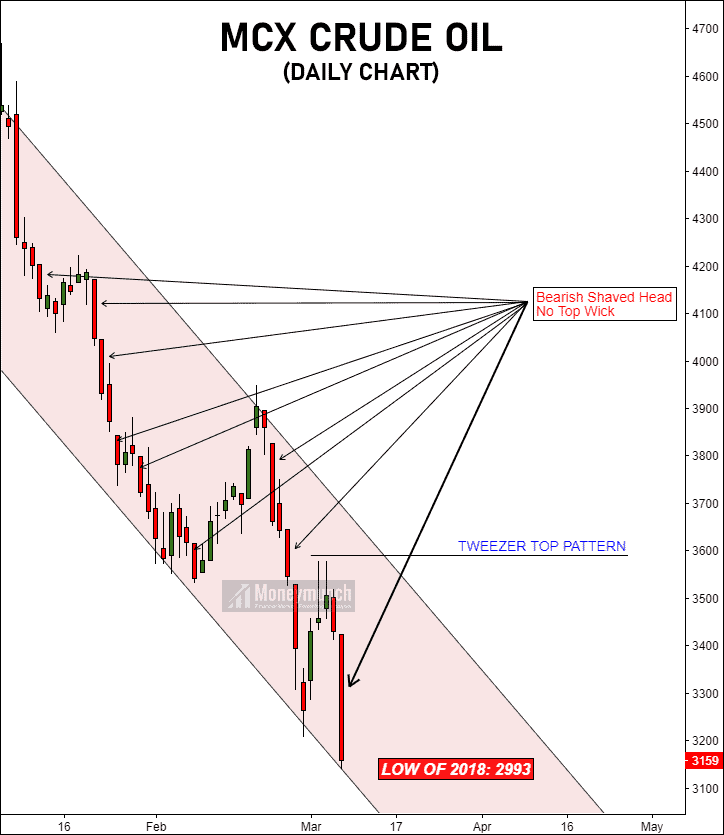
Crude Oil Price Is Getting Ready For Its Next Breakout
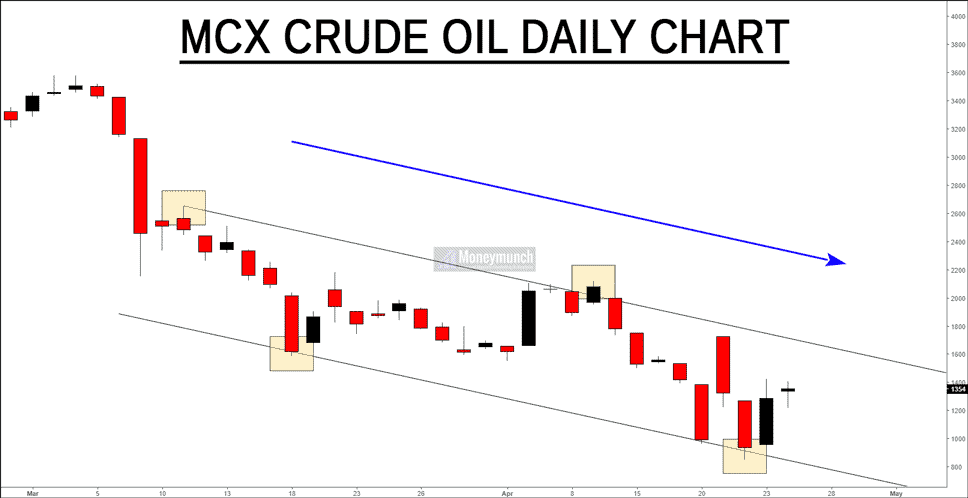
As per the chart and situation, we will see more downside jump in crude oil prices.
Downtrend targets: 800 – 760 – 700 – 600 – 560 below
Traders can stop selling if it closed above the 1600 level or watch out the resistance trendline.
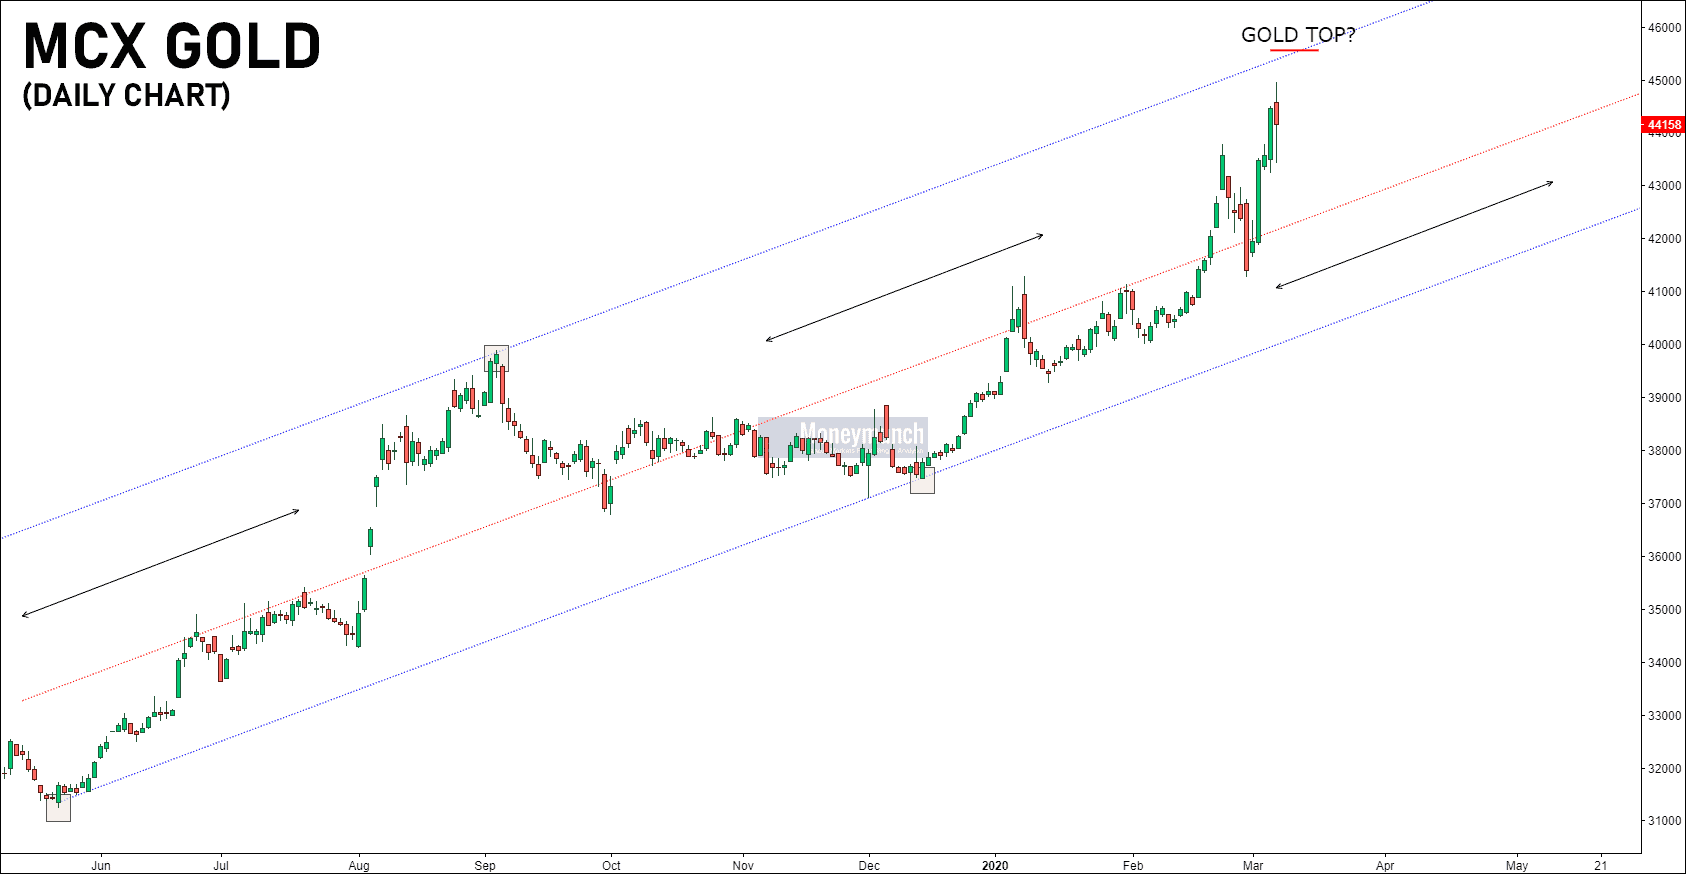
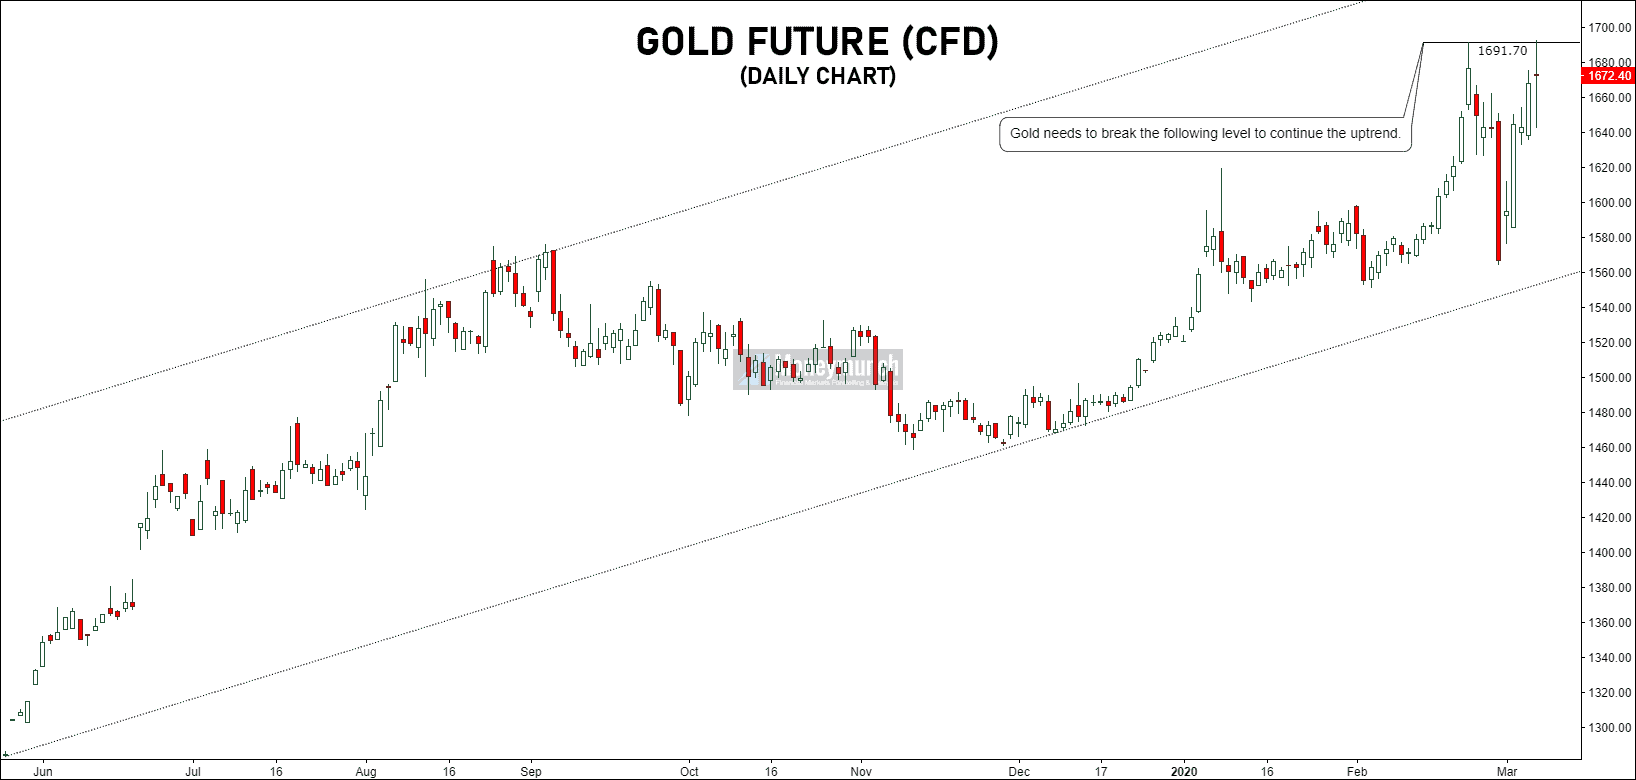
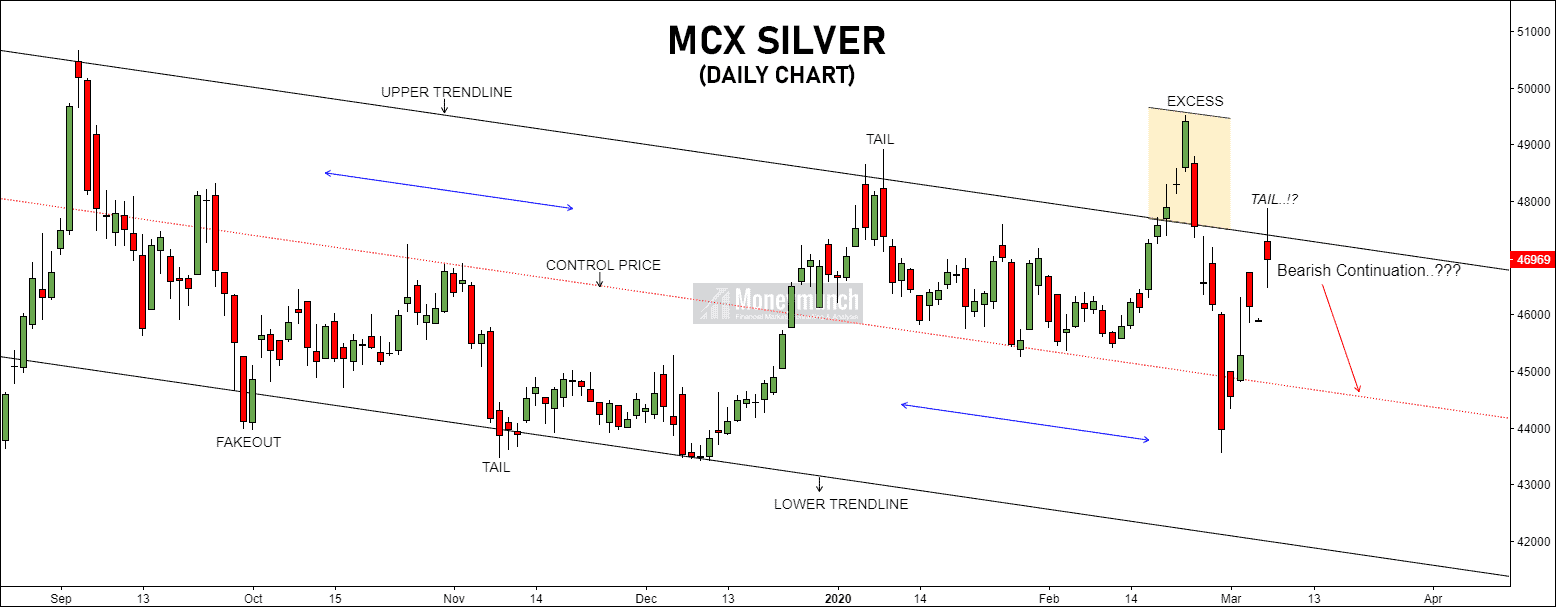
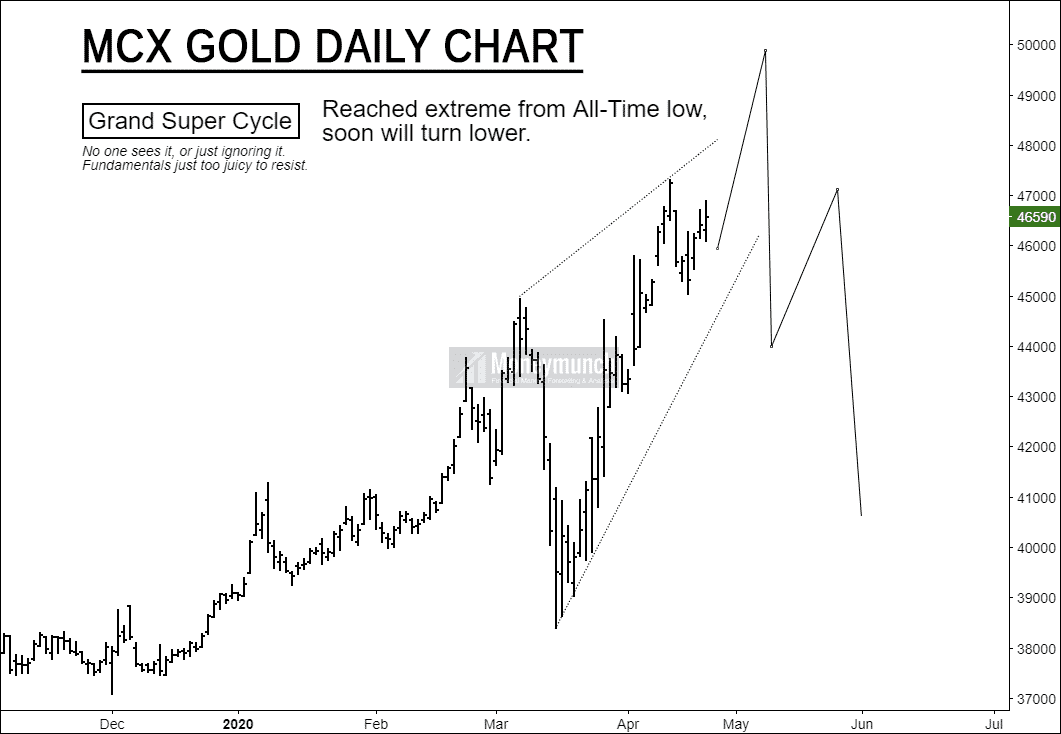
In the next report, we will update on MCX Gold & Silver in-depth.
Guar Gum Sets Up For Another Massive Move Lower
NCDEX Guar Gum Futures is close to March low. It will keep falling if that level breaks.
Targets: 4660 – 4500 – 4400
Note: position can be initiated after a breakout of March low.
Don’t miss out to read the previous agri-commodity trading alerts report: Free Jeera & Cotton Tips
To become a subscriber, subscribe to our free newsletter services. Our service is free for all.
Continue reading