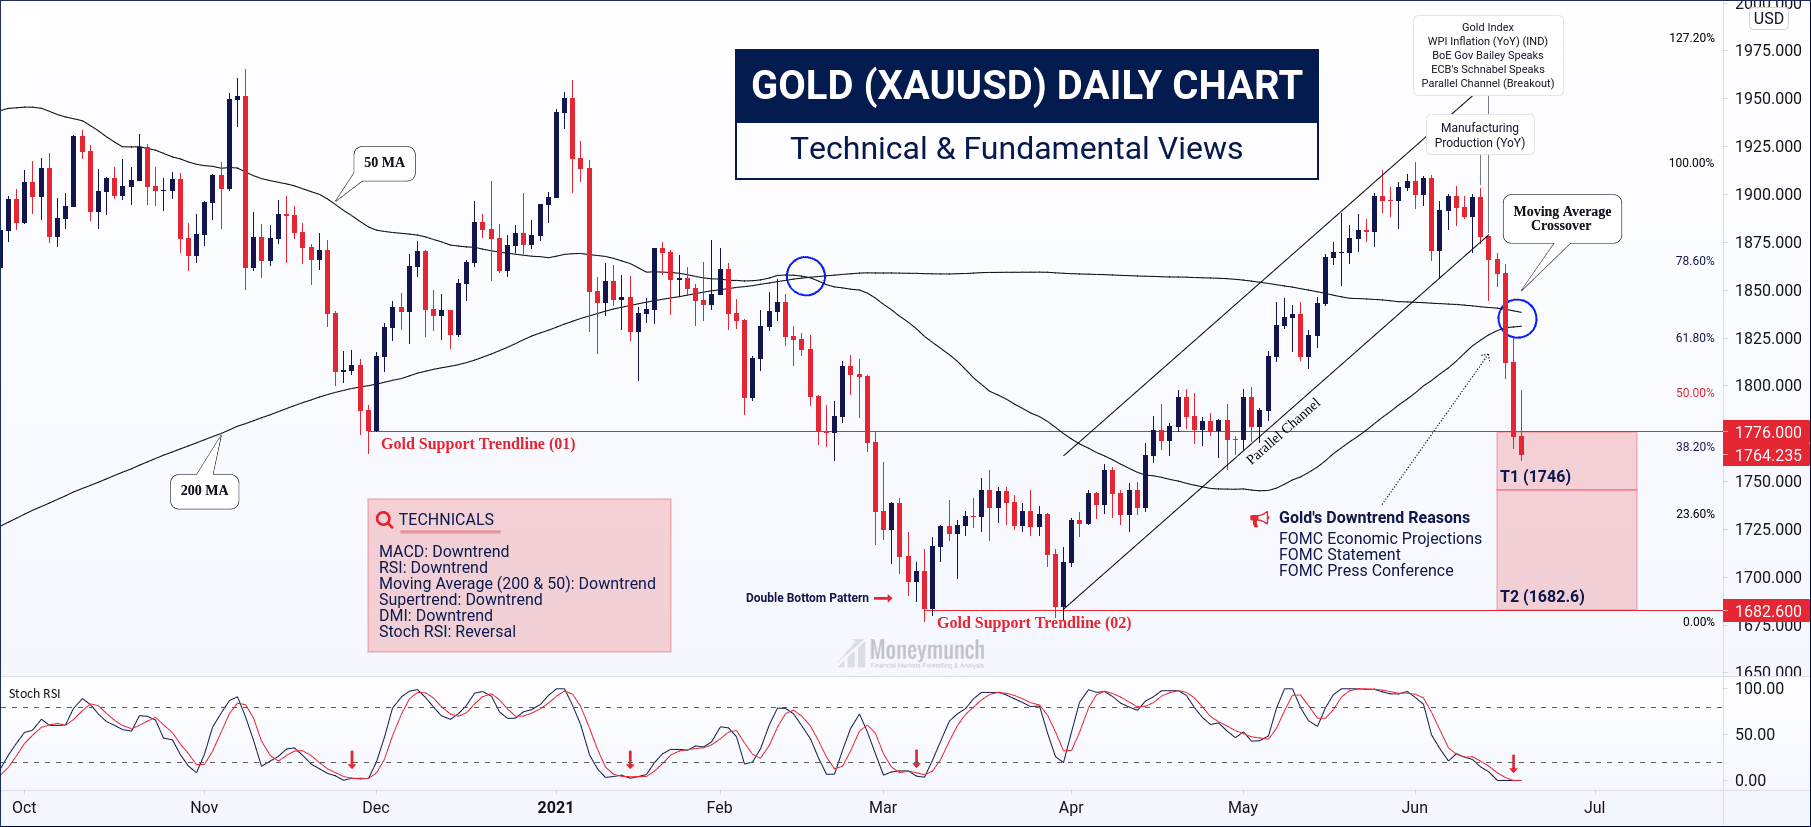
On 16 July, gold has crashed over $60 during the FOMC event. At that time, Commodity Futures Trading Commission (CFTC) data was highlighting selling pressure.
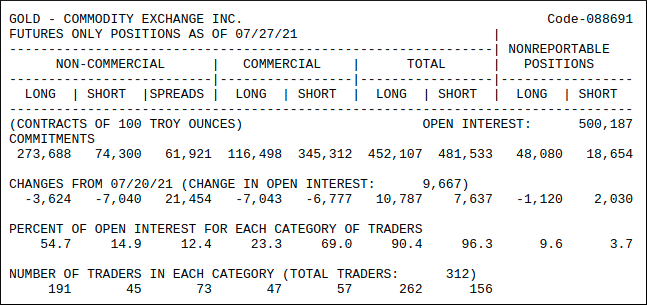
And on 27 July, CFTC data was said OI (Open Interest) of a gold future contract is 500,187 and total shorts 481,533 & buys 452,107. But, gold prices increased.
We have to notice that the bullish rally wasn’t powerful compare to the 16 July data. And selling pressure has higher compare to buyers. Hence, gold has moved bearish side in the last trading session.
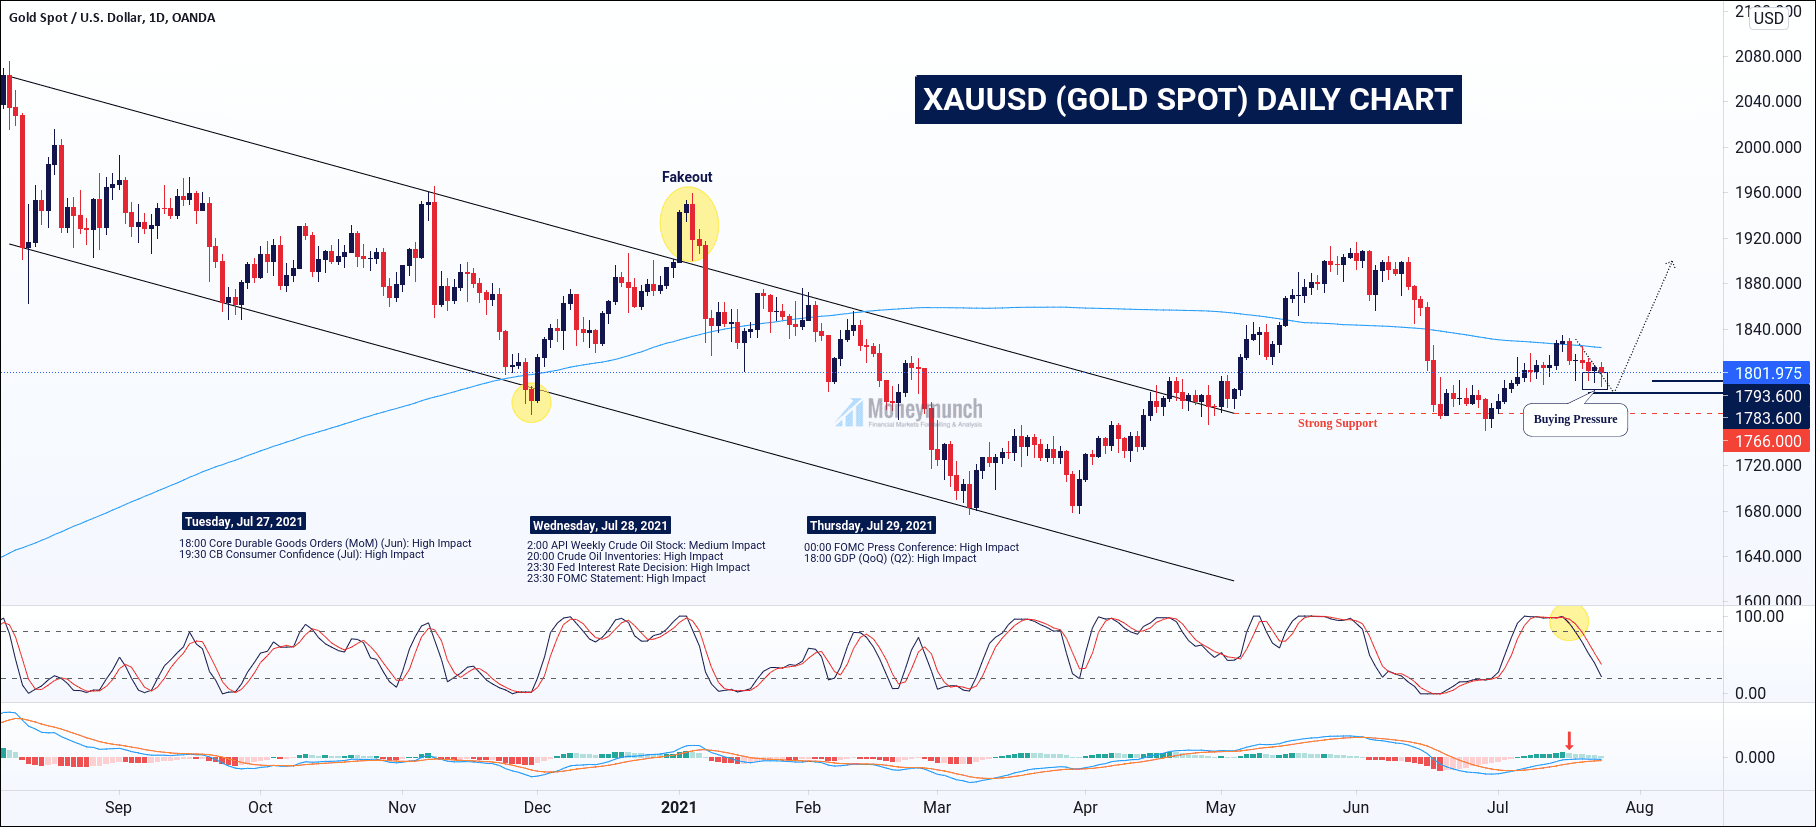
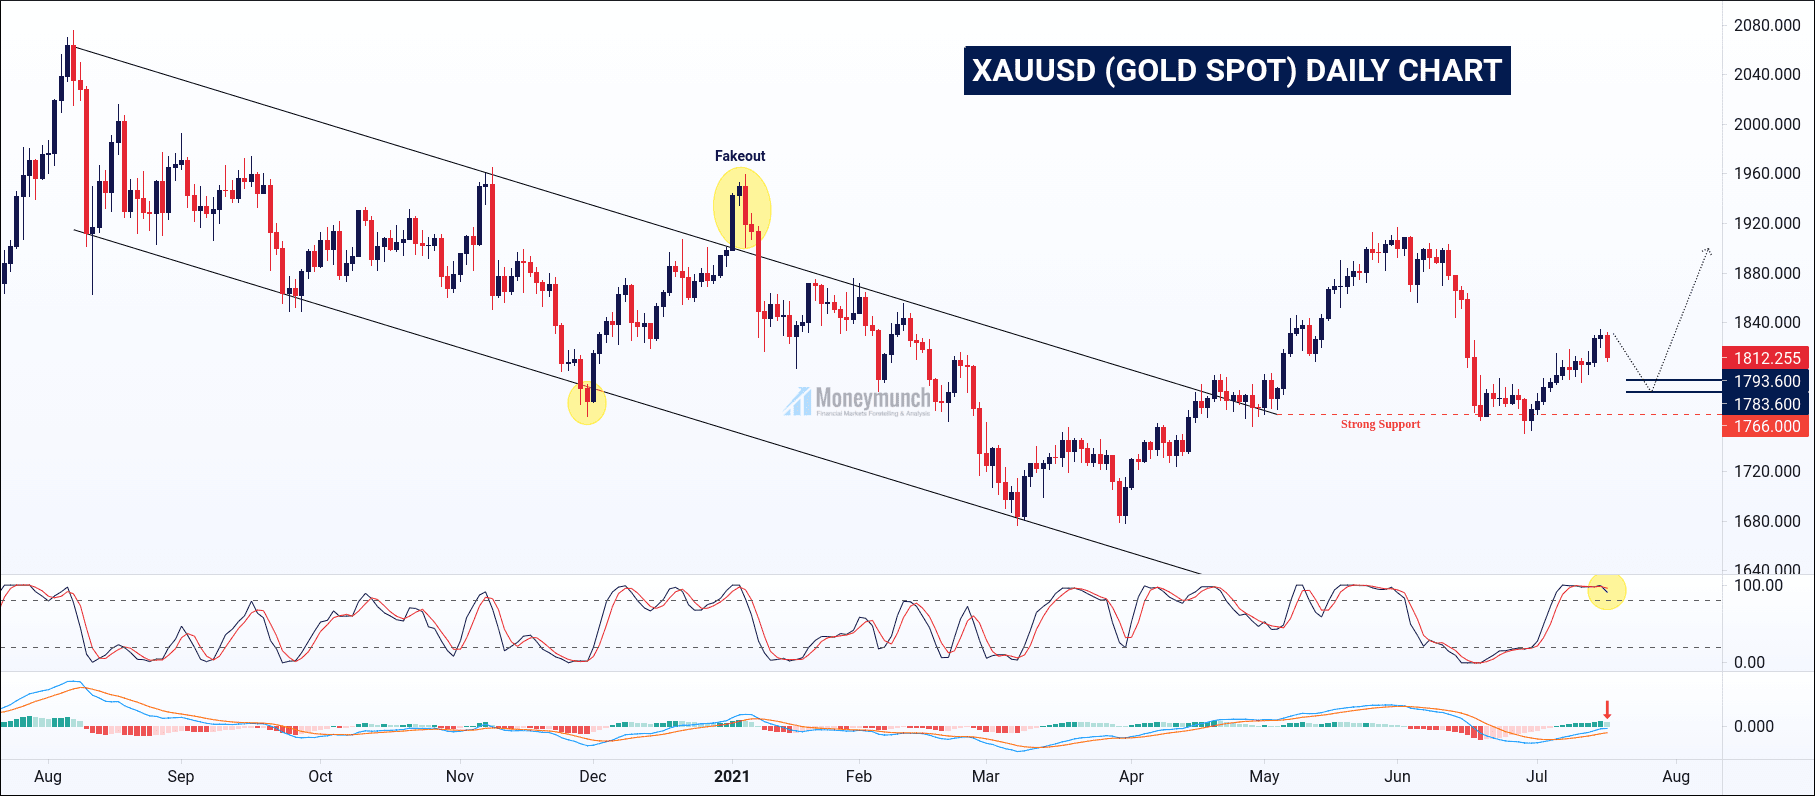
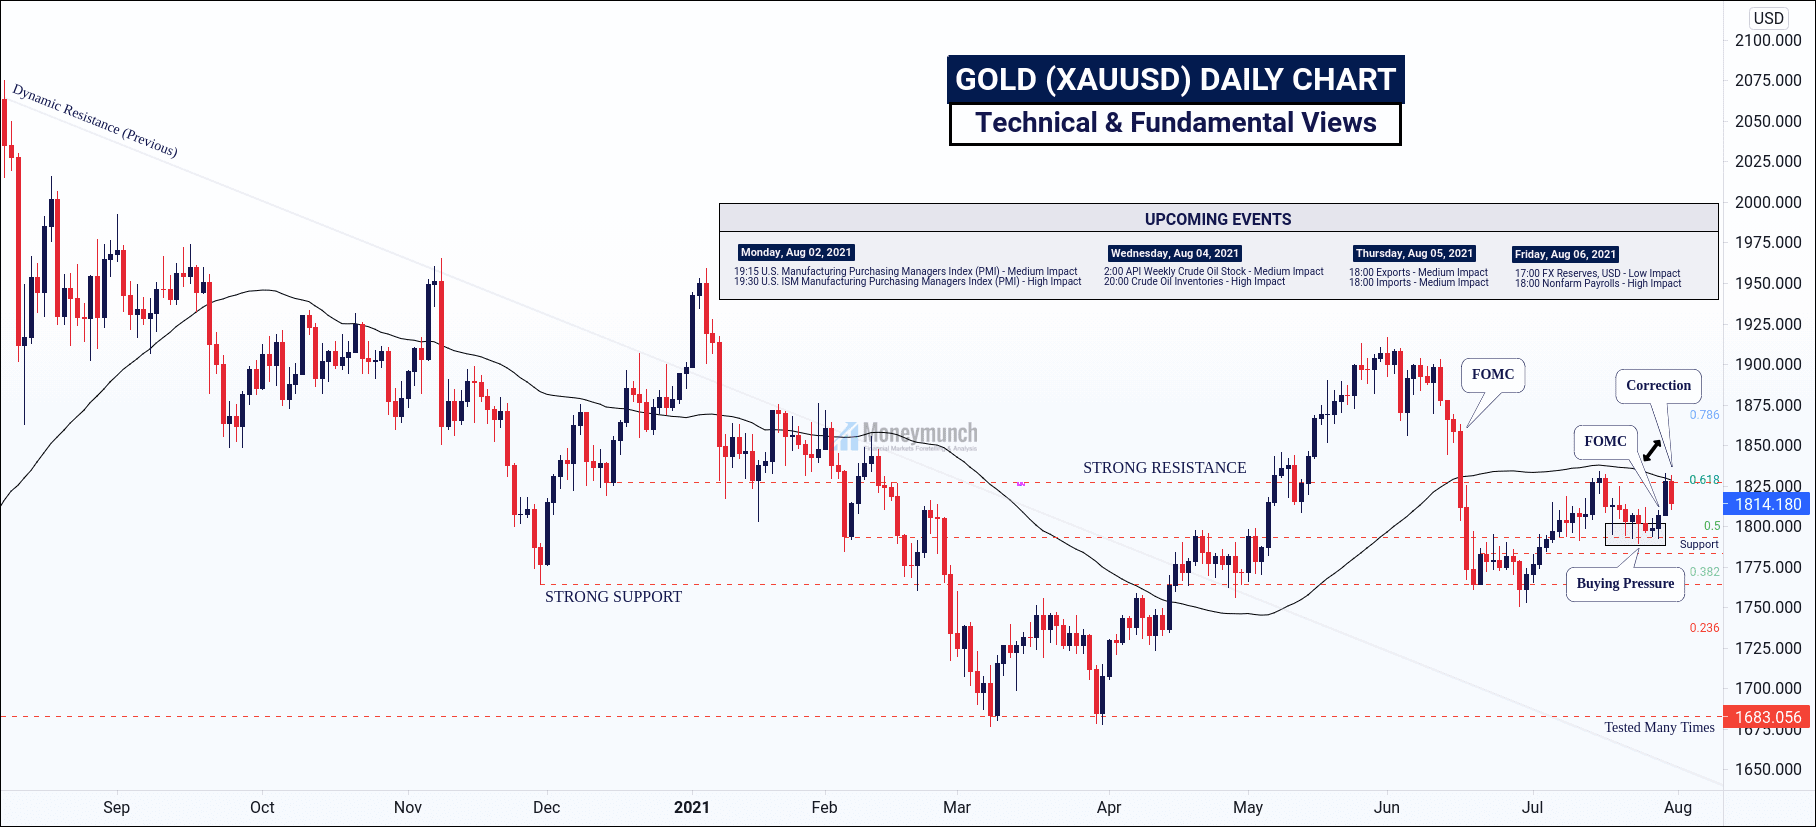
If gold wants to move upside, then it has to crossover my strong resistance. That will lead the gold’s prices above 1840 – 1860 – 1882 – 1900.
But if you focus fundamentally & CFTC data, XAUUSD will keep falling and touch the following targets: 1800 – 1793.6 – 1783.6 – 1763.6. Gold is making double top formation also.