
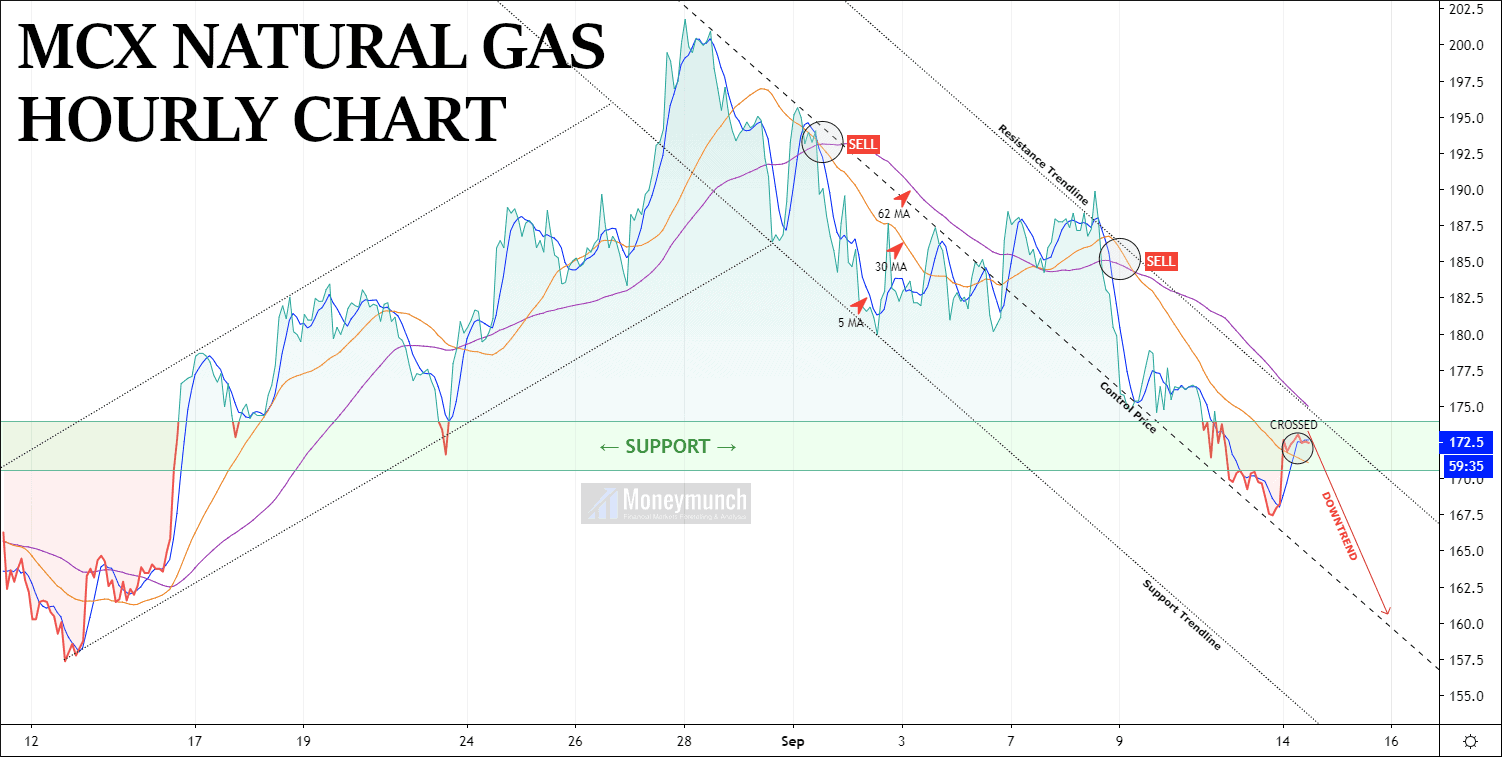
On the chart above, we have plotted three different MAs on the 1-hour chart of Natural gas futures. As you can see, the 62 MA is indicating a downtrend ahead. And 5 MA & 30 MA are crossing each other for a reversal. This reversal can be for 174 to 180 levels.
But according to the support & resistance trend line, we may see continue price collapsing.
I have also highlighted a support area with green color. Particularly, from this point, it’s taking a U-turn.
For safe traders, short positions can be initiated after 170 levels.
Targets: 167.6 – 165 – 162.6 – 160
To become a subscriber, subscribe to our free newsletter services. Our service is free for all.
Get free MCX ideas, chart setups, and analysis for the upcoming session: Commodity Tips →
Have you any questions/feedback about this article? Please leave your queries in the comment box for answers.
How do you think Natural Gas is going to do! I’m new to this!!!!!
Just want to say a big thank you for the gold advice it has touched all targets.