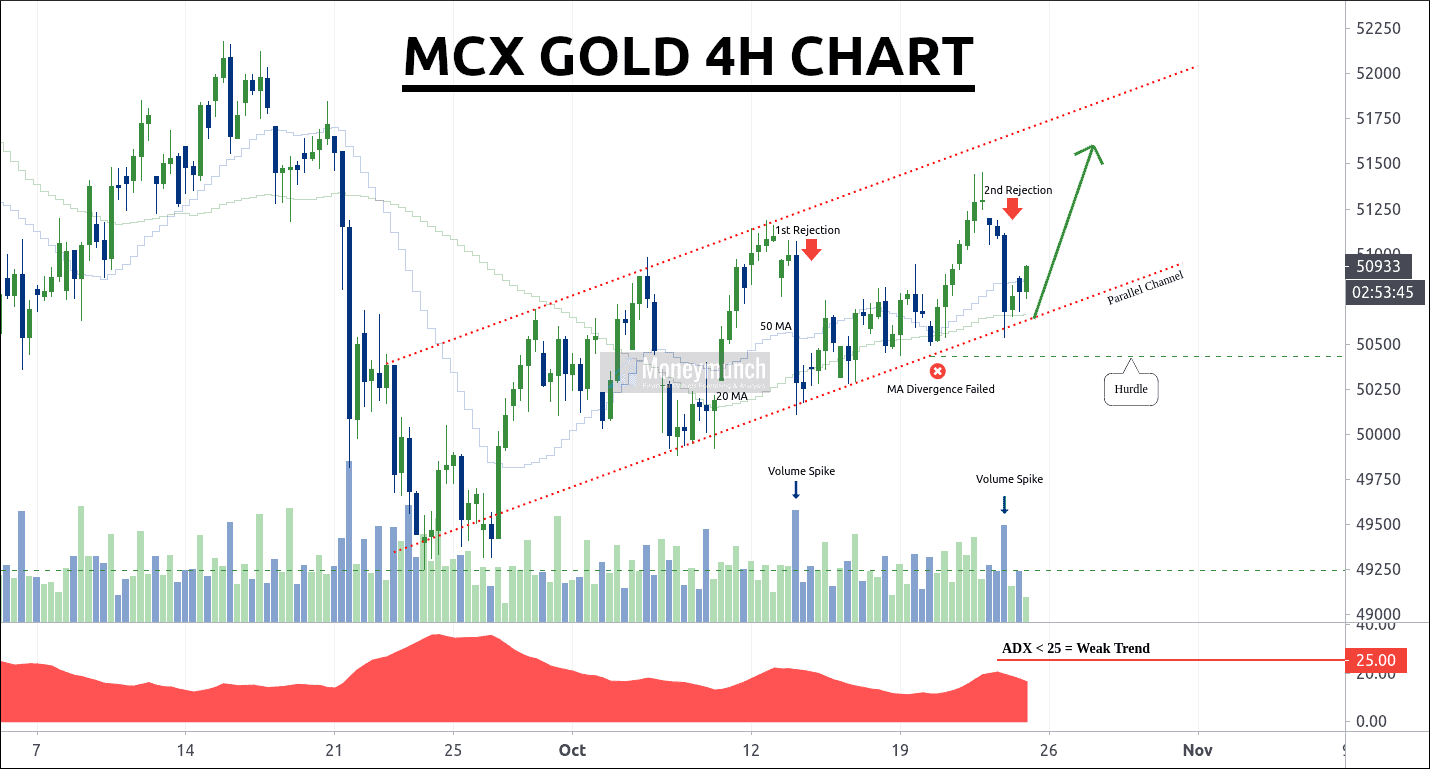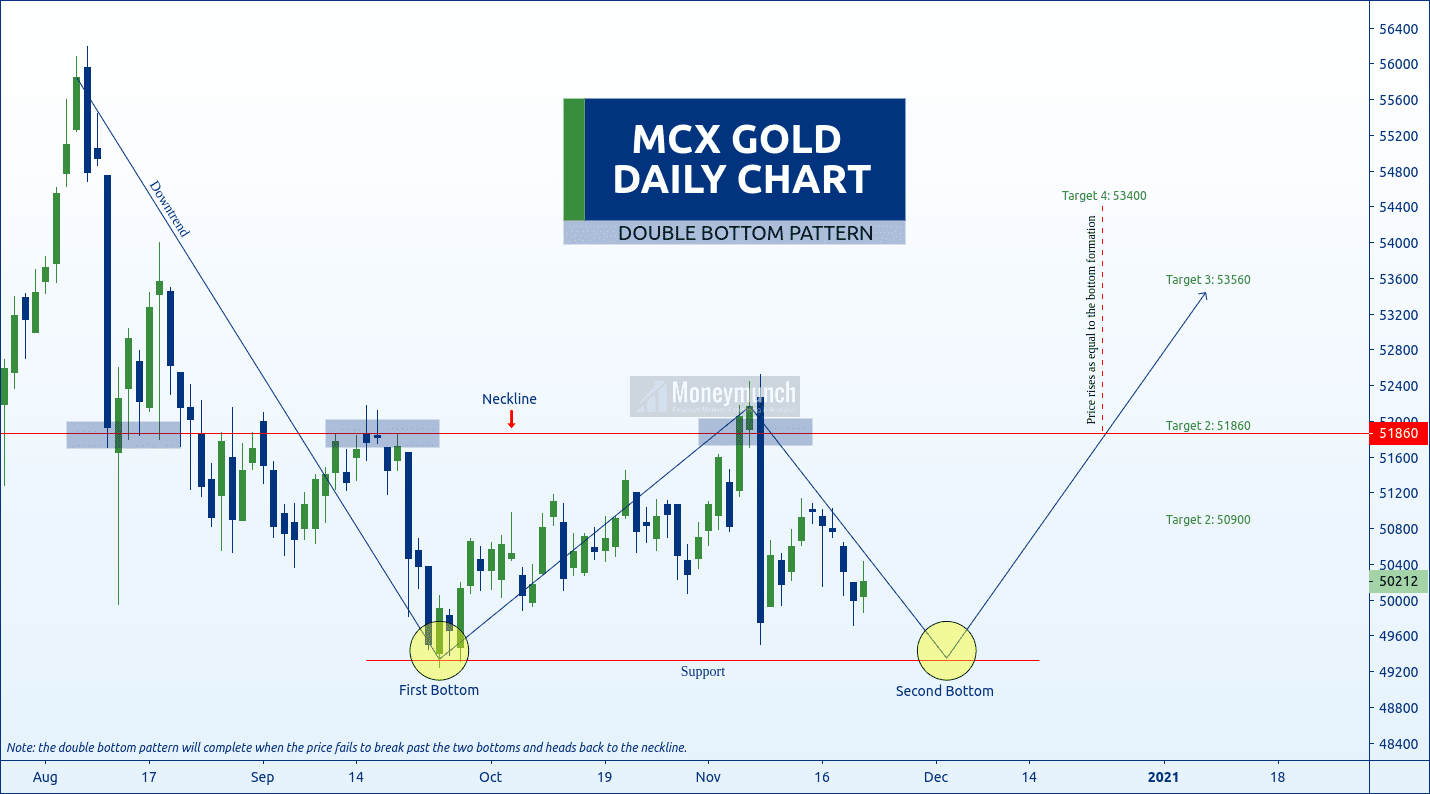
In the last two weeks, MCX gold has lost -2003 points. We may see a continued downtrend up to the support line (Range: 49600 – 49200). Intraday traders can play between free-fall by taking it as a target.
As mentioned in the chart, the double bottom pattern will complete when the price fails to break past the two bottoms and heads back to the neckline.
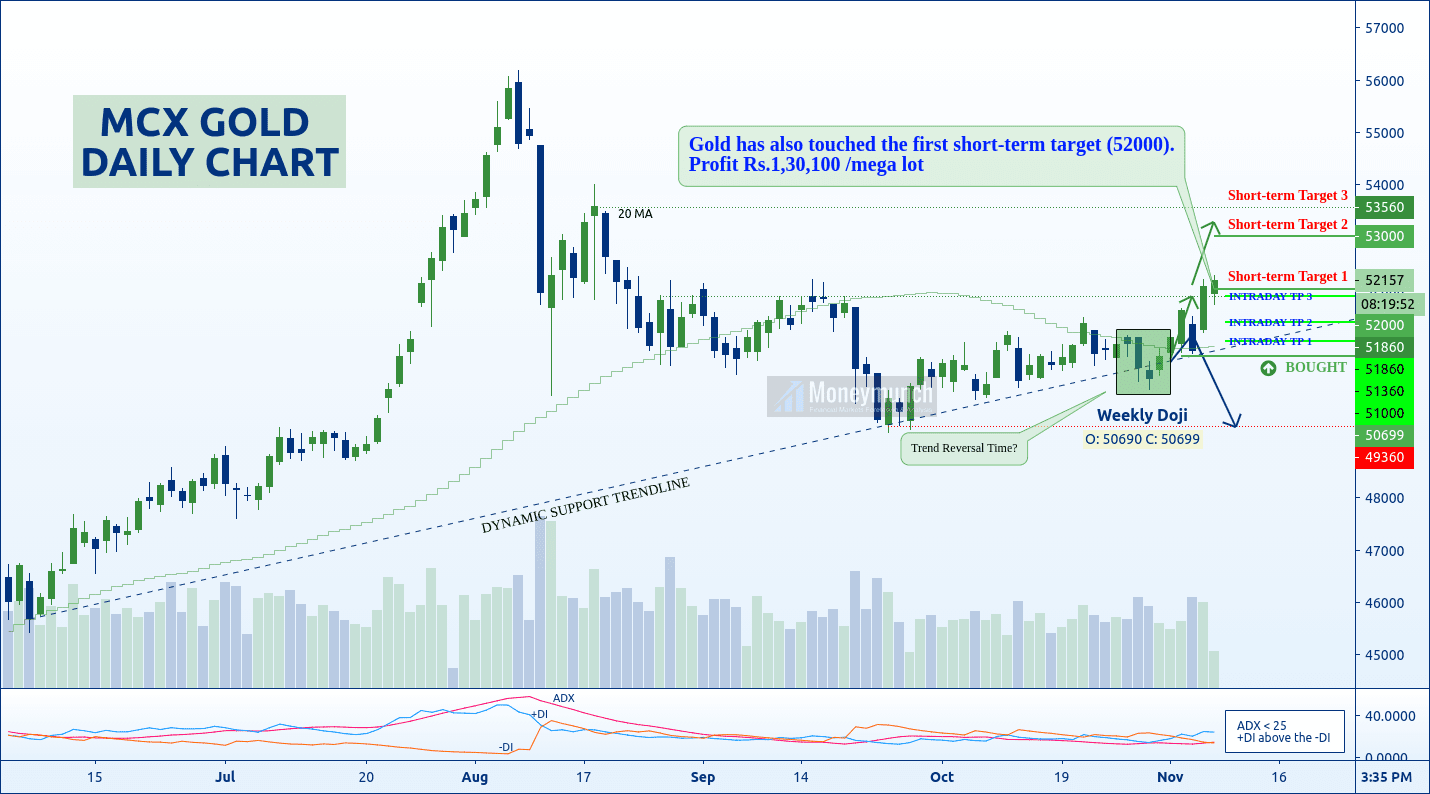
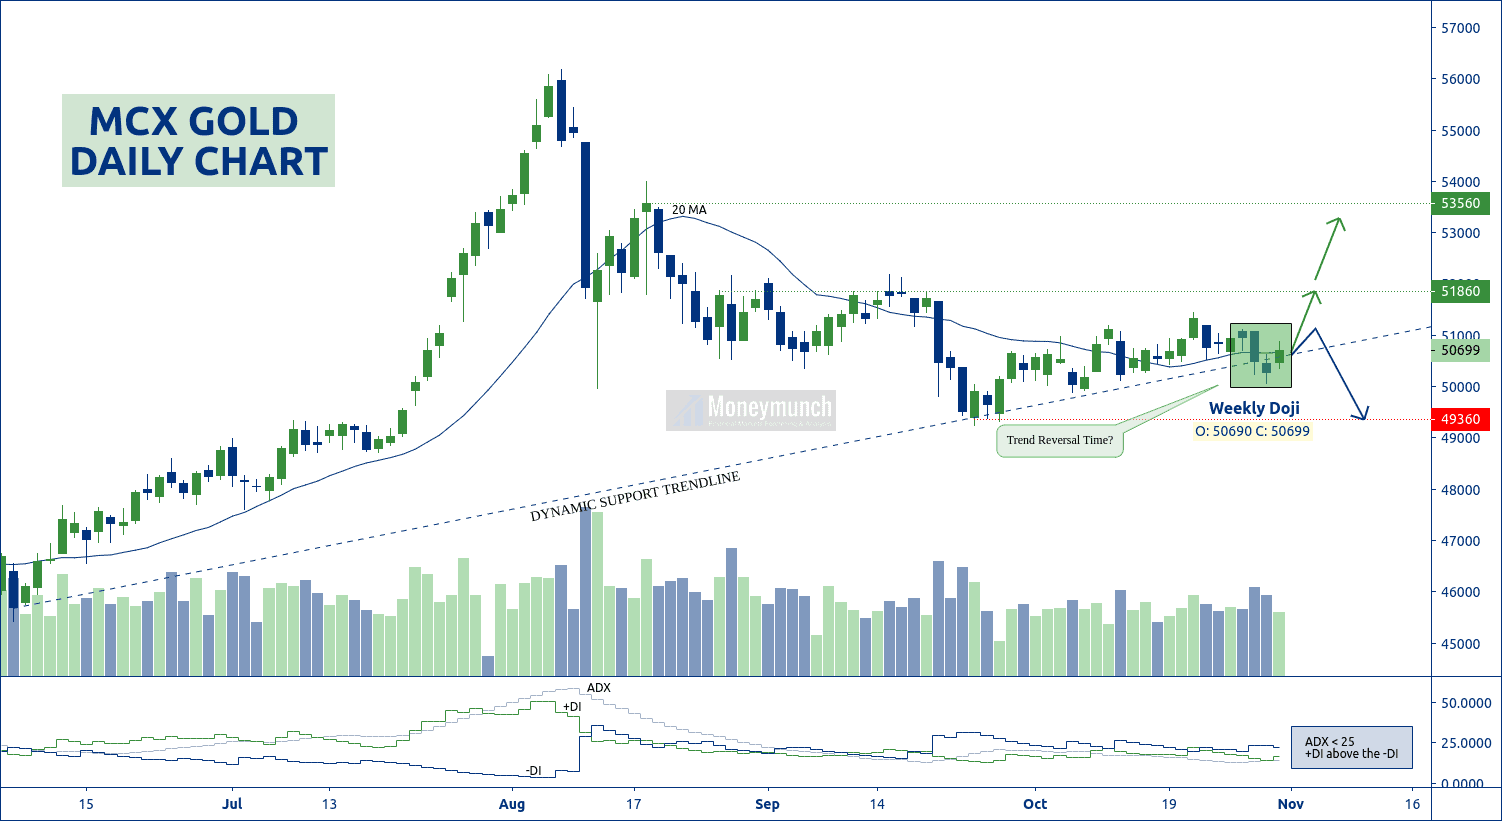
Short-term targets: 50900 – 51860
Long-term targets: 53560 – 53400
But if gold fails to complete the double bottom pattern by breaking the support line, we may see continue downward movements. And the gold price will come at/below 48760 – 48000 levels.
If it happens, I will update you ASAP. To become a subscriber, subscribe to our free newsletter services. Our service is free for all.
Continue reading