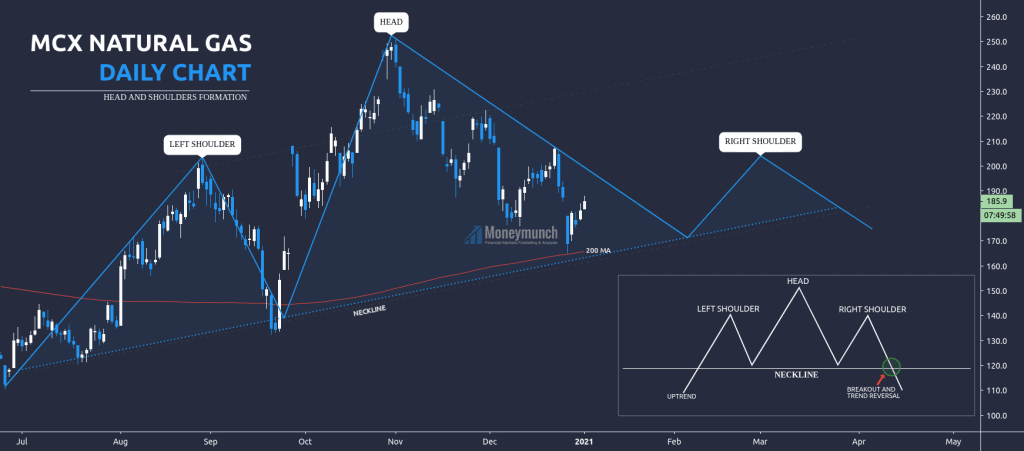
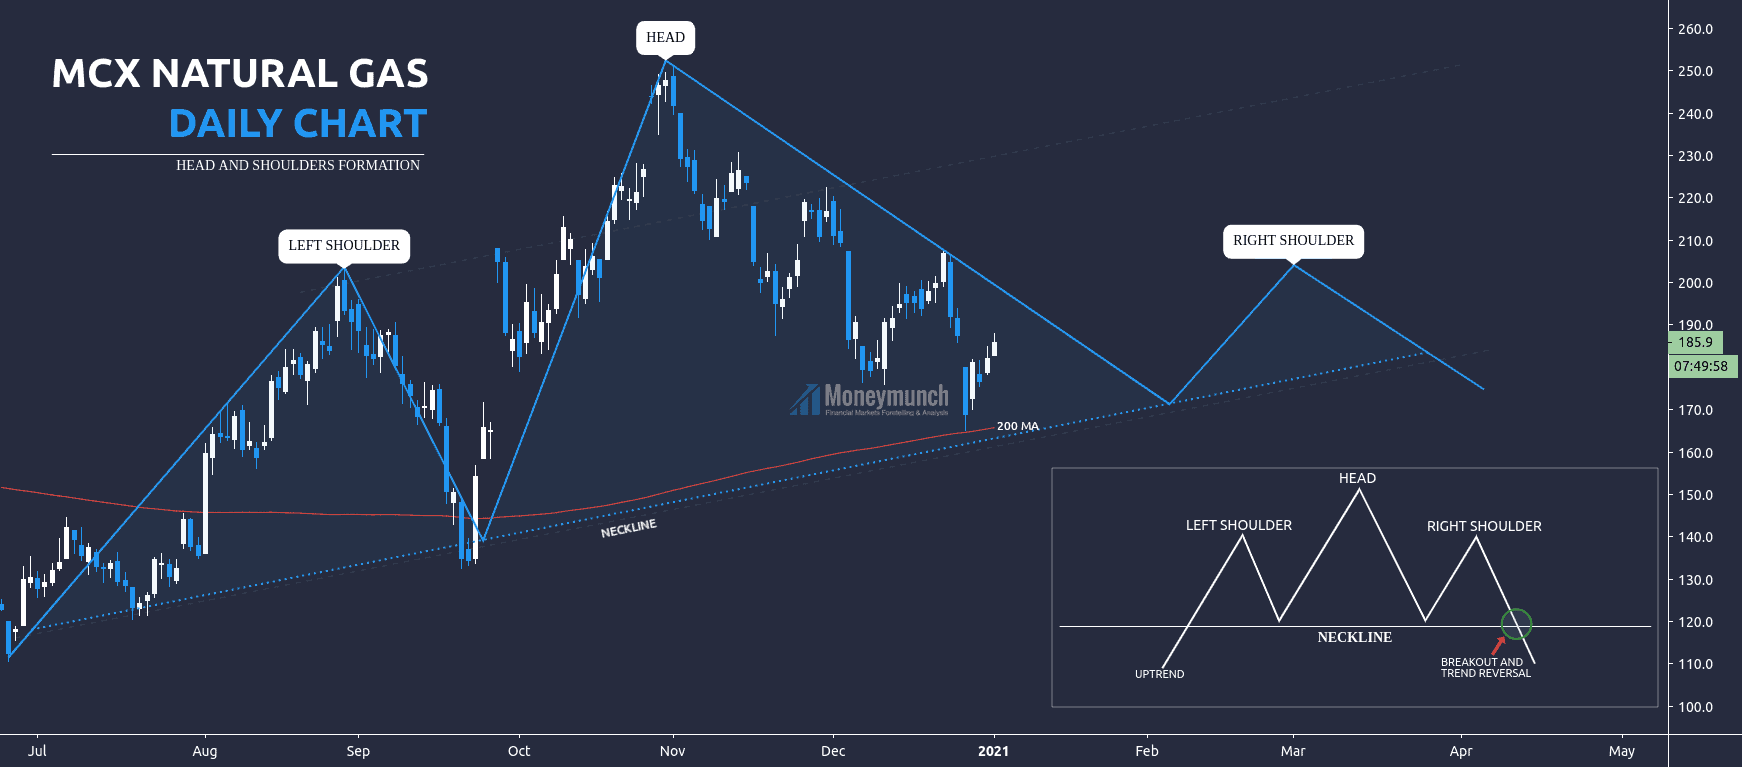
Natural gas started to make the head and shoulders pattern on the daily timeframe. First, let’s understand some basics about the head and shoulders pattern. Here, it’s a bearish head and shoulders pattern. In this pattern, the trend starts with the uptrend and makes the left shoulder, head, and the right shoulder. And after the completion of the right shoulder, it falls by breaking the neckline.
In this chart, the trend completed the left shoulder, and the head is almost there. And then it will create the right shoulder. It will fall up to the neckline to complete the formation of the head. And the targets to reach the neckline are as following, 180 – 175 – 168.
After hitting the neckline, the next step of natural gas will be the right shoulder. As per the rules, the right shoulder can be similar to the left shoulder or, it can be at a higher level than the left shoulder. Because the left shoulder is at 203, the trend will march again to 203 to make the right shoulder. To reach 203, natural gas will hit 180 – 190 – 200.
And then the trend will take reversal and fall by breaking the neckline.
Targets: 195 – 185 – 175.
To become a subscriber, subscribe to our free newsletter services. Our service is free for all.
Get free MCX ideas, chart setups, and analysis for the upcoming session: Commodity Tips →
Have you any questions/feedback about this article? Please leave your queries in the comment box for answers.


Your ideas are amazing thank you for sharing
So clear and ane easily explained 👌
I have searched on the Google and got moneymunch as a suggestion, I went through the site. Tagets are accurate, charts are easy to understand I joined and subscribed your premium plan. Thank you
Very nice explained head and shoulders pattern
Great targets achieved
First two targets reached should I wait for 200?
Well explained
Mcx me crude oil aur natural gas me interest hain.