Gold Price Predictions for 2022

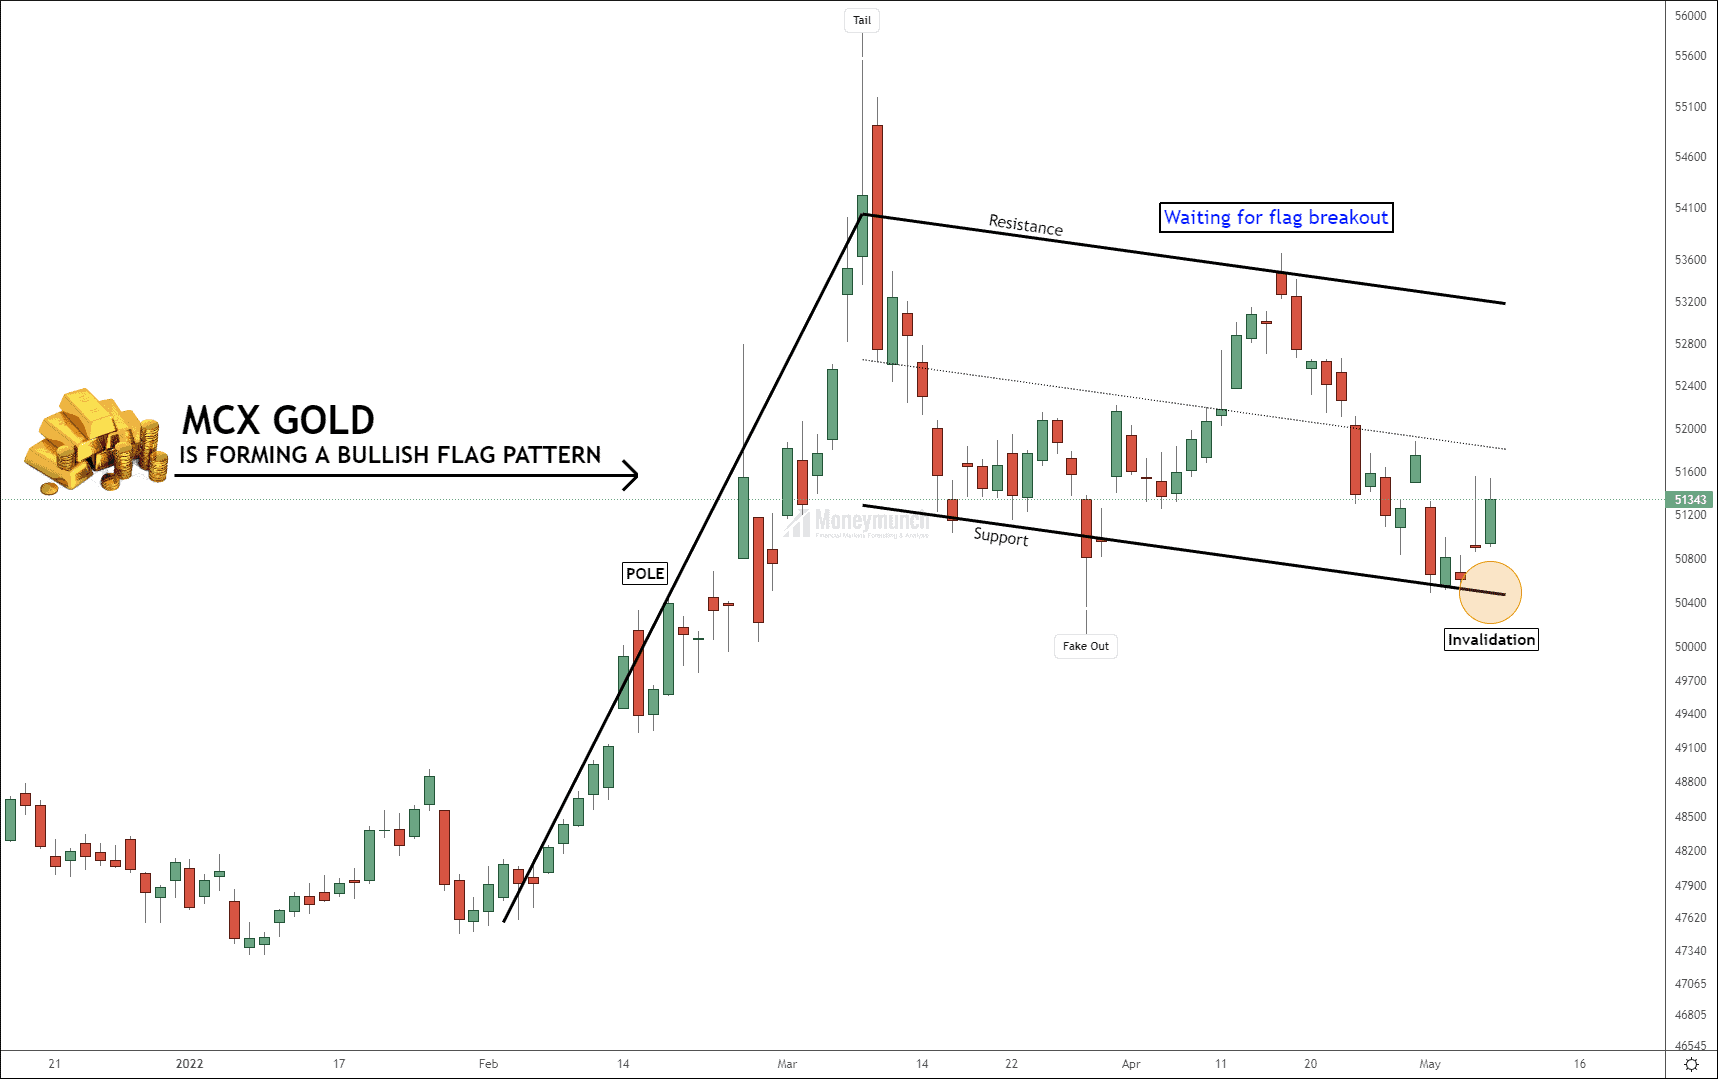
In the previous trading session, MCX Gold made a high of 51538 and closed at 51343 (+444). A question is, is it moving upward?

To identify uptrend:

There are two hurdles to continuing the uptrend. It should break out the 5th May high or settle above the control line. According to the above chart, Gold is forming a bullish flag pattern. And we’re waiting for a breakout of the flag pattern. This breakout will skyrocket the gold price, and we can see 6400+ points of bullish movement here. Long-term target for gold 58000 – 60000.

Gold downtrend confirmation:

Continue reading

MCX Gold & Nickel – Profit Booking Time

Free mcx gold chart tips

Did you read the gold report? If not, click the below link.
22 Feb 2022: MCX Gold’s Bullish Mode Activated

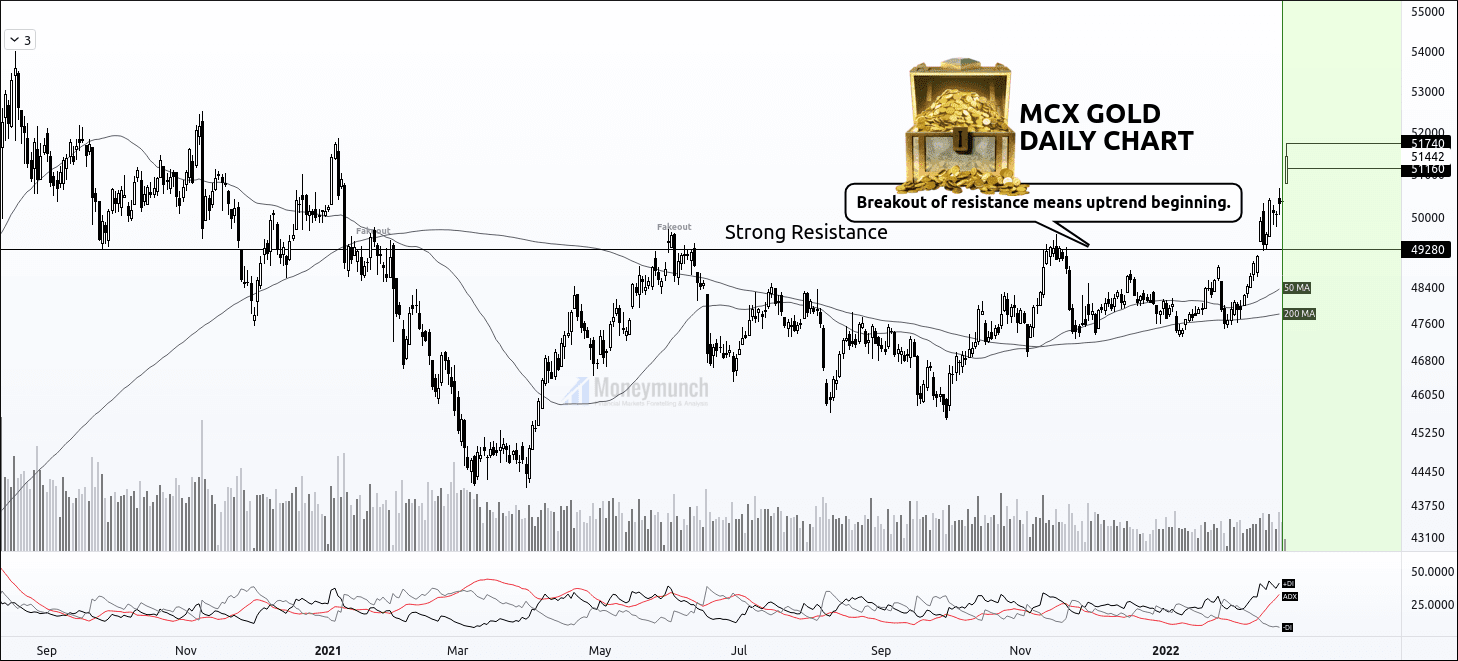
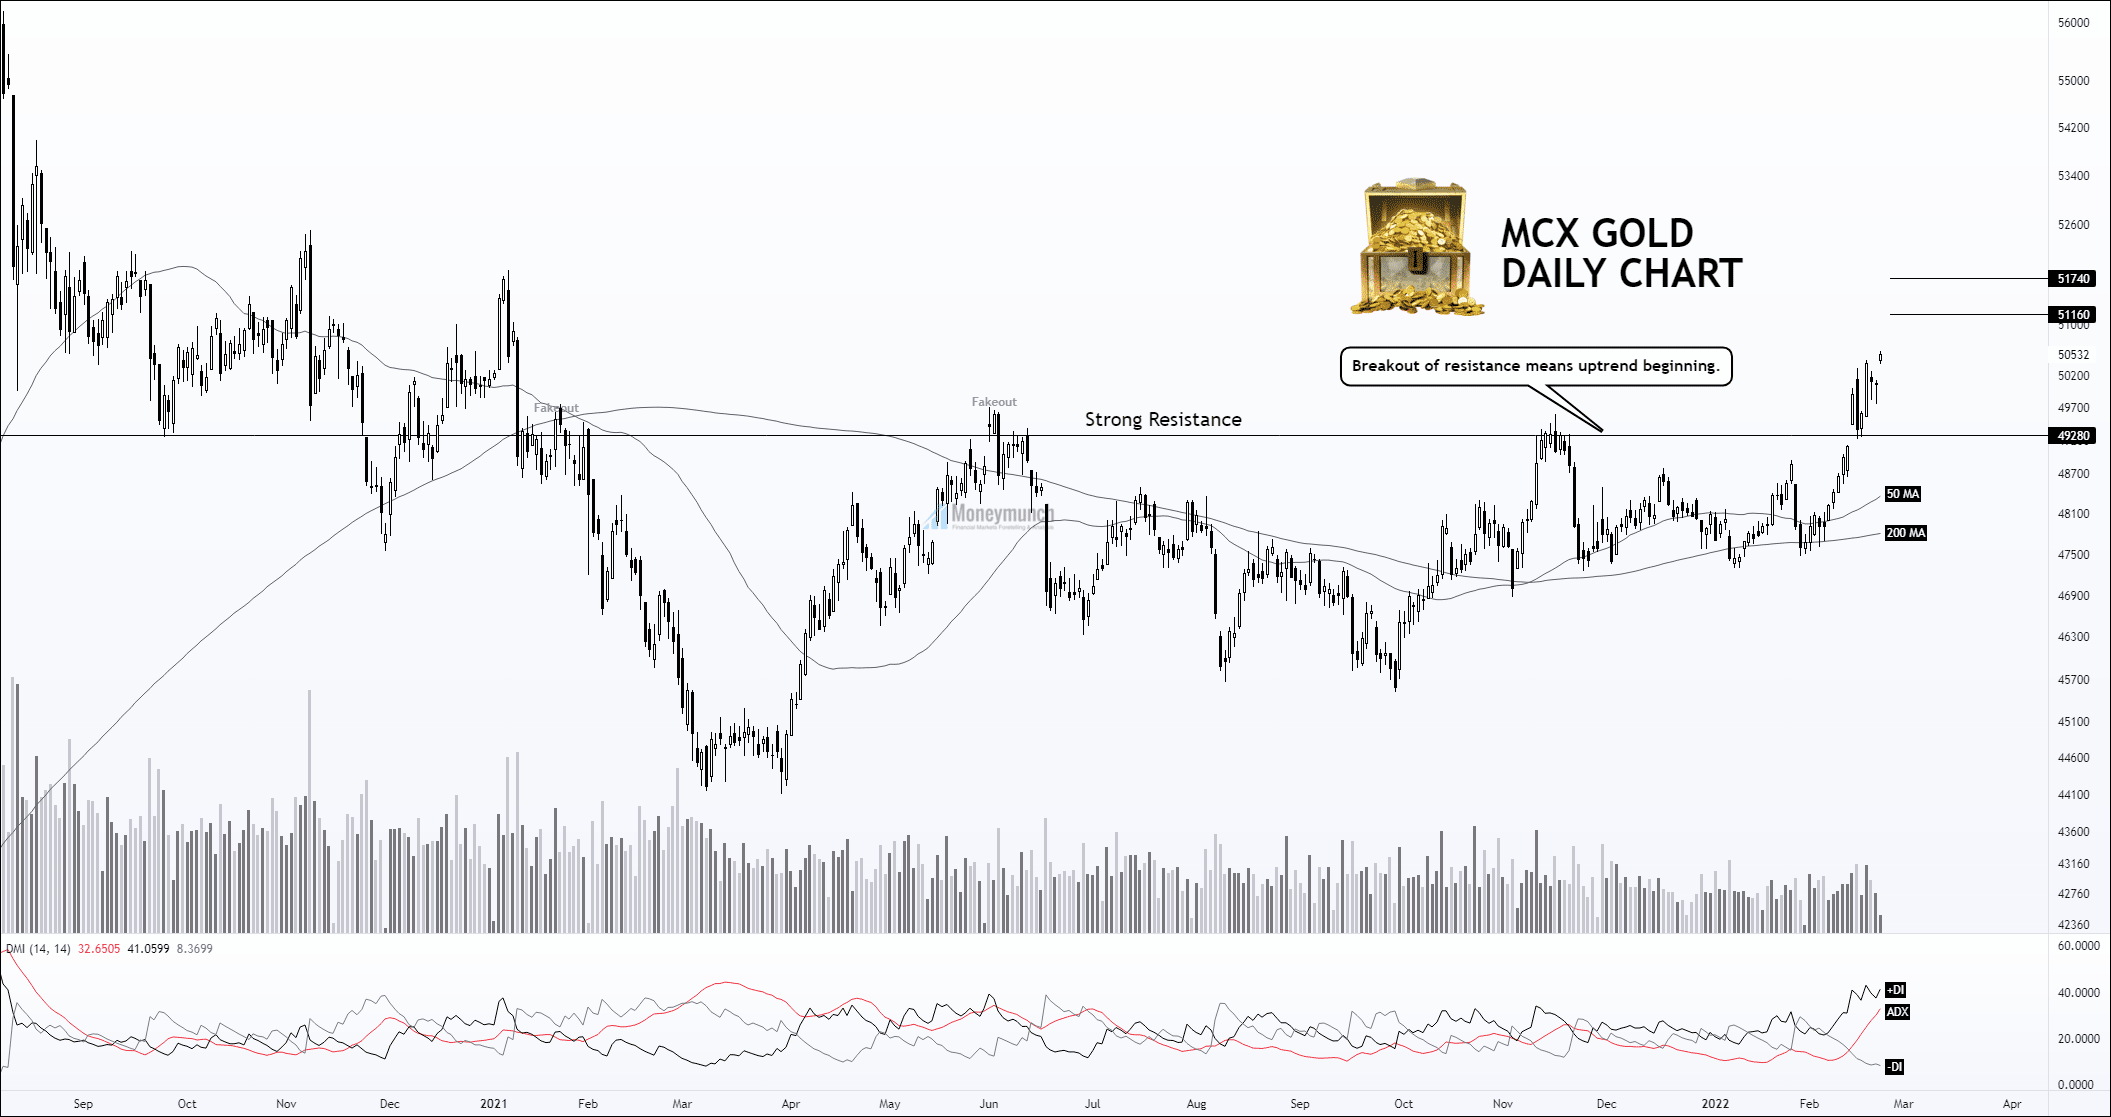
While the gold price at 50532, I had written, “we will see the gold price above 51160 – 51740“.

Today, it has touched the first & second target. Who bought it? Profit per lot: Rs.1,20,800

Free mcx nickel chart calls

I have updated a full report of Nickel on Feb 6, 2022. Did you read it? If not, click the below link:
2020’s Uptrend Channel Is Everything For MCX Nickel

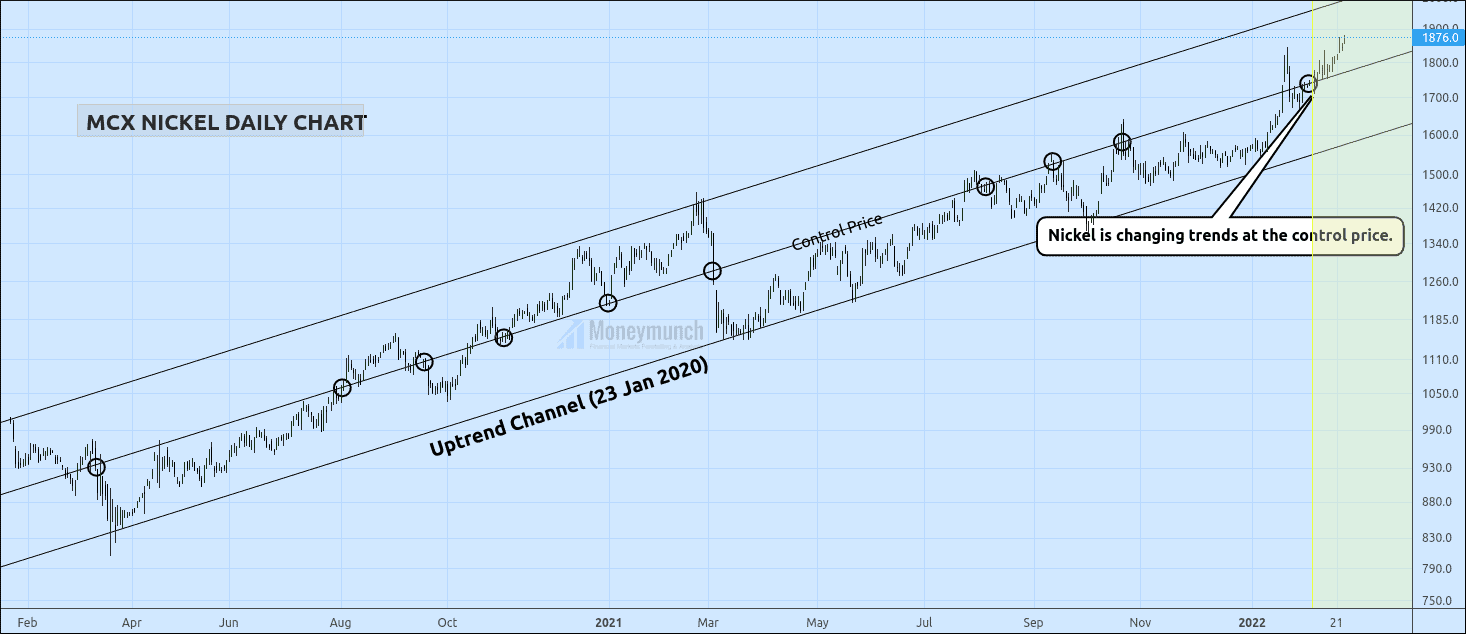
I had written, “It’s a sign for a buy signal. But intraday or short-term investors should confirm that breakout before proceeding. And they must look out for candle’s fakeout. Afterward, be ready for the targets of 1800 – 1840 – 1876+“.

Today nickel has touched all targets. Who bought it? The target was 133.4 points. Profit per lot: Rs.2,00,100

What else do you need from a free subscription!? To become a subscriber, subscribe to our free newsletter services. Our service is free for all.

Continue reading

MCX Gold’s Bullish Mode Activated

free commodity gold tips daily chart

Did you read the 26 Jan 2021 article on Gold?
Article: Don’t Get Yourself Into a Bull Trap With MCX Gold

Wherein I have highlighted a strong resistance (SR) which is 49280. It has broken down on 14 Feb 2022. That indicates the MCX gold uptrend is unfolding here. If it consecutively remains above the SR, we will see the gold price above 51160 51740.

The following indicators have been indicating impending advance:
ADX, DMI, and MA

Watch significant releases or events that may affect the movement of gold, silver, and crude oil.

Tuesday, Feb 22, 2022
19:30 S&P/CS HPI Composite – 20 n.s.a. (YoY) (Dec) – Medium Impact
20:15 Manufacturing, Markit Composite, & Services PMI (Feb) – Medium Impact
20:30 CB Consumer Confidence (Feb) – High Impact

Thursday, Feb 24, 2022
03:00 API Weekly Crude Oil Stock – Medium Impact
19:00 GDP (QoQ) (Q4), and Initial Jobless Claims – High Impact
21:00 Natural Gas Storage – Low Impact
21:30 Crude Oil Inventories – High Impact
22:30 FOMC Member Mester Speaks – Medium Impact

To become a subscriber, subscribe to our free newsletter services. Our service is free for all.

Continue reading

2020’s Uptrend Channel Is Everything For MCX Nickel

free commodity mcx nickel daily chart tips

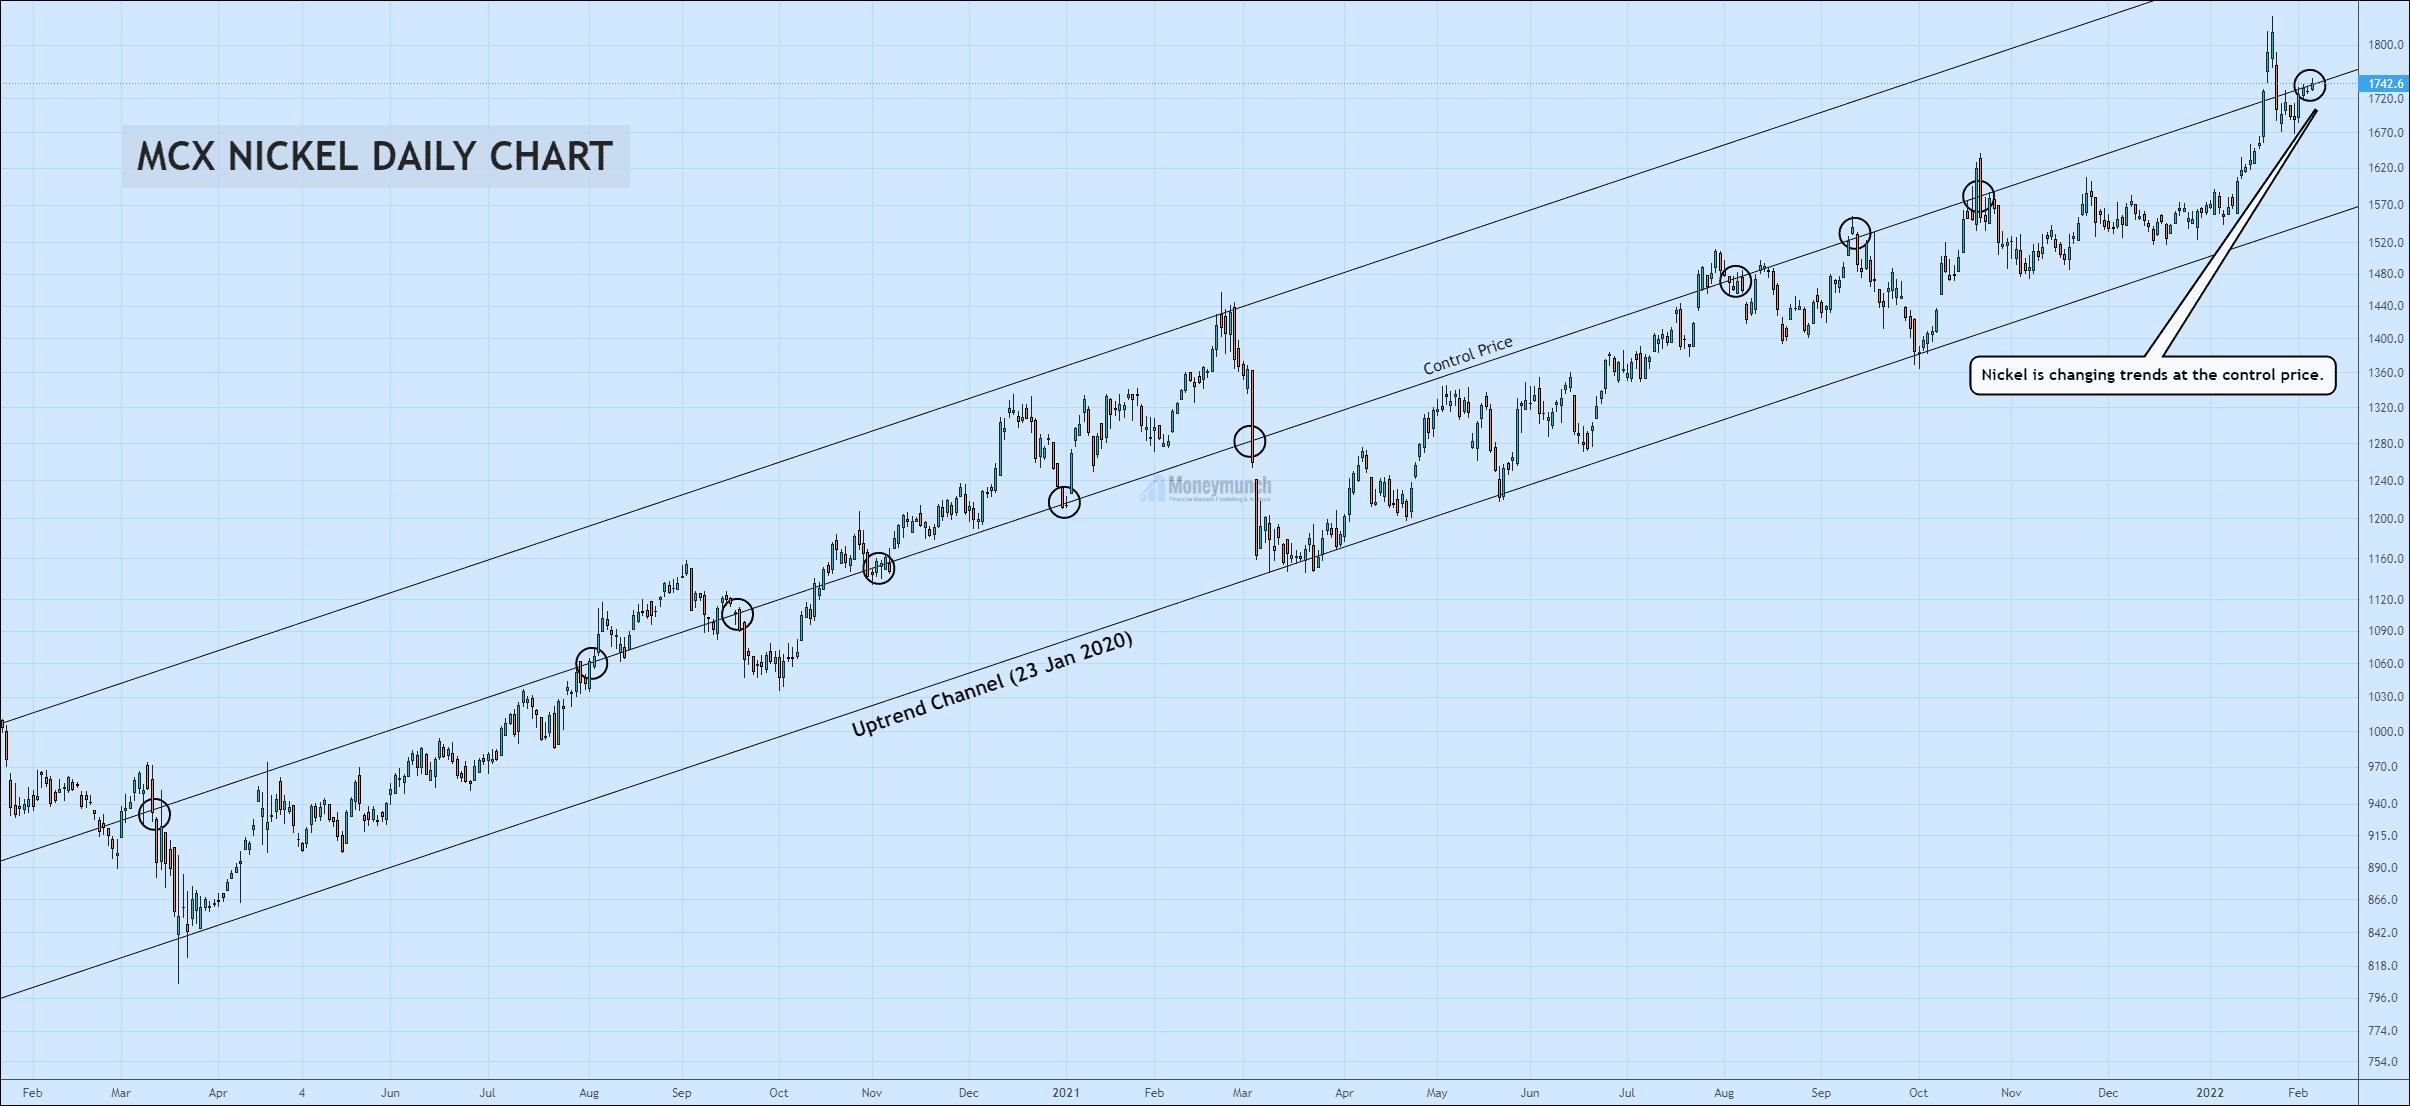
MCX Nickel is following the above uptrend channel from 23 Jan 2020. And making a good trade opportunity for commodity traders. Nickel’s upward trend is not over yet. But we may see a downfall below the control price, and it can be up to 1686 – 1620.

But what happens if it breaks the control price?

It’s a 100% sign for a buy signal. But intraday or short-term investors should confirm that breakout before proceeding. And they must look out for candle’s fakeout. Afterward, be ready for the targets of 1800 – 1840 – 1876+.

To become a subscriber, subscribe to our free newsletter services. Our service is free for all.
Continue reading

Will ICOMODEX Energy Reach 7500 Before March End?

Free mcx energy index calls

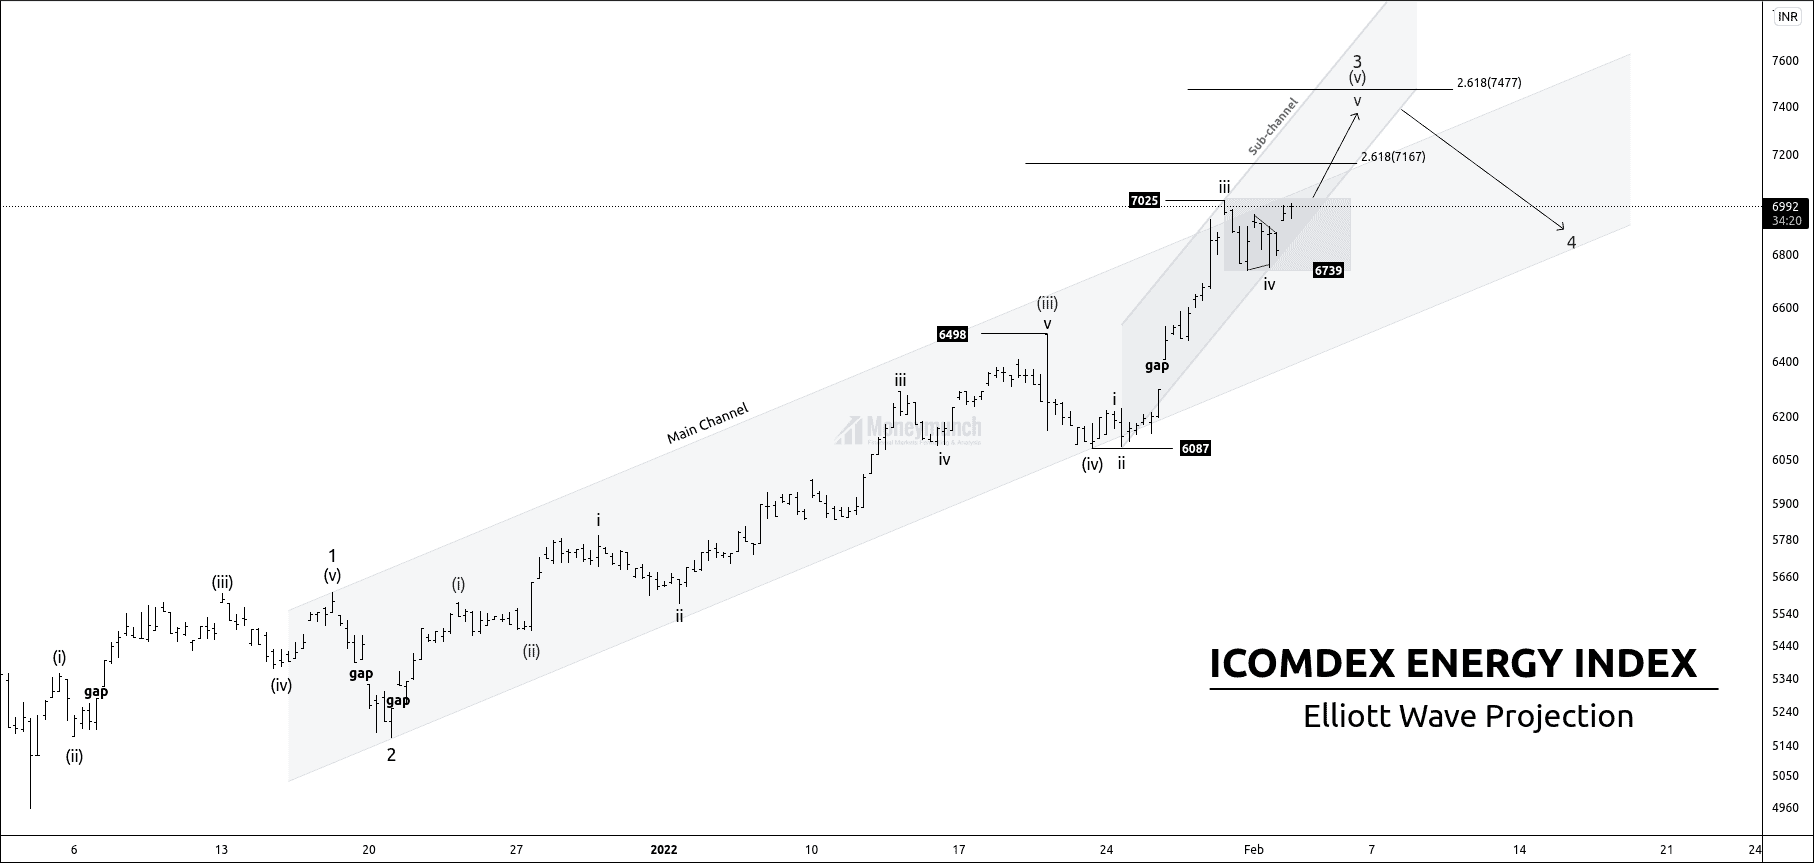
ICOMODEX Energy is forming an impulsive wave 3.

Price has finished the corrective wave (iv) of wave 3, and the price is establishing an impulsive wave (v) of wave 3.

Price is about to make the last leg v. If the price breaks the high of wave iii, it can make an upward move of 7135 – 7290- 7355 -7477.

After the accomplishing of wave 3, the price will fall and break the acceleration channel.

What are the turning points for the prices?

+ Wave 3 can finish at 2.618 (7477) reverse Fibonacci retracements of wave iv.
+ Wave 3 can finish at 2.618 (7167) reverse Fibonacci of wave (iv)
+ 3rd wave can end after the breakdown of sub-channel.

I will upload further information for intraday traders. To become a subscriber, subscribe to our free newsletter services. Our service is free for all.

Continue reading

EWT: Will Crude Oil Reach 7000?

Free mcx crude oil chart tips

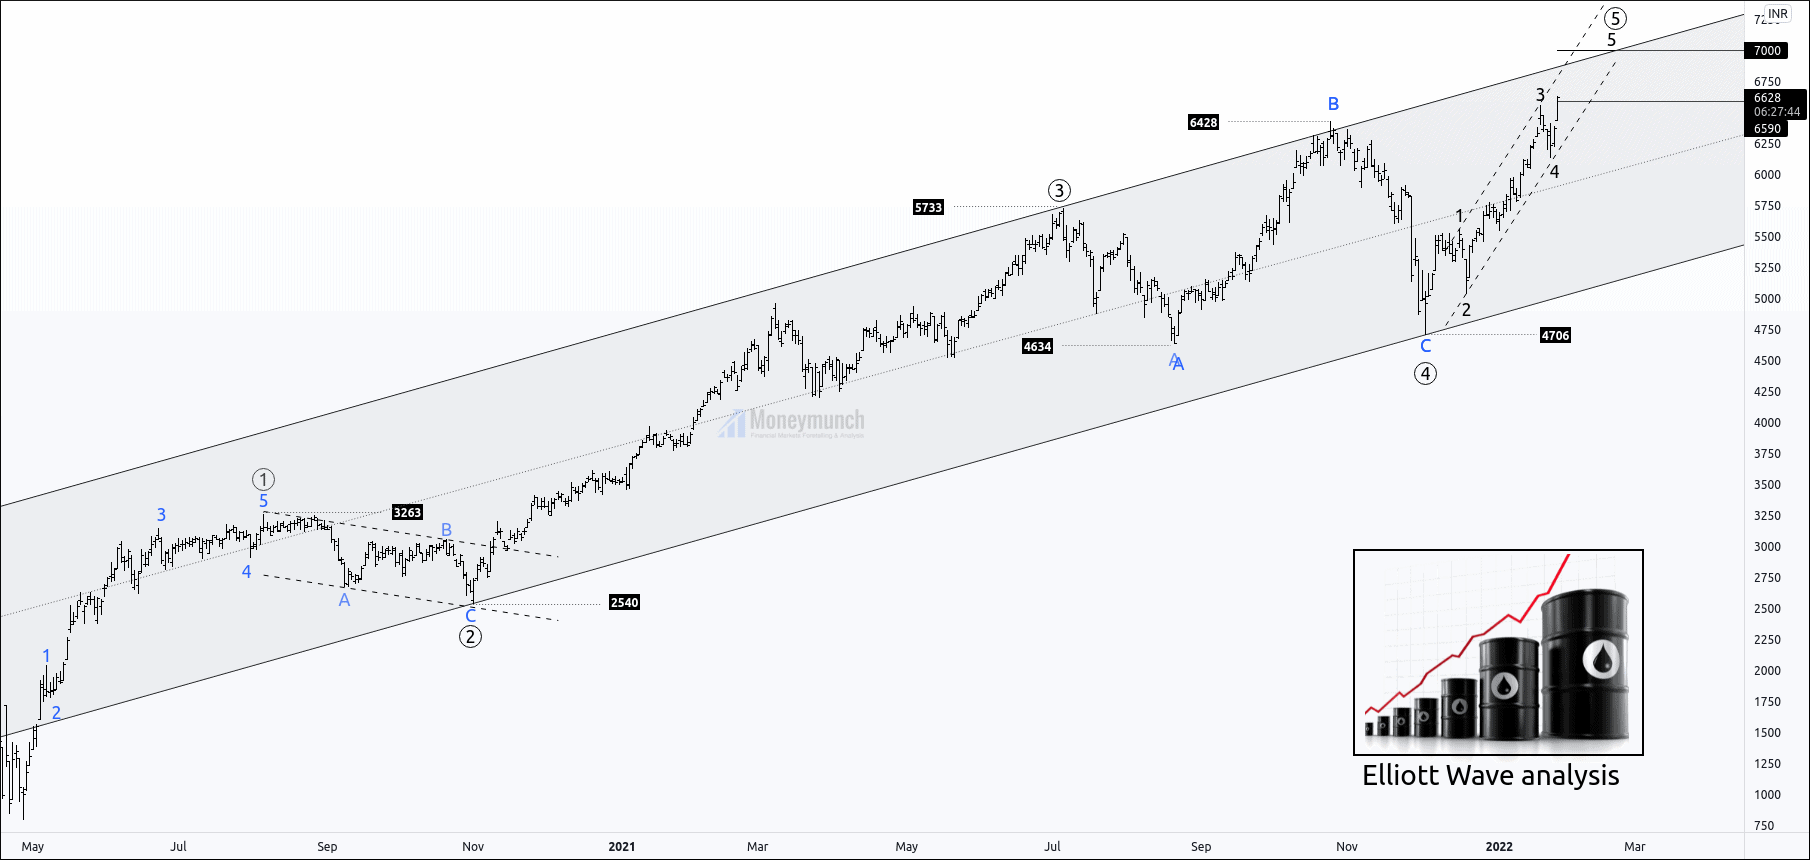
Crude oil is forming impulsive waves ((5)).

After the completion of wave ((3)), the price had started complex running flat of the corrective wave ((4)).
Wave B has crossed the high of wave ((3)), but wave B couldn’t break the low of wave A.

Price has made a failure of swing low, which was a rejection of a downtrend, and crude oil gained momentum.
Price has exceeded the sub-wave B of wave ((4)).

Sub-wave 4 of wave ((5)) is in progress.

If their price breaks out the high of wave 3, we can expect the following target for final sub-wave 6697-6785-6865+. It means the price has bullish sentiments above wave three and vice versa.
Breakout of the parallel channel shows the weakness of the impulsive wave. Note that wave four can never overlap the starting point of wave 1.

To become a subscriber, subscribe to our free newsletter services. Our service is free for all.

Get free MCX ideas, chart setups, and analysis for the upcoming session: Commodity Tips

Have you any questions/feedback about this article? Please leave your queries in the comment box for answers.

Disclaimer: The information provided on this website, including but not limited to stock, commodity, and forex trading tips, technical analysis, and research reports, is solely for educational and informational purposes. It should not be considered as financial advice or a recommendation to engage in any trading activity. Trading in stocks, commodities, and forex involves substantial risks, and you should carefully consider your financial situation and consult with a professional advisor before making any trading decisions. Moneymunch.com and its authors do not guarantee the accuracy, completeness, or reliability of the information provided, and shall not be held responsible for any losses or damages incurred as a result of using or relying on such information. Trading in the financial markets is subject to market risks, and past performance is not indicative of future results. By accessing and using this website, you acknowledge and agree to the terms of this disclaimer.