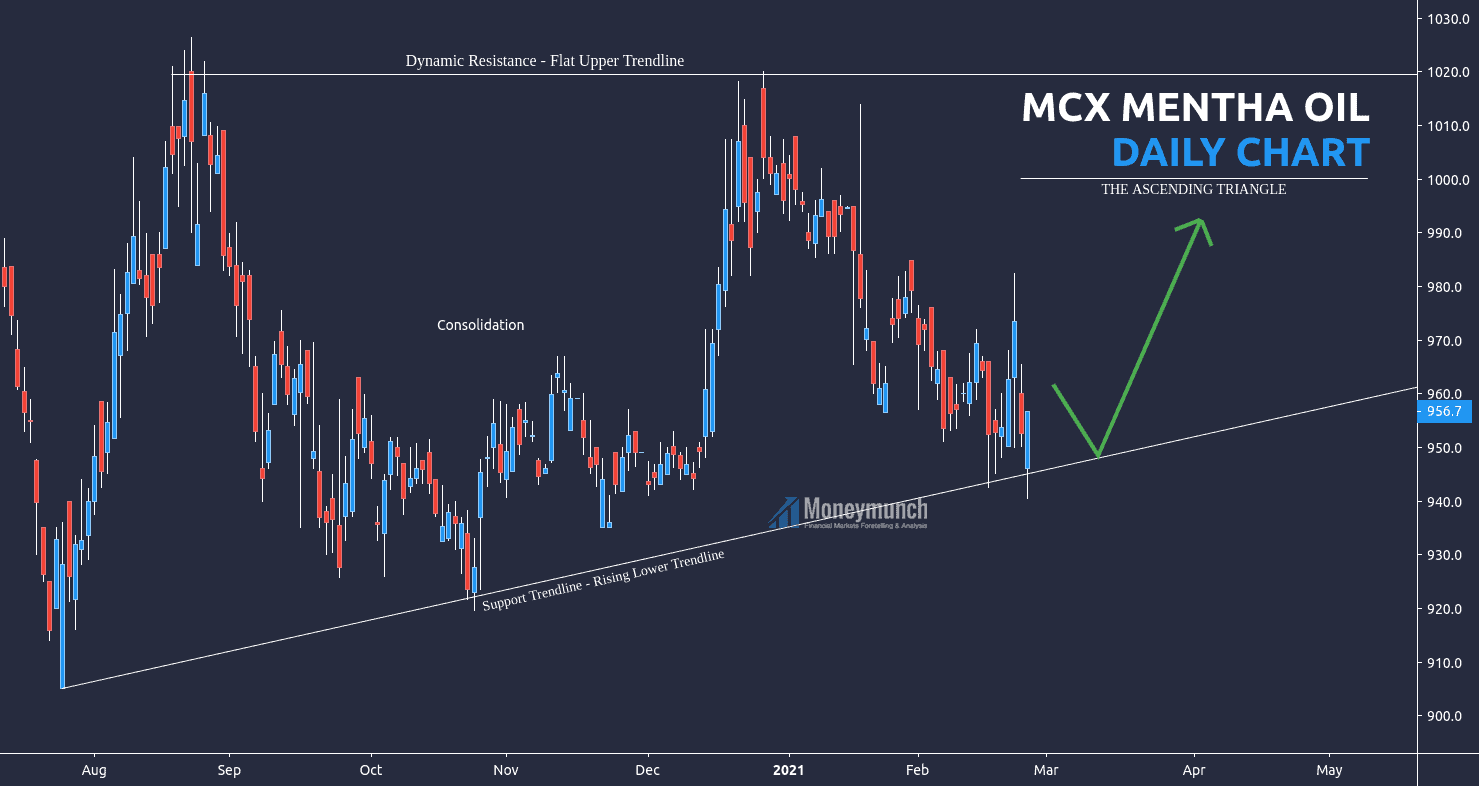
MCX Mentha Oil Overall Outlook Is ‘Strongly Bullish’

Free commodity mentha oil chart tips

First, wait for a clear ascending triangle form. Right now, MCX Mentha oil at the support trendline (rising lower trendline). It will try to hit 964 – 986 – 1000 – 1020 levels from here. Intraday traders can go with the current trend.

But don’t buy below the support trendline. To become a subscriber, subscribe to our free newsletter services. Our service is free for all.
Continue reading

Here’s Why MCX Copper Yesterday Moved Down

free commodity copper daily chart tips

LONG-TERM INVESTORS:
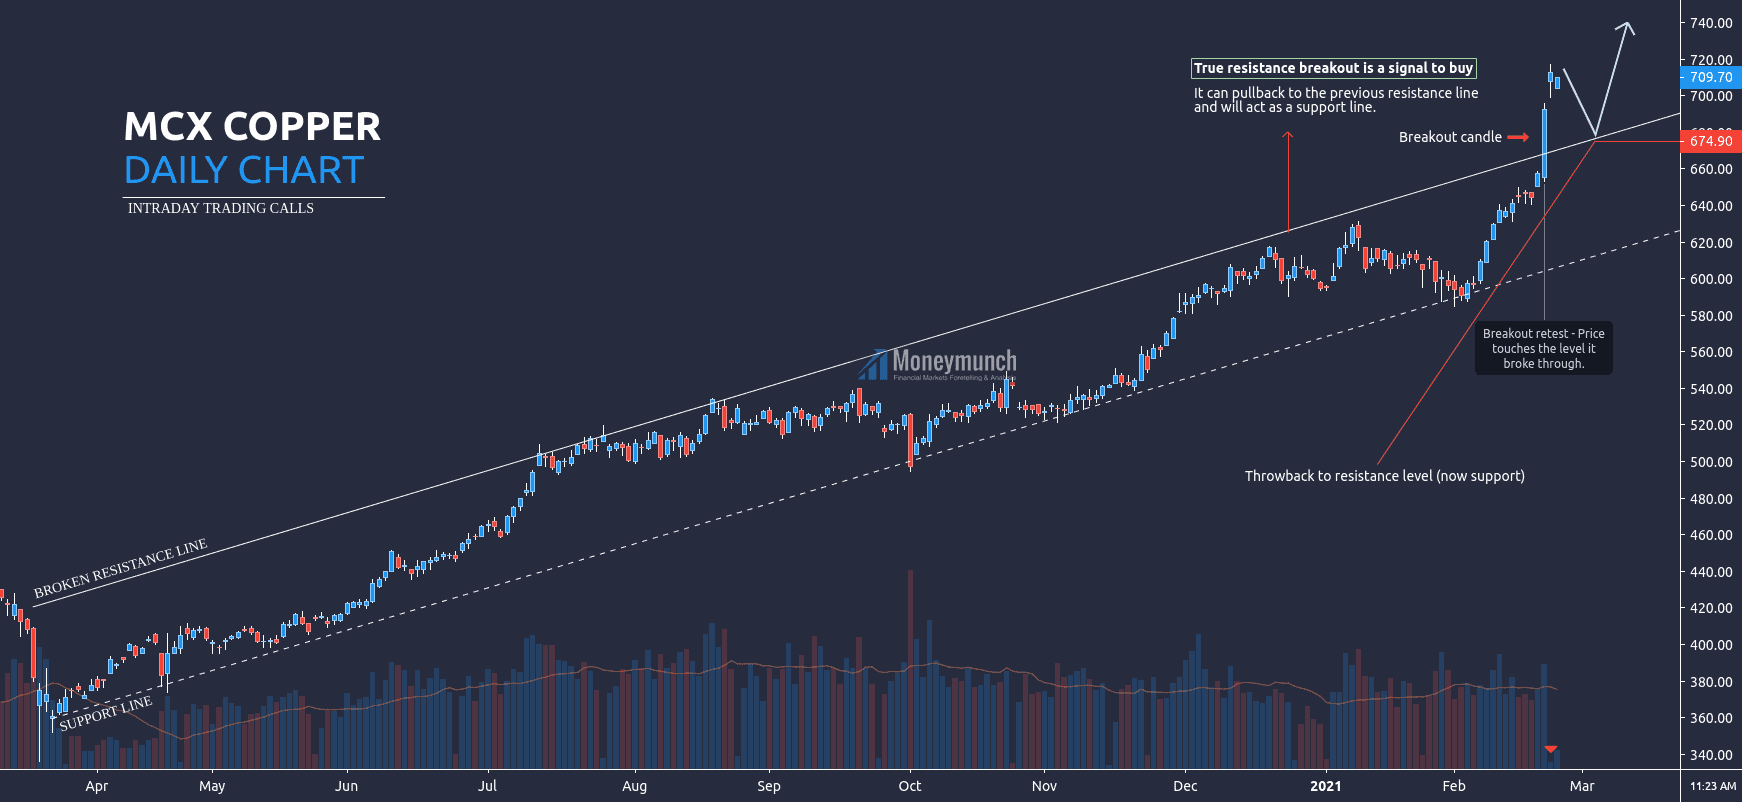
Copper has broken March 2020 resistance trend line, and true resistance breakout is a clear signal to buy. Target prices for long-term traders: 760 – 800+

INTRADAY TRADERS:
But at present, MCX copper can pull back to the previous resistance line to continue an uptrend. So, intraday traders can sell for the following targets: 690 – 680 – 676

To become a subscriber, subscribe to our free newsletter services. Our service is free for all.

Continue reading

PART 2 – When Will MCX Gold explode?

free commodity gold chart tipsAs expected, gold has started collapsing after a breakout of the test level. Will it keep falling?

First, click here and read the previous article on gold: When Will MCX Gold explode?

Today’s Gold Chart →

free commodity gold chart tips

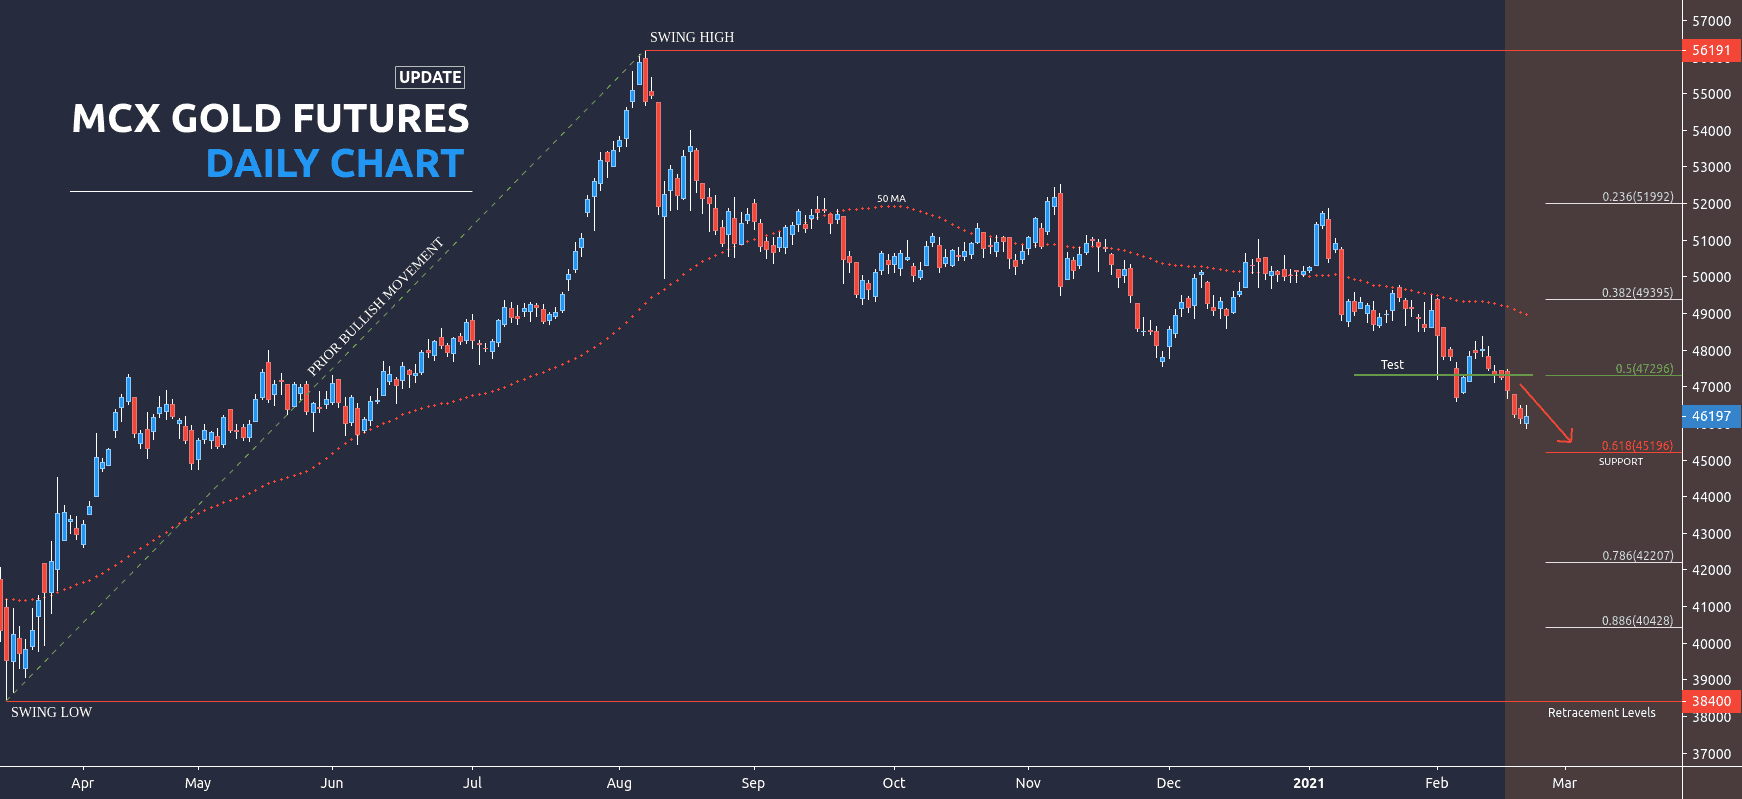
I have written in clear words, “If gold remains below 47296 levels, it will come down to 0.618 value of Fib retracement. Targets: 46860 – 46600 – 46000 – 45660 – 45200“.

Gold has touched the first three targets by making a low of 45861. Profit per lot Rs.2,10,000

Anyway, what next? Gold can take a U-turn from here. This can be up to 46760 levels. Overall, it’s under a downtrend.

To become a subscriber, subscribe to our free newsletter services. Our service is free for all.
Continue reading

When Will MCX Gold explode?

free commodity gold chart tips

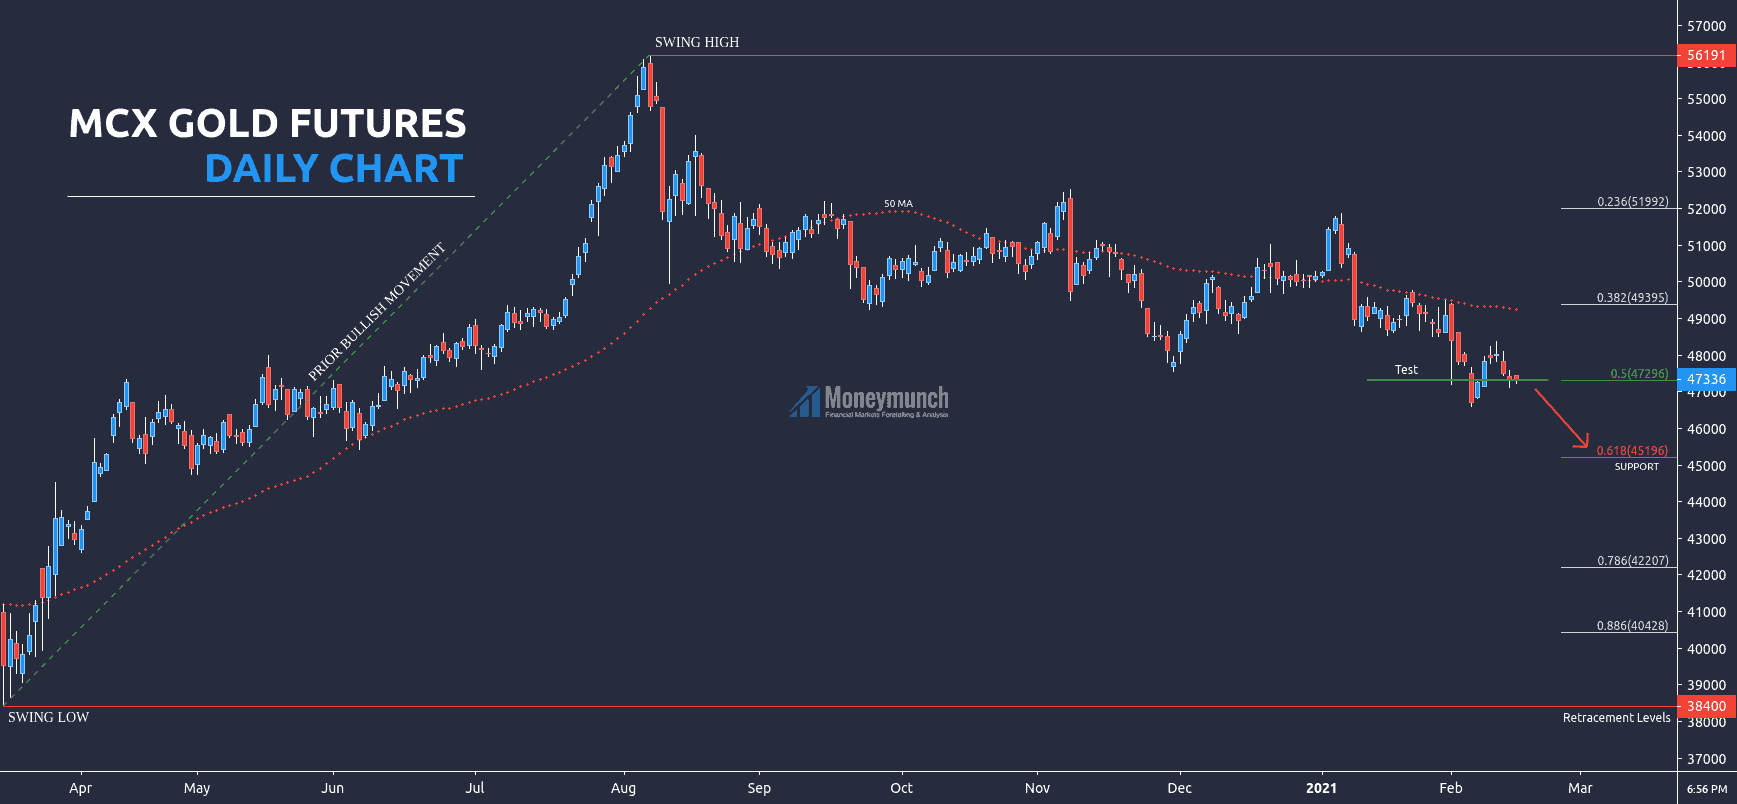
Main scenario: If gold remains below 47296 levels, it will come down to 0.618 value of Fib retracement.

Targets: 46860 – 46600 – 46000 – 45660 – 45200

Alternative scenario: If gold remains above 0.5, it may try to hit 0.382 (TP: 48260 – 49000+).

So, here hurdle is 47296 for the short-term traders. Intraday traders can play both sides.

And we may see a strong uptrend after hitting the support.

To become a subscriber, subscribe to our free newsletter services. Our service is free for all.
Continue reading

MCX CPO – Fifth Wave Rally Is Starting

free commodity cpo chart tips

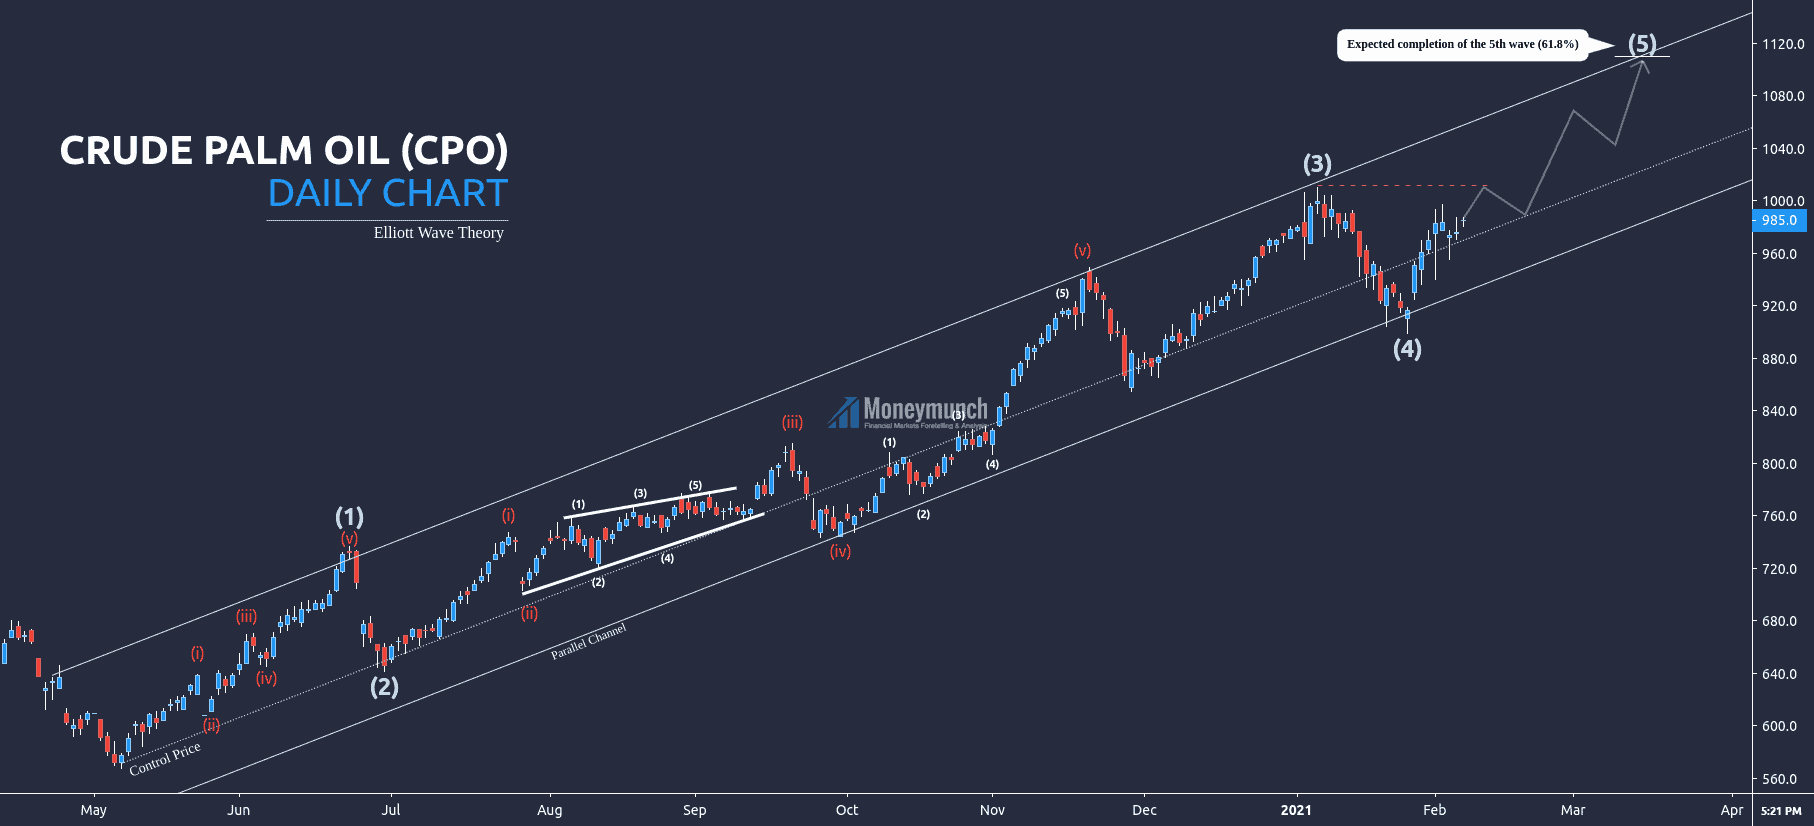
Main scenario: consider long positions from the control price or support trendline for the target level of 1000 – 1040 – 1080 – 1100 – 1110.

Analysis: Daily time frame – presumably, the crude palm oil has started an Elliott wave and made the 4th wave, and now it’s making a fifth wave. According to EWT, the fifth wave will be completed at 61.8% or 50% of Fib retracement 1+3.

Alternative scenario: breakout and consolidation below the support trendline will allow the CPO to continue declining to the levels of 880 – 760.

To become a subscriber, subscribe to our free newsletter services. Our service is free for all.
Continue reading

MCX Nickel – Parabolic Curve Pattern & Tips

free commodity nickel weekly chart tips

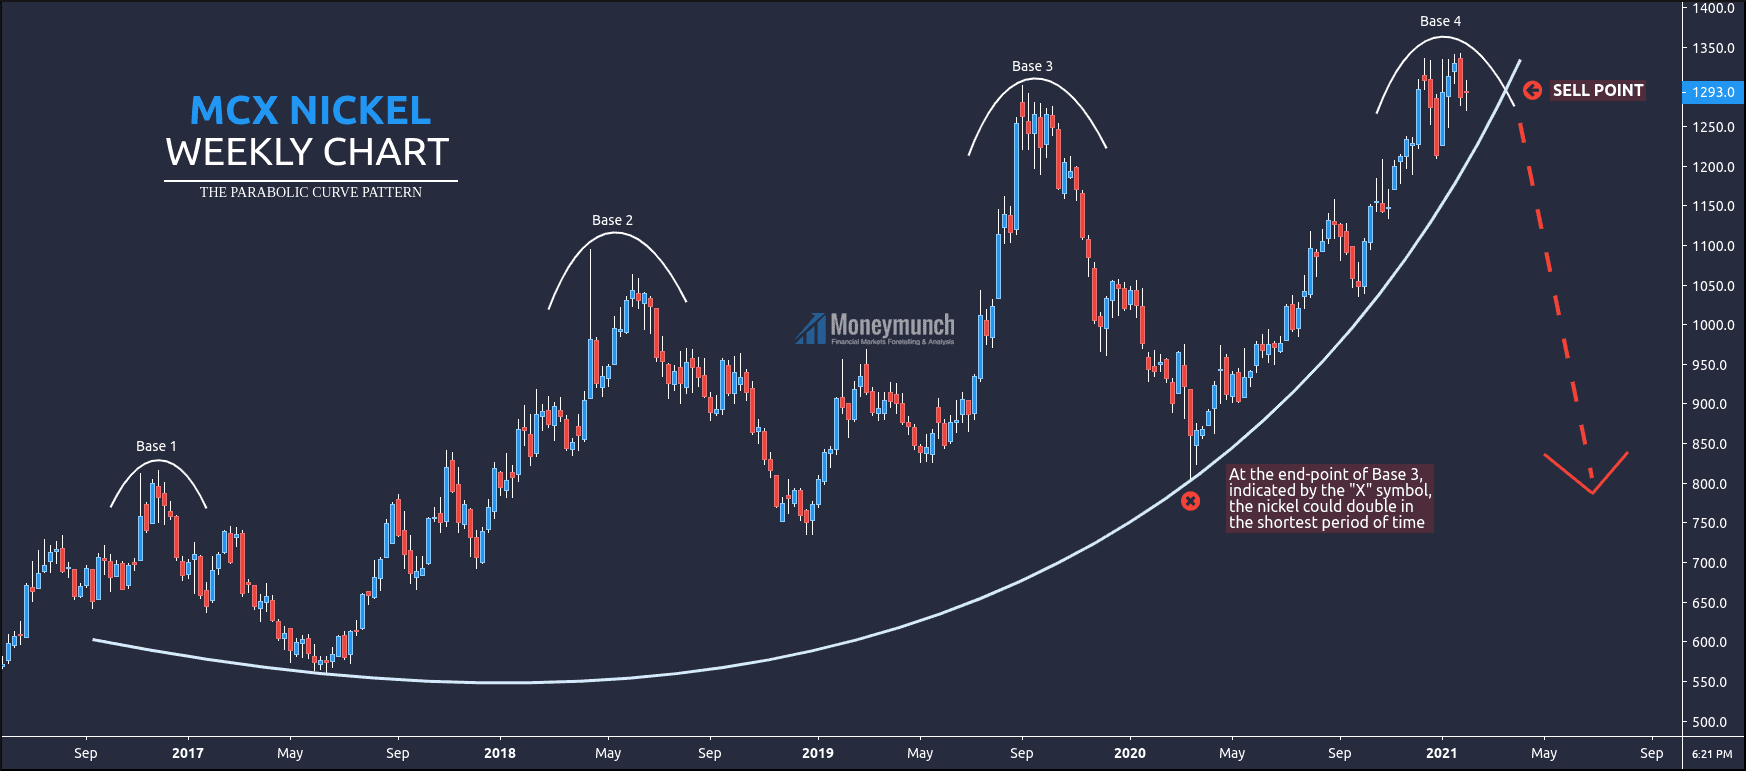
This is MCX Nickel weekly chart. Price projection is based on Parabolic Curve & Fib Retracement.

As mentioned in the chart, At the end-point of Base 3, indicated by the “X” symbol, the nickel could double in the shortest period of time. Targets: 1426 – 1632 – 1778 – 1854 – 1962 (2.618Based on Fib Retracement).

If nickel breaks the curve line, it can collapse up to “X” or base 3 deep. Hence, we can see the following targets from the selling point: 1130 – 1050 – 960 – 850 and below.

Remember, trade with the direction of the breakout. And stop-loss above/below breakout level.

To become a subscriber, subscribe to our free newsletter services. Our service is free for all.
Continue reading