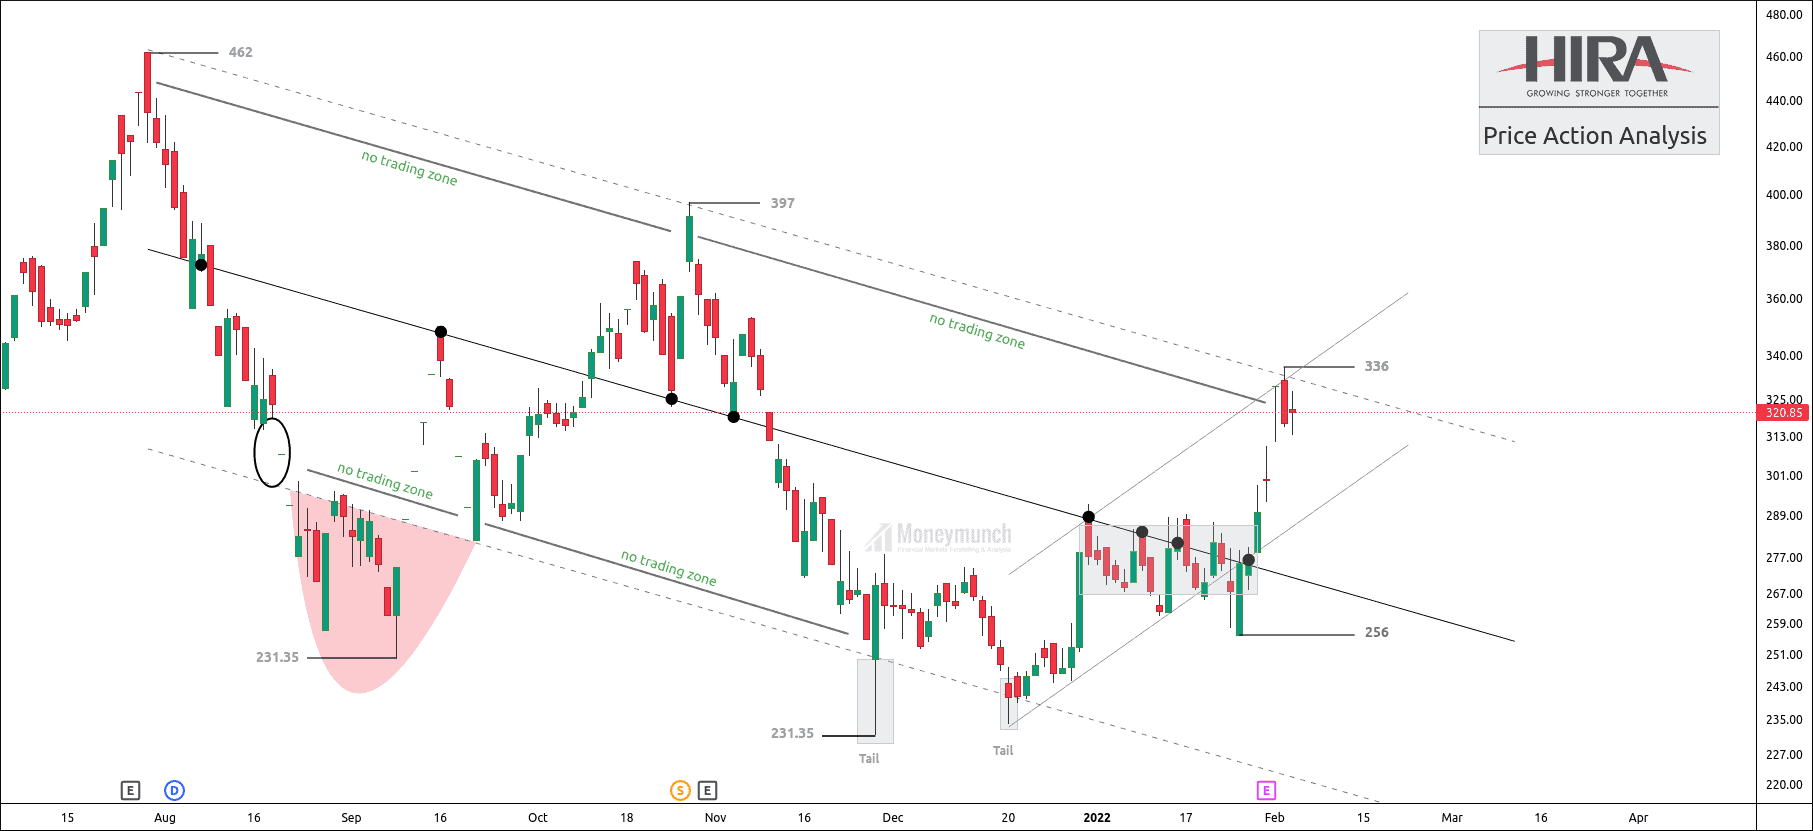
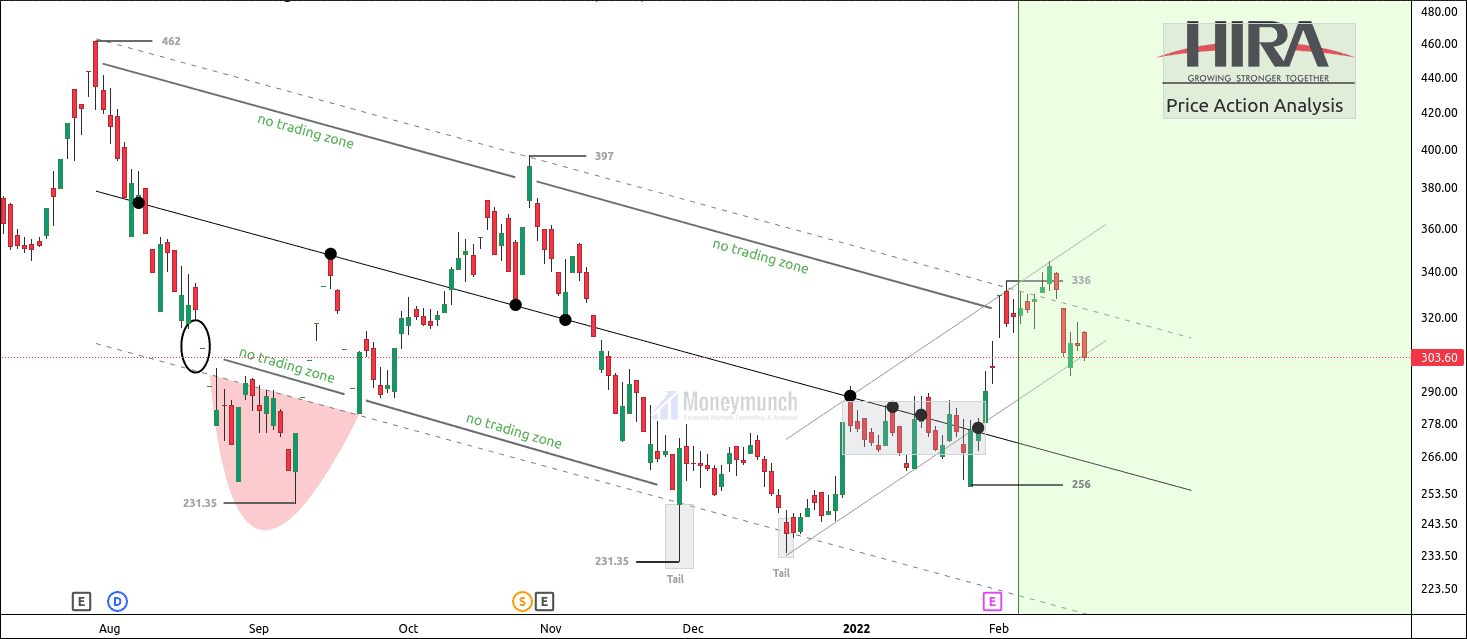
AJMERA
Before:
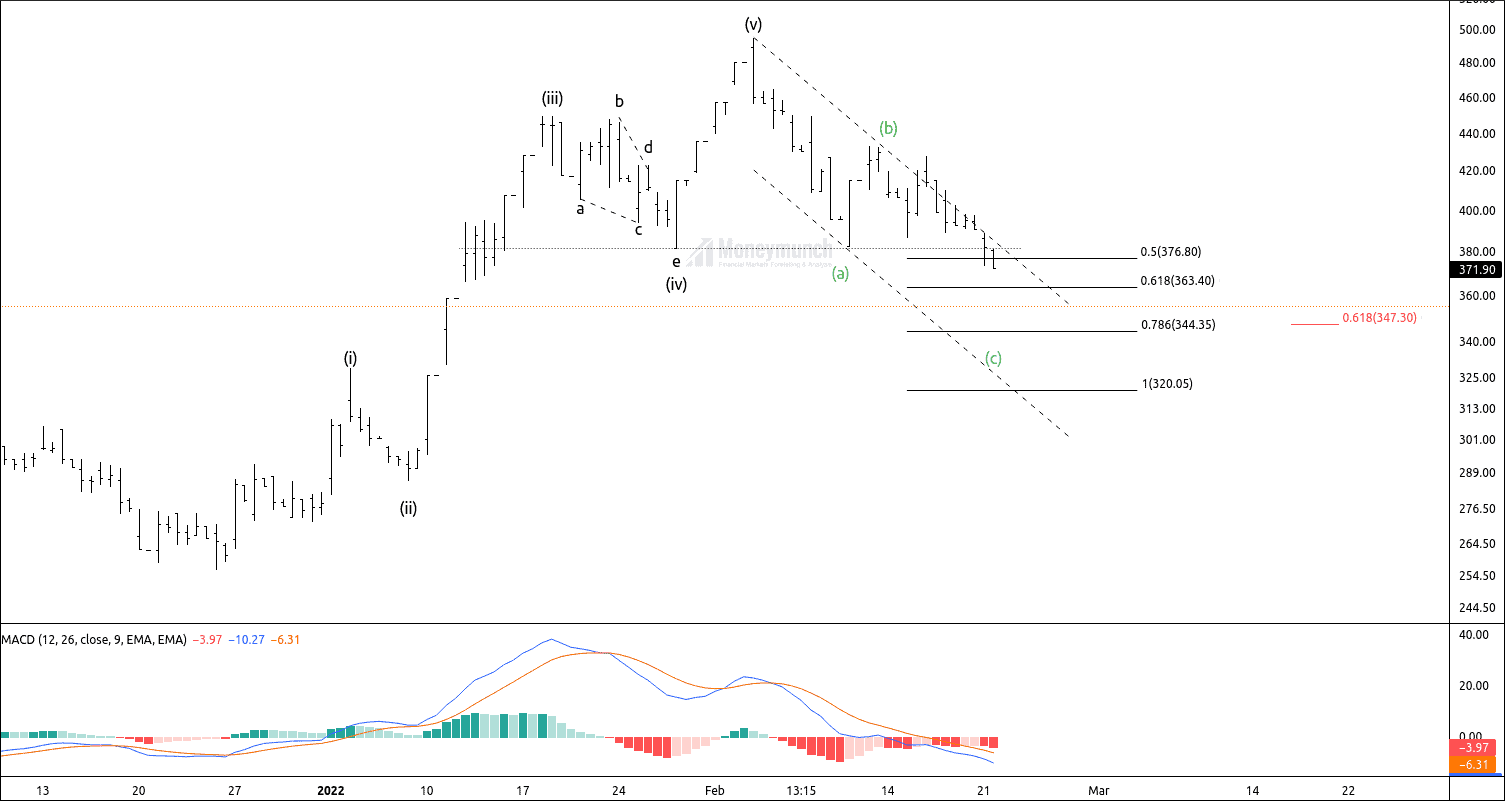
AJMER has completed the corrective wave B, where the price was preparing for final leg C.
I have written in clear words,” Traders can trade for the following targets: 360 – 356 – 342+.”
Click Here to read the previous research report.
After:
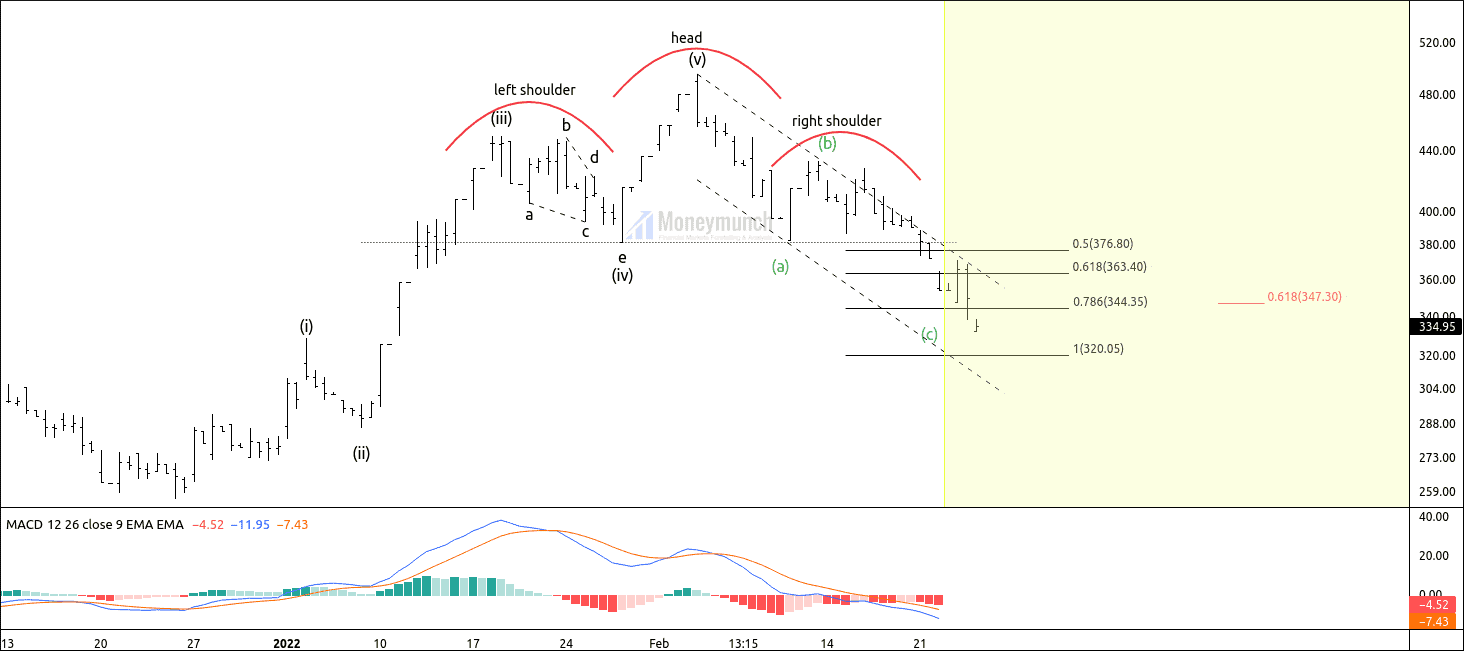
23 Feb 2022 – AJMERA reached the first target of 360 and the second target of 356.
24 Feb 2022 – AJMERA touched the final target of 344.
Further, the price may retrace to the lower band of the parallel channel.
 Unlock This Article
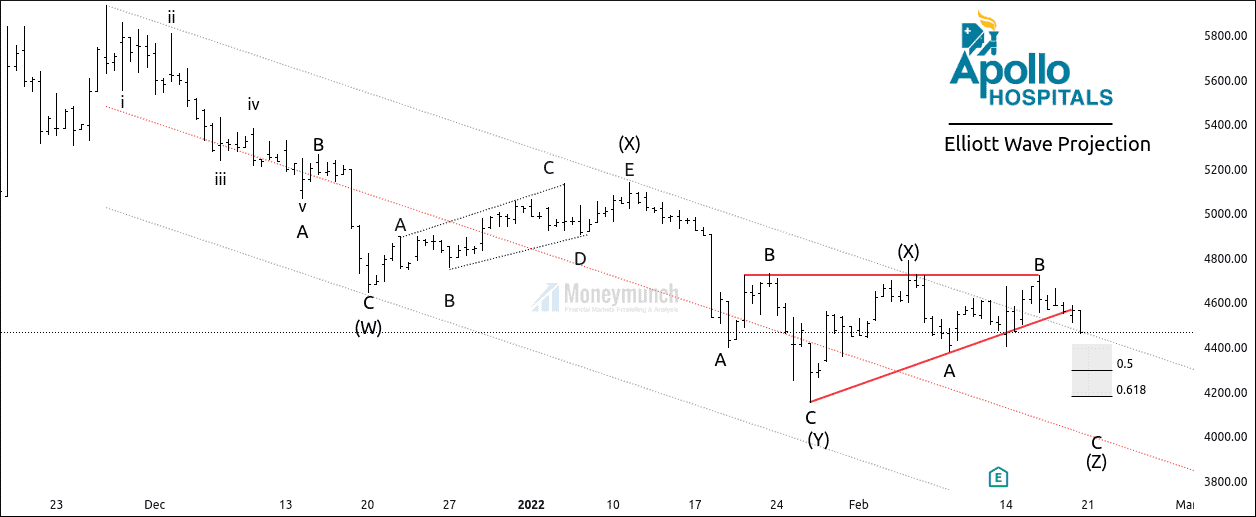
Apollo Hospital
Did you read my previous research report on Apollo hospital?
Click here to read the previous research report.
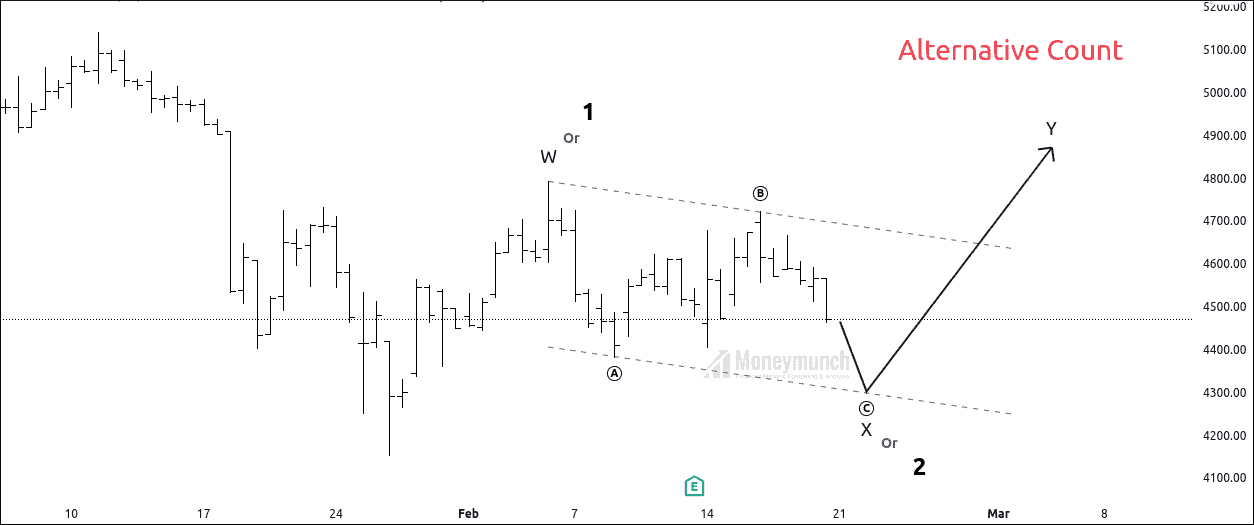
Apollo hospital was unfolding triple zigzag correction wherein the price has formed wave C of wave (Z).
I have mentioned in clear words, “If the price sustains under the upper band of the channel, Traders can trade for the following targets: 4401-4345- 4208 and more.”
21 Feb 2022 – Apollo hospital reached the first target of 4401.
22 Feb 2022 – Apollo hospital reached the second target of 4345 and made a low of 4300.
Furthermore, Price is preparing for the final target.
3MINDIA
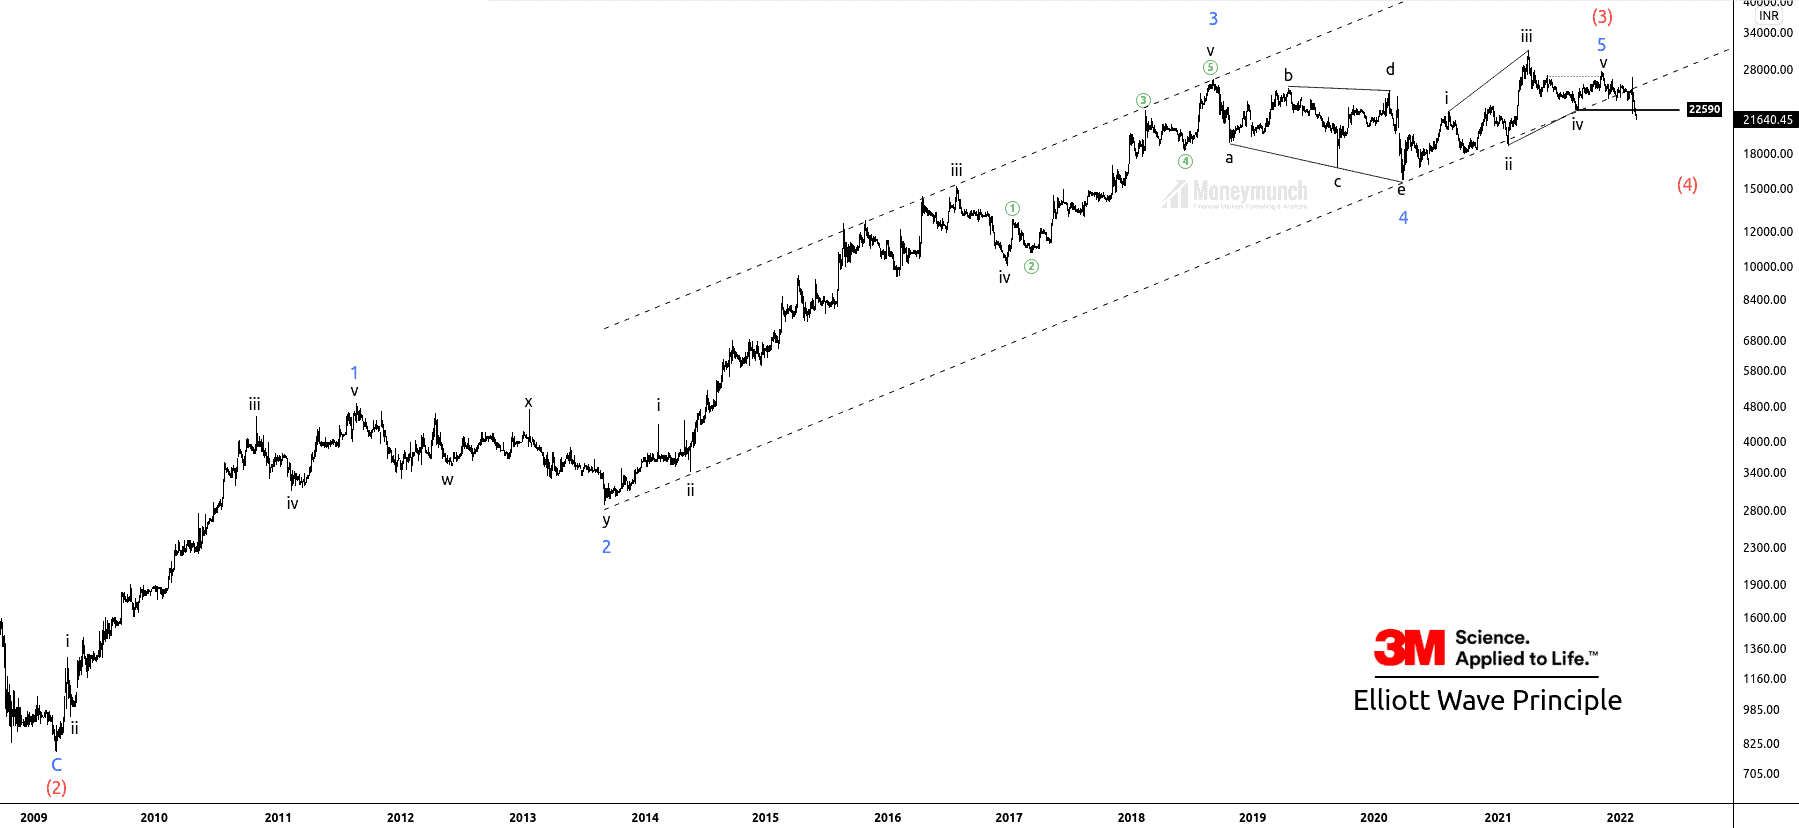
3MINDIA have formed the impulsive wave 5 of wave (3).
The price has established the corrective wave (4), and it has broken down the wave iv of lower degrees. It was a clear indication of a bearish atmosphere.
I have mentioned in bold words, “Traders can initiate a short position for the following targets of 21010-20557.“
Click Here to read the previous research report.
24 Feb 2022 – Price reached the first target of, 21010, and made a low of 20660.
To become a subscriber, subscribe to our free newsletter services. Our service is free for all.