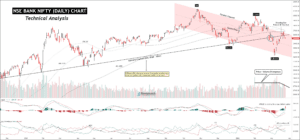
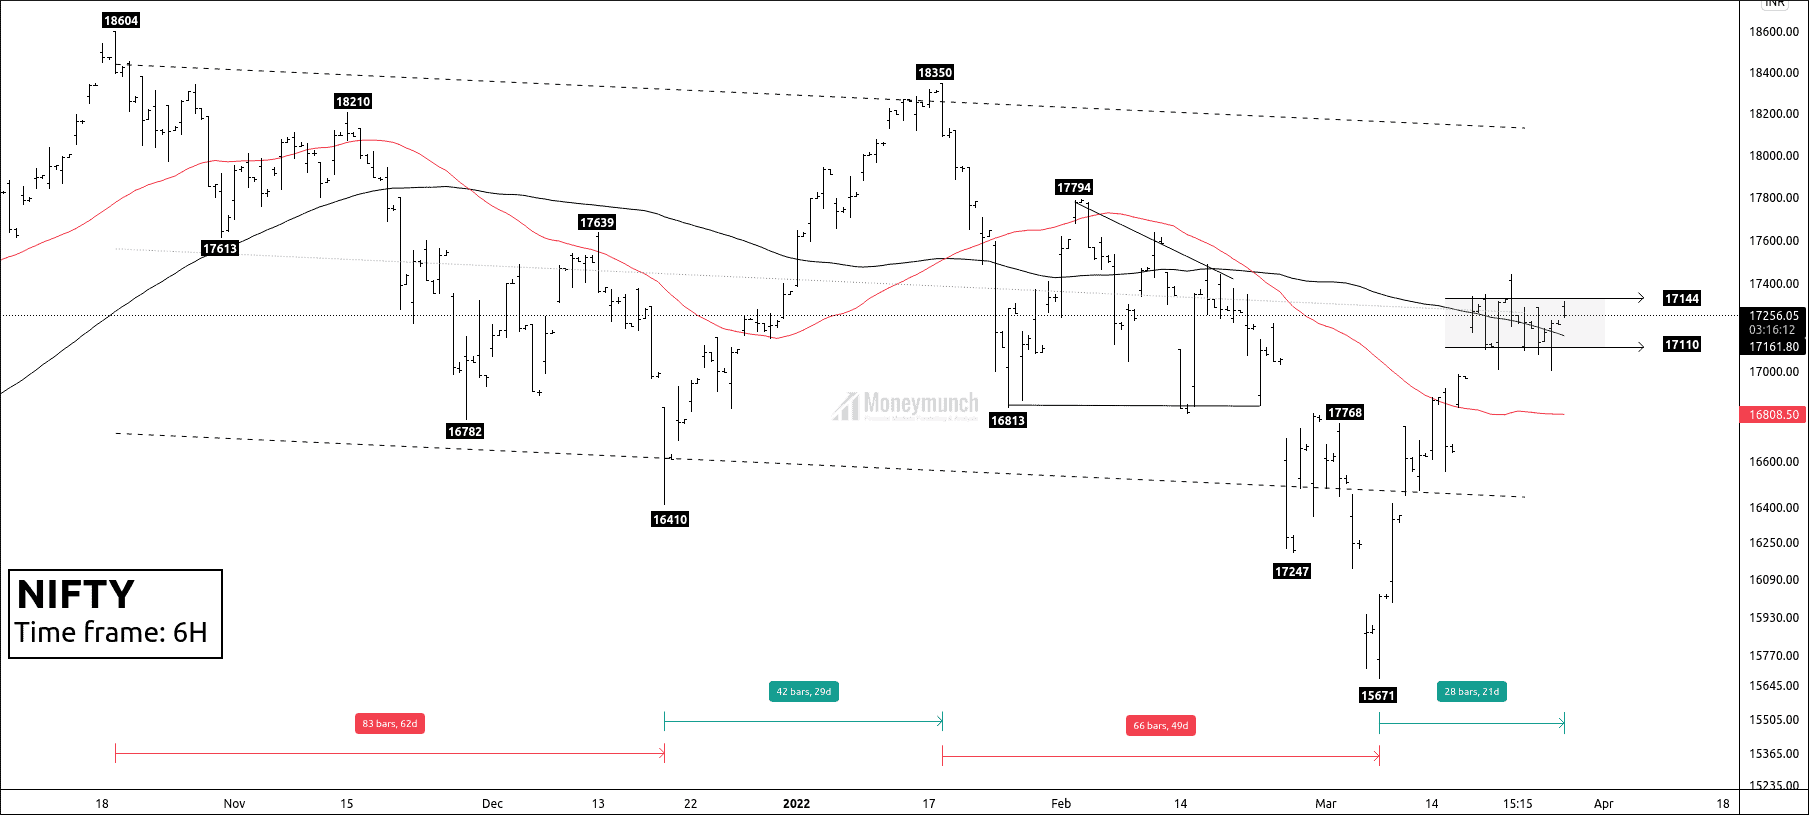
Knowing how to find the volume, you will be in PROFIT here

If you know how to find volume and how to evaluate it, almost nothing be hidden from you- not even FII/DII, neither bullish or bearish market, not the likely direction of future price.

ICICI-PRUDENTIAL-LIFE-INSURANC
  • Price is MA 200 above
  • Volume with rising
  • Resistance is not far from the current price

Everything seems to be evaluating and its seen here that is clearly a break-up. There is no worry after cross above 358.

For considering another scenario, Price interval is possible.

Safe buyers can put alert to buy 338-345 and, short term investors can enter 348 nearby for the target as mentioned in the chart.

To become a subscriber, subscribe to our free newsletter services. Our service is free for all.

Continue reading

Downward Visible Targets For NIFTY

This is research on CASH Nifty

nifty-spot

Resistance line of the previous trend can stop for a short time.

  • First, is at 11294 and second, is at 11240.

This both levels are the targets for who has sold Nifty .

Profit booking can possible for short seller.

To become a subscriber, subscribe to our free newsletter services. Our service is free for all.

Continue reading

BYKE, looking to push through resistance right here. (For investors & Traders)

We have update 3 charts here,

  1. Weekly Chart
  2. Daily Chart
  3. Hourly Chart
BIKE-weekly-chart
BYKE

BYKE(NSE), looking to push through resistance right here. Find out why we could see new highs this afternoon if close or moved above 35.

Looking at the trough it seems that there is no blockage of any kind to move the price up.
Buyers are increasing from 33, if price move 35 above is no worry for Investors or Swimming traders too.

Past Resistance has been broken today.
on the daily chart , 200MA is at 89.2 and 50MA is at 40.

first targets is Rs . 39.6 and suppose to cross this price in gap up then, wait for targets Rs 79-82

To become a subscriber, subscribe to our free newsletter services. Our service is free for all.

Continue reading

11500 or 11000 below? last Resistance is for NIFTY

spot-nifty

Today, Nifty made strong bullish candle but, it’s having final and strong trend line resistance.

  • Trendline Resistance 12000-50
  • H & S pattern,

Generally, Head & Shoulder pattern has 2% penetration normally.
LEFT Shoulder is at 11176 and,
HEAD at 11760
Calculated 223 points is 2% Penetration of LEFT SHOULDER. 11176 + 223 = 11400

For the H & S pattern, 11400 may be a maximum value of RIGHT should with penetration of 2%.

I will update here tomorrow exact trade…

updated after opened market.

here profit booking can start on NF, between 11287-11308

Active PUT 11200 march, buyers expected 18-22.

To become a subscriber, subscribe to our free newsletter services. Our service is free for all.

Continue reading

Major 3 points can give you exact move of NF

nifty-future
  • 61.8% key Fibonacci ratio at 11091
  • R 11142
  • R 11185

These three major points are very important to understand, which have played the role of resistance in the past.

94 points(11185-11091 = 94) of area are crucial for up move.

Keeping in mind both side move;

  1. To make up-break out, Nifty should jump OR GAP with heavy volume.
  2. The resistances are working properly if the price reducing faster than normal way.

To become a subscriber, subscribe to our free newsletter services. Our service is free for all.

Continue reading

We Have Picked Few Of Stocks For Selling When Trend Changed

In the short term, the trend of nifty future appears to be change on the basis of technical.

According to change short term trend up to downside, we have picked few of stocks from Nifty 50.

  • GRASIM
  • COALINDIA
  • BAJAJFINSV
  • GAIL

As the trend is likely to change on the day of 6th mar 2019 or on the next day, the above 4 stocks are the best top-selling mentioned above.

Presently we are going to update here GRASIM future chart.

GRASIM fut trading at 811 and high was 813. If we write technically, then now the GRASIM is drawing perfect level for selling…!

But, We should not act today because, We are expecting that Nifty index trend will change on or after 6th mar 2016 basis of Time Cycle expected. We should to try to sell at higher and higher price 814/829.

To become a subscriber, subscribe to our free newsletter services. Our service is free for all.

Continue reading