Free Stock market / Nifty intraday tips, FREE Stock, Commodity & Forex tips

NSE 3MINDIA Bearish Mode Activated

Free nse stock 3mindia daily chart calls

Basic Tenets:
Elliott waves are famous for finding crowd behavior trends and reverses in recognizable patterns. Elliott’s wave principle is inspired and made from the Dow theory, which is the foundation of the technical analysis.

Elliott’s wave principle consists of eight waves.
In this eight wave, price forms two types of wave structure,

1. Motive structure:
– Five Wave Pattern.
– Moves with the primary/main trend.
– Labeled in Numerical method (1,2,3,4,5).

2. Corrective structure
– Three Wave Pattern.
– Moves against the primary/main trend.
– Denoted in alphabetical method (A, B, C).

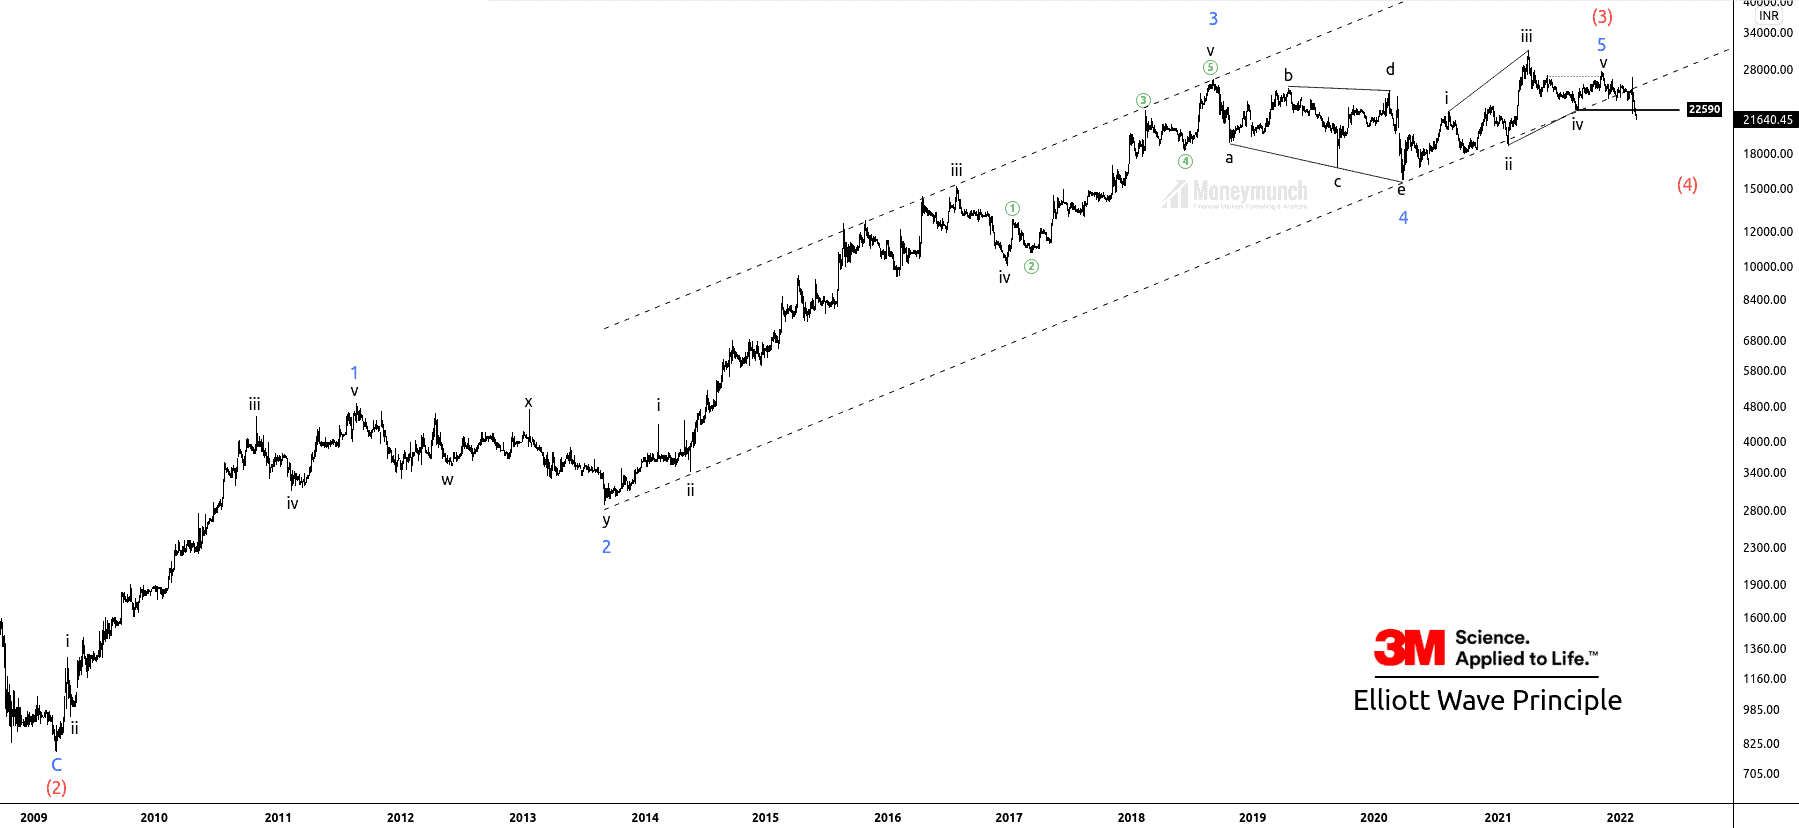
Now, let’s look at the 2-day chart of 3MINDIA.

Timeframe: 2 day
Price has accomplished the impulsive wave (3) and started forming corrective wave (4) by breaking sub-wave iv of wave 5 of wave (3).
Currently, the price is in corrective mode.

Sub-wave 5 of wave (3) has ceased, the terminating wave v of ending diagonal. Price has broken down the corrective wave iv at, 22590, which signals bearish sentiments. After breaking the main channel, the price started falling sharply.

Calculation of wave (4):
The common retracement of wave 4 is 38.2% of wave 3.
Wave 4 can never retrace more than 61.8% of wave 3.
Wave 4 occurred near sub-wave 4 of lower degree.

Timeframe chart: 4-hour

Price has broken down the sub-wave iv of the ending diagonal of wave 5.
After the pullback, if the price sustains below, 22590, it is likely to give a big move below the parallel channel.

Traders can initiate a short position for the following targets of 21010-20557.

To become a subscriber, subscribe to our free newsletter services. Our service is free for all.


Get free important share market ideas on stocks & nifty tips chart setups, analysis for the upcoming session, and more by joining the below link: Stock Tips

Have you any questions/feedback about this article? Please leave your queries in the comment box for answers.

Disclaimer: The information provided on this website, including but not limited to stock, commodity, and forex trading tips, technical analysis, and research reports, is solely for educational and informational purposes. It should not be considered as financial advice or a recommendation to engage in any trading activity. Trading in stocks, commodities, and forex involves substantial risks, and you should carefully consider your financial situation and consult with a professional advisor before making any trading decisions. Moneymunch.com and its authors do not guarantee the accuracy, completeness, or reliability of the information provided, and shall not be held responsible for any losses or damages incurred as a result of using or relying on such information. Trading in the financial markets is subject to market risks, and past performance is not indicative of future results. By accessing and using this website, you acknowledge and agree to the terms of this disclaimer.

Previous ArticleNext Article
Mr.Guru(s) is a team of stock market certified technical and research analysts with over 20 years of experience. They are regular guests on popular online channels and contribute articles to several financial publications. Their insights and advice are respected by investors worldwide. With their collective knowledge and expertise, they have a proven track record of successfully predicting market movements and identifying profitable opportunities.

Join Today (Free): Stock & Nifty Tips

Write a Comment

Comment Policy: We love comments and appreciate the time that readers spend to share ideas and give feedback. However, all comments are manually moderated and those deemed to be spam or solely promotional will be deleted. Your email address will not be published. Required fields are marked *