NSE Balramchin – Traders are Anticipating Bullish scenario
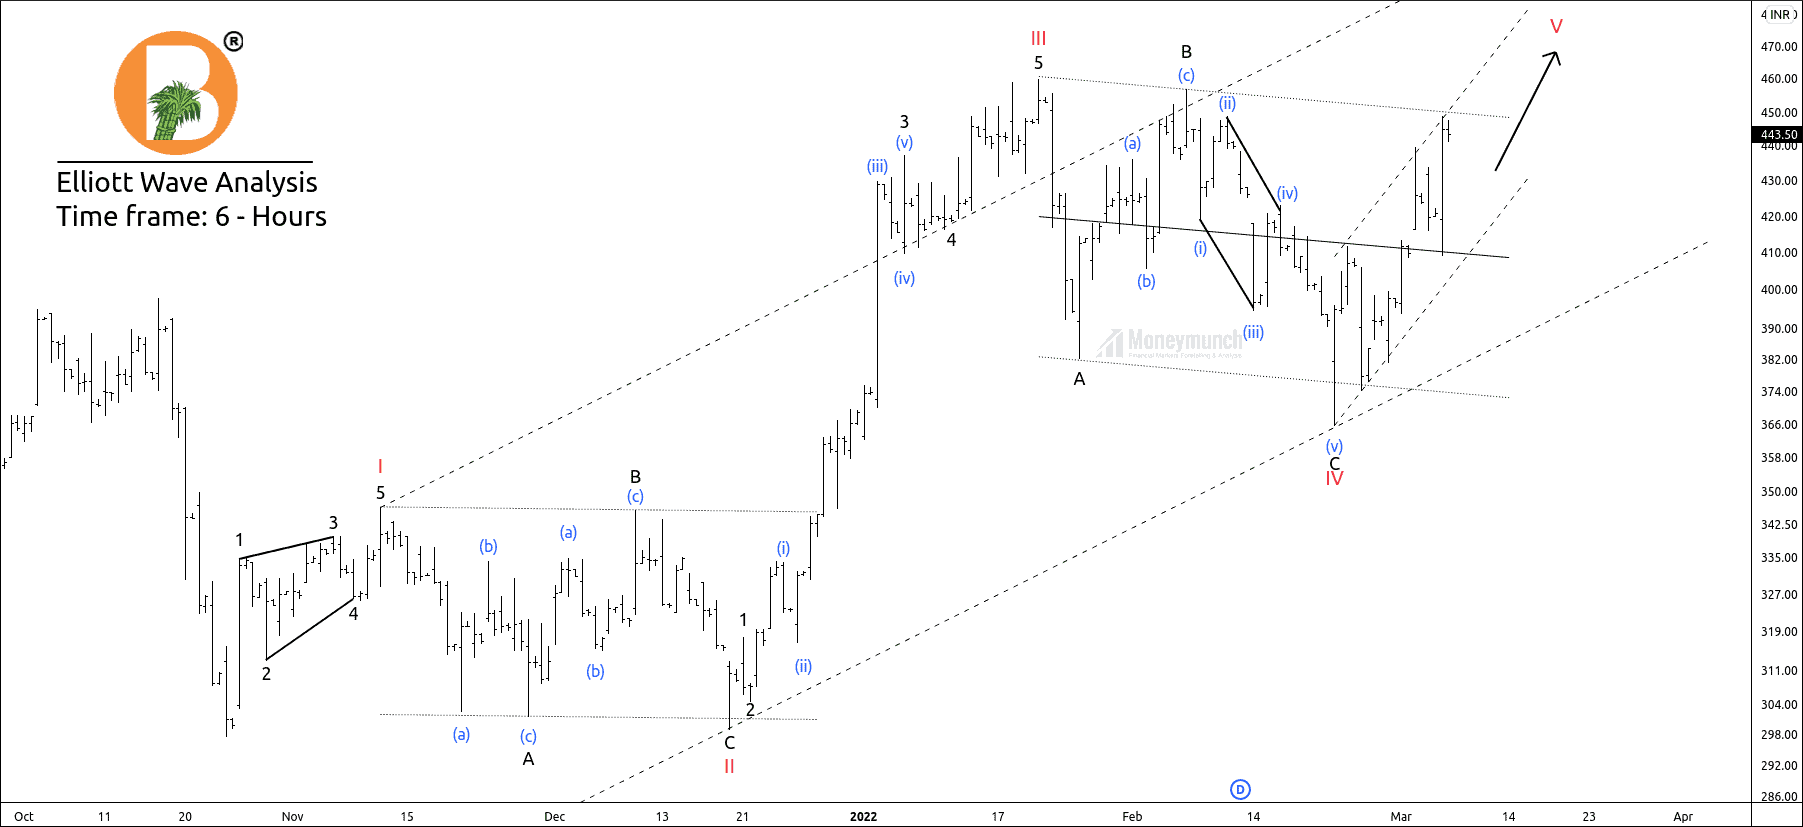
BALRAMCHIN has accomplished the corrective wave IV, and the price has started forming impulsive structure V. If the price breaks high of wave B, we can expect the following targets: 460 – 476 – 489+ for wave V.
If the price fails to break the high of wave B, we will wait for the pullback to enter. However, the breakout of wave B can be an intention that causes a new high, where demand pressure will exceed supply pressure. After accomplishing the final wave V, the price will start A-B-C correction.
We will update further information soon,
NSE Britannia Sellers Are Active In Widespread Against Buyers
Britannia has broken down the crucial support level of 3320. It is the metaphor of a bearish move.
Traders can sell for the following targets: 3117 – 3073. Keep in mind that 3244 is a hurdle level where selling is a likelihood to start.
The invalidation point for subscribers is the high of the previous sessions.
To become a subscriber, subscribe to our free newsletter services. Our service is free for all.
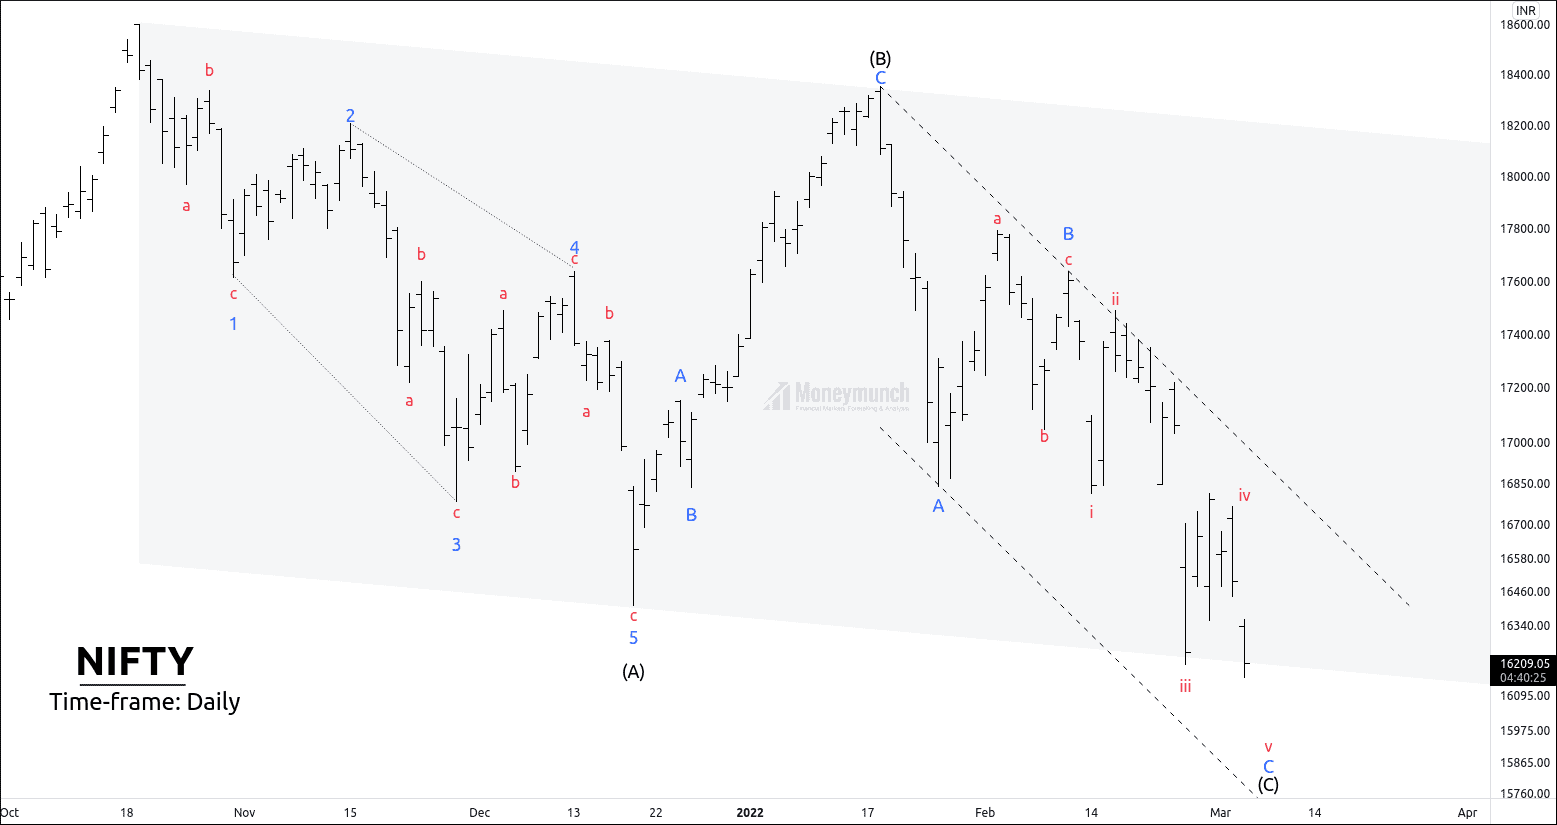
NSE NIFTY Is Has Started Forming Wave C
How many of you traded on NIFTY call?
Click Here to read the previous article.
I had written in bold words, “Price has completed the sub-wave (iv) of wave C. Currently, we are riding on the impulsive wave V of wave C. If the price breaks the low of wave iii, traders can expect the following target of 16110 – 15978 – 15856.”.
It has touched all targets, and made a low of 15711. If you have traded even a single lot of nifty, you must have got 13000+ profit in just 3 days.
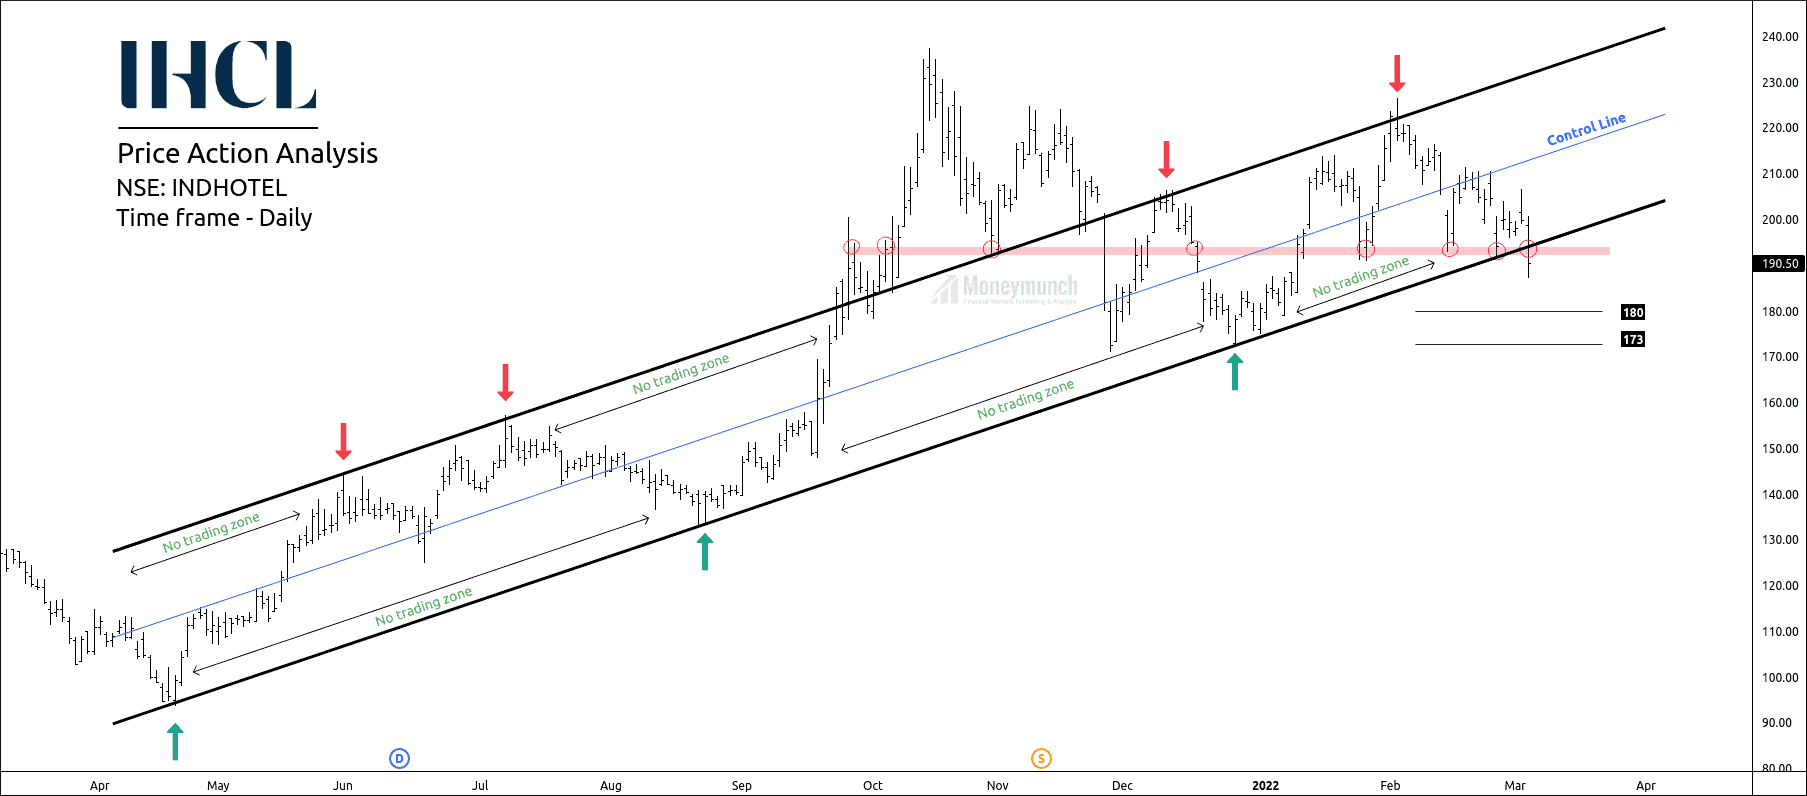
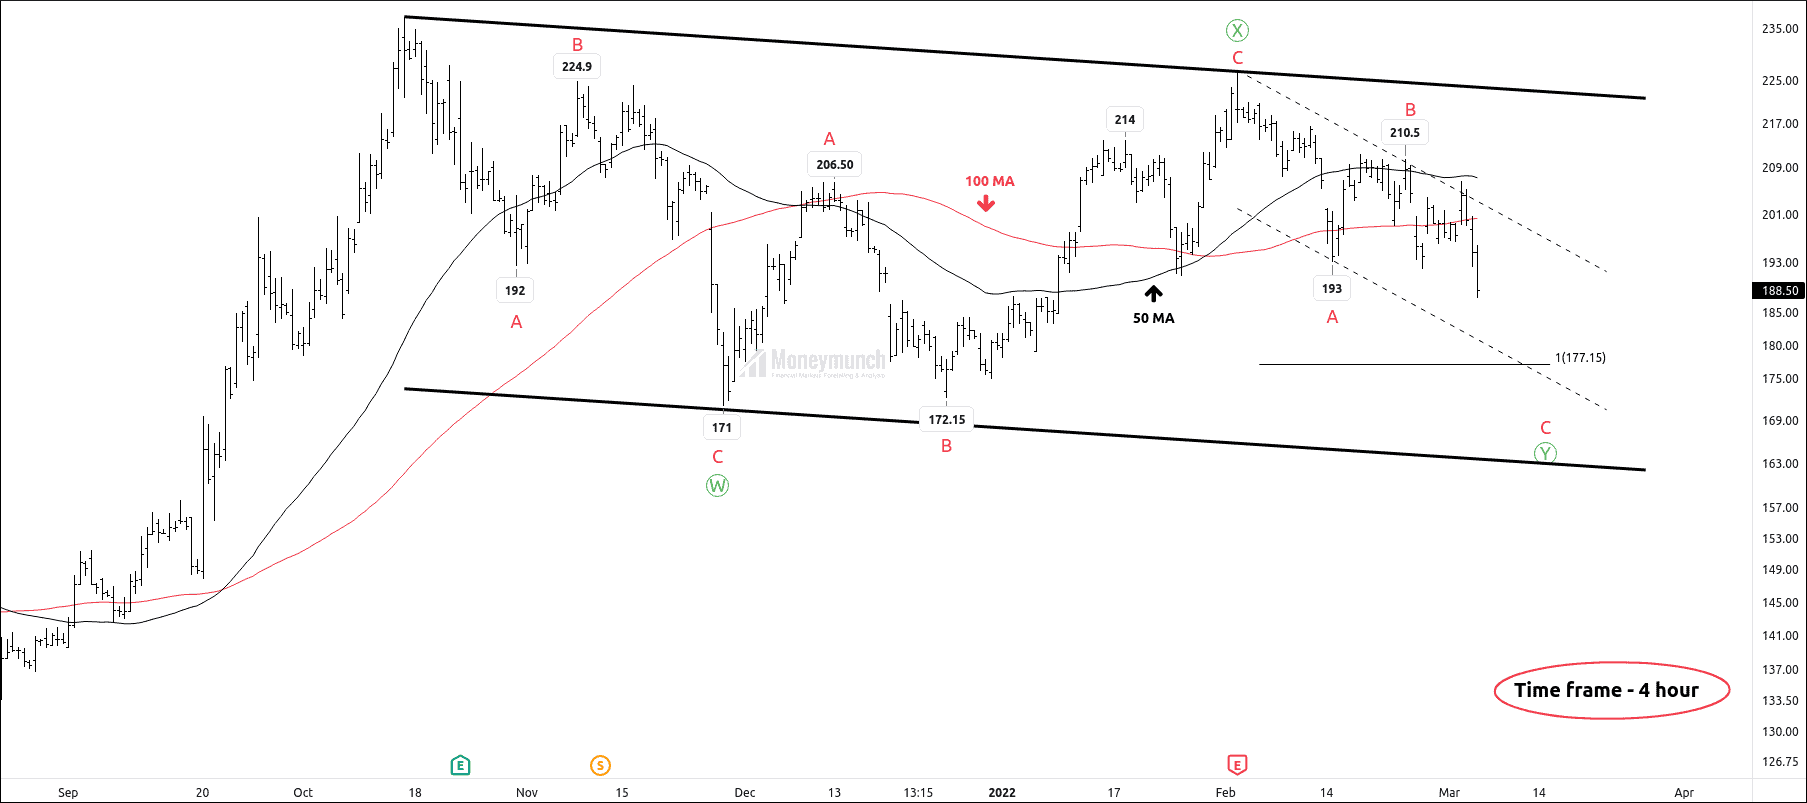
NSE INDHOTEL Has Potential To Continue Bearish Moves
I have also said to sell INDHOTEL yesterday. Have you?
Yesterday: NSE COALINDIA & INDHOTEL – BEARISH OUTLOOK?
I had written, “If the price breaks down the pivot zone & parallel channel, we can expect a down move for 180 – 173+“.
The first target of INDHOTEL of 180 had achieved yesterday. Will it touch the second target?
 Unlock This Article