
Price Action Analysis
Apollo hospital is currently forming on the downward channel.
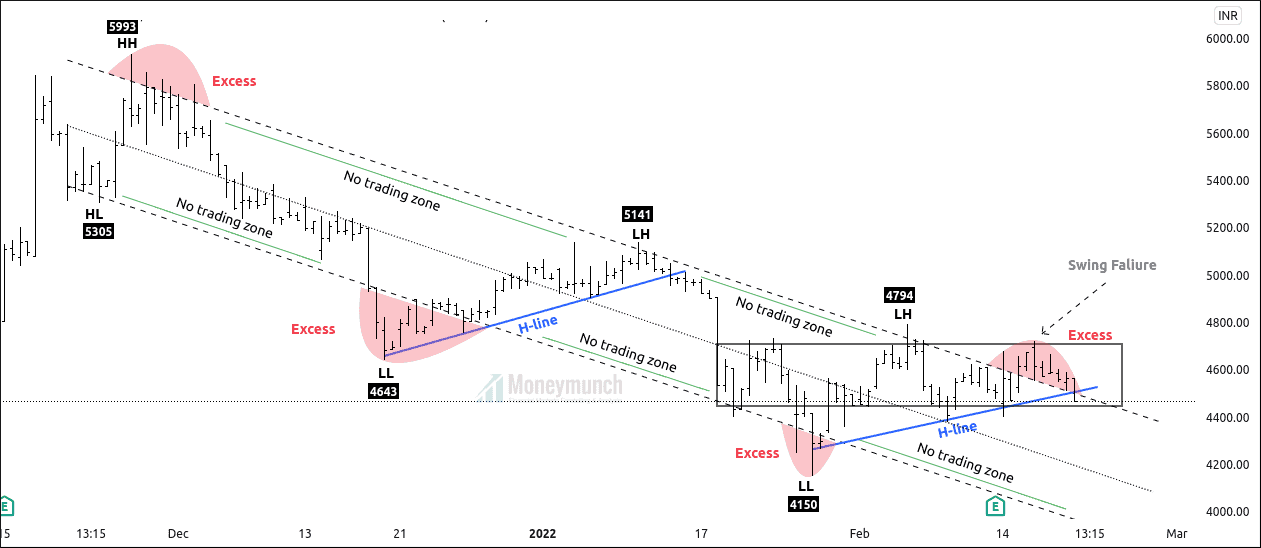
After creating the highest high of 5993, Apollo hospital couldn’t break this level, and supply exceeded the demand.
Price has begun creating lower highs and lower lows to confirm its bearish run.
Excess:
In this channel, we have four price excess. Excess is a signal of a sharp reversal. It indicates that the price can go more in current. Either bulls or bears have to step back to maintain equilibrium.
Excess 1: 5993
Excess 2: 4643
Excess 3: 4150
Excess 4: 4722
H-Lines:
Price has created two h – lines. H-top line holds the bulk of trading activities. After breaking H-lines, it can give a sharp move. It also works as dynamic support and resistance.
No trading zone:
No trading zone indicates negligible trading activities.
Here, traders are not interested in trading decisions.
Price has created five no trading zones.
Upper band & Lower band:
The upper band is the dynamic area where supply exceeds demand. The upper band provides resistance to the price. But, If the price breaks the upper band, the price will likely continue the current trend.
The Lower band is the dynamic area where demand exceeds supply. The upper band provides support to the price. But, If the price breaks the lower band, the price will likely continue the current trend.
Perspective:
Currently, the price is on the upper band of the parallel channel.
The price has created an excess (4724) on the upper band of the channel, which indicates.
If the price sustains under the upper band of the channel, Traders can trade for the following targets: 4401-4345- 4208 and more.
If the price breaks the previous lower high, it can change the trend by making a new high.
Elliott Wave Projection:
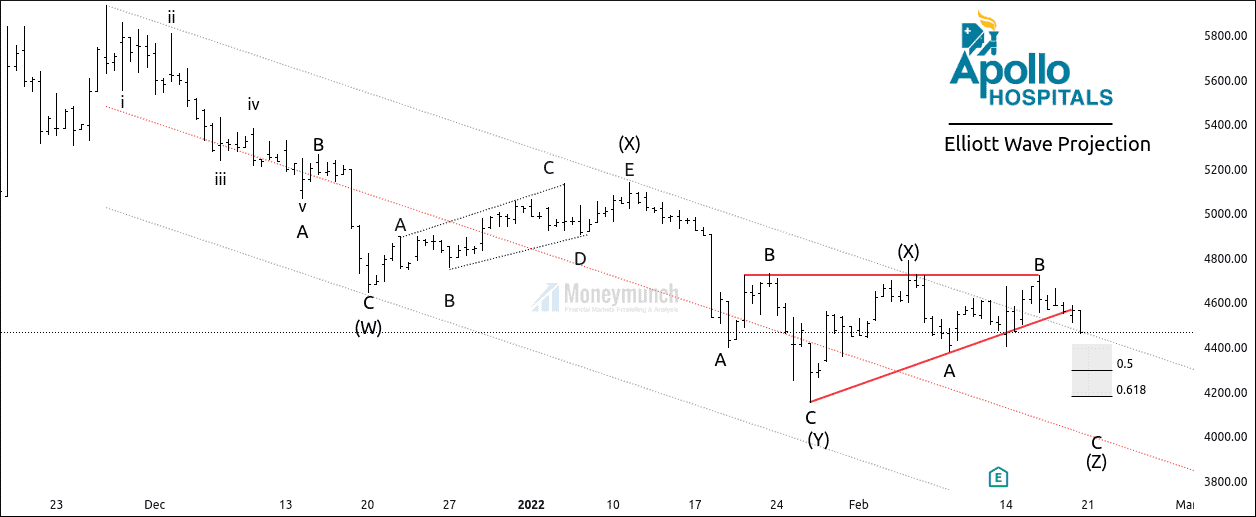
Apollo hospital has formed a triple zigzag, and wave (X) of complex correction has completed at 4794.
Wave (W): 4643
Wave (X): 5141
Wave (X): 4150
Wave (Y): 4794
Wave (Z): –
We are riding the sub-wave C of wave (Z) of a complex correction.
Traders can enter a short position after a pullback for the mentioned target of 4401-4345- 4208.
To become a subscriber, subscribe to our free newsletter services. Our service is free for all.
Alternative Count
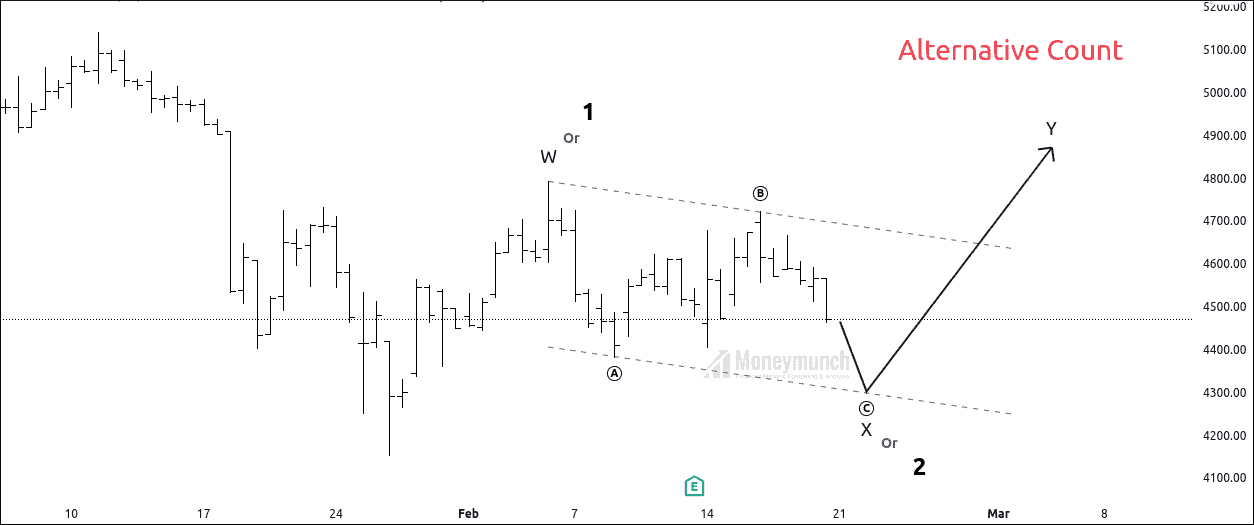
If the supply fails to break the lower low of the Wave(Y), We can follow the alternative Count.
 Unlock This Article
Get free important share market ideas on stocks & nifty tips chart setups, analysis for the upcoming session, and more by joining the below link: Stock Tips
Have you any questions/feedback about this article? Please leave your queries in the comment box for answers.
Thank you for sharing this chart.
I have old positions, and now I am not worried about it
This is a masterpiece.