Elliott wave projection: JSW Steel Trend Analysis
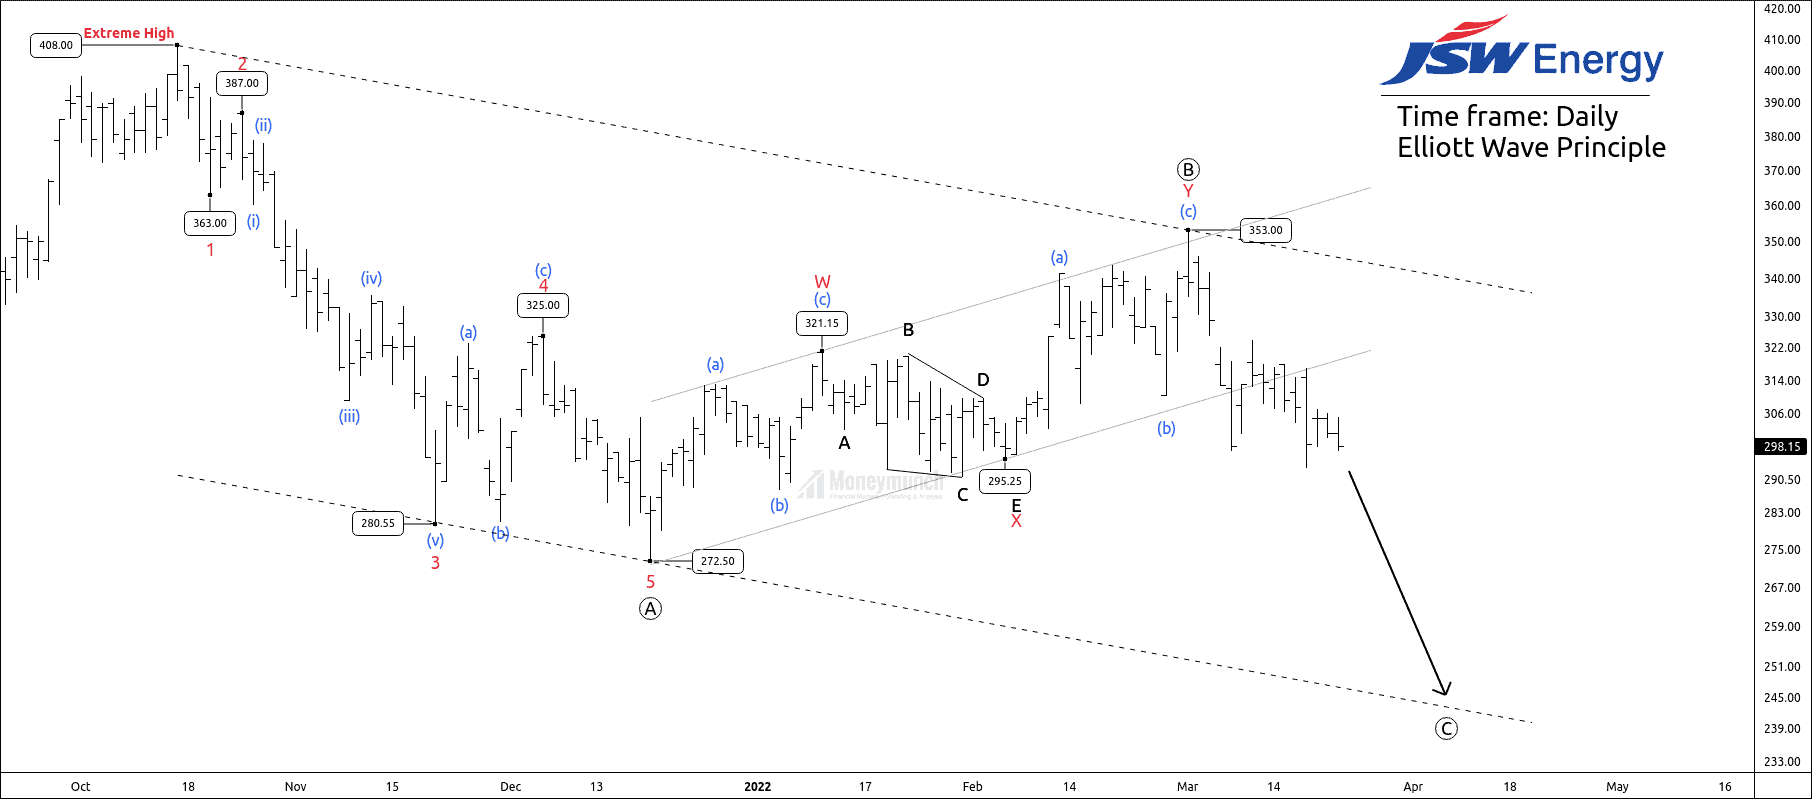
JSW Energy has been forming a downward channel for 22 weeks, and Elliott’s projection illustrates the formation of a corrective structure.
Traders can short for the following targets: 289- 278 – 262 below.
The corrective pattern started unfolding after a high of 408. Let’s discuss wave formations and the Fibonacci relationship of correction.
- Wave ((A)) is an impulse pattern and retraced 78.6% of wave 5.
- Wave ((B)) is a double zigzag and retraced 61.8% of wave ((A)).
- Wave ((C)) is unfolding its pattern, and it has broken down the descending channel of wave ((B)), which indicates that wave impulsive wave has started.
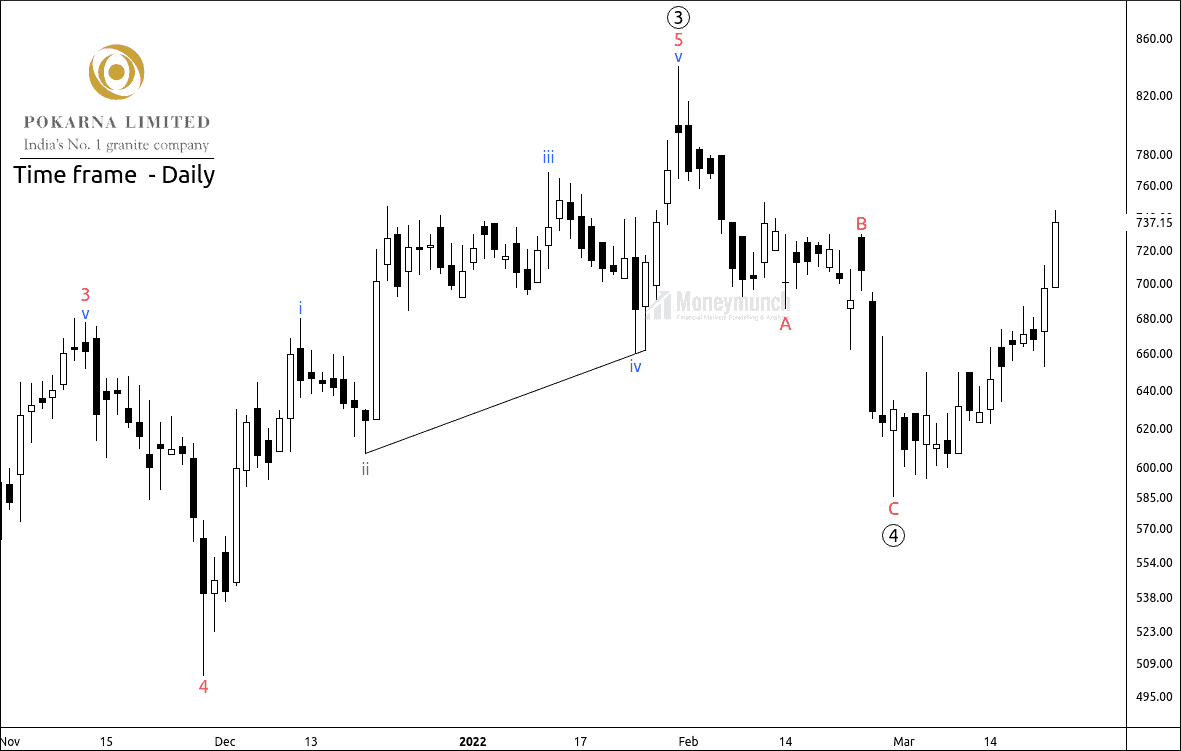
NSE Pokrana Reloads For Another Price Rally
Key Level: 730
POKRANA has completed corrective wave ((4)), and price surged for impulsive wave ((5)).
If the price breaks the corrective wave b, traders can expect the following levels 752 – 770 – 800+ for impending impulse thrust.
To become a subscriber, subscribe to our free newsletter services. Our service is free for all.
NSE Dhani Begins Big Downside Rally Attempt
Dhani is yesterday’s top losers stock. And it has broken the strong support of 68.6 level by closing at 59.7. It’s a black hole for buyers now. The level of 69.6 (invalidation) is the only way to come out from the downtrend.
The day traders will see 55.6 – 52 – 49.6 – 42 below levels.
 Unlock This Article